Sample Category Title
USD/CHF Continued Weakness
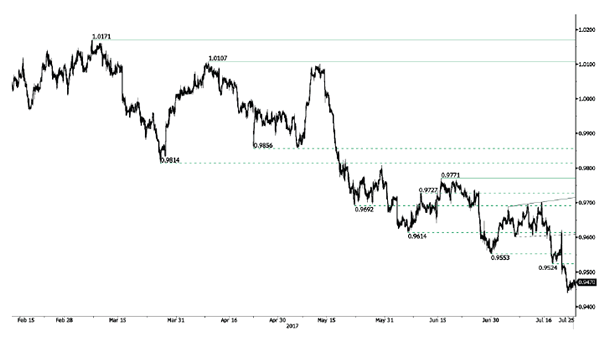
USD/CHF is pushing lower. Hourly resistance can be found at 0.9620 (20/07/2017 high). Strong resistance is given at 1.0107 (10/04/2017 high). Expected to to show further weakness.
In the long-term, the pair is still trading in range since 2011 despite some turmoil when the SNB unpegged the CHF. Key support can be found 0.8986 (30/01/2015 low). The technical structure favours nonetheless a long term bullish bias since the unpeg in January 2015
USD/JPY Weakening
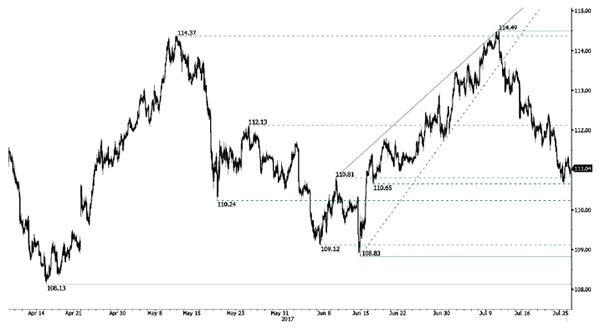
USD/JPY still lies in a bearish momentum. Hourly support given at 110.65 (16/06/2016 low) has been broken. Stronger support is located at a distance at 108.13 (17/04/2017 low). Expected to show continued bearish pressures.
We favor a long-term bearish bias. Support is now given at 96.57 (10/08/2013 low). A gradual rise towards the major resistance at 135.15 (01/02/2002 high) seems absolutely unlikely. Expected to decline further support at 93.79 (13/06/2013 low).
GBP/USD Buying Pressures Are Lively
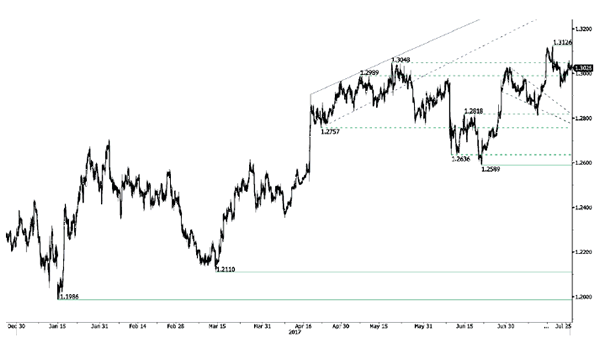
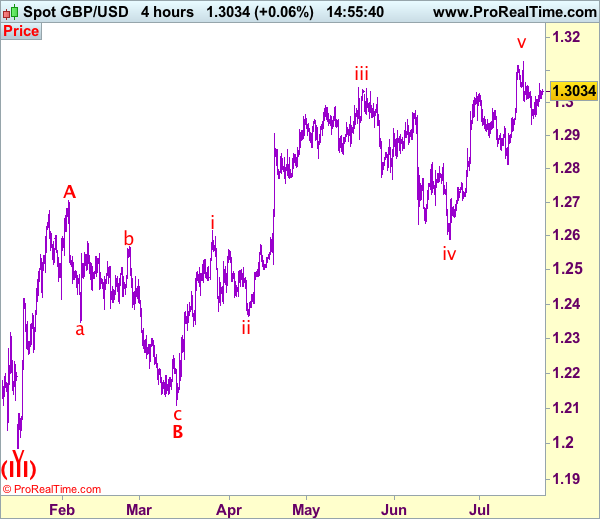
GBP/USD is trading above the 1.3000 mark. Hourly resistance is given at 1.3126 (16/07/2017 high). Hourly support is given at 1.2933 (20/07/2017 low). Expected to show continued bearish pressures.
The long-term technical pattern is even more negative since the Brexit vote has paved the way for further decline. Long-term support given at 1.0520 (01/03/85) represents a decent target. Long-term resistance is given at 1.5018 (24/06/2015) and would indicate a long-term reversal in the negative trend. Yet, it is very unlikely at the moment.
Trade Idea: GBP/USD – Sell at 1.3090
GBP/USD – 1.3023
Recent wave: Wave V of larger degree wave (III) has ended at 1.1986 and major correction has commenced from there for gain to 1.3000 and 1.3140-50
Trend: Near term up
Original strategy :
Sell at 1.3090, Target: 1.2890, Stop: 1.3150
Position: -
Target: -
Stop: -
New strategy :
Sell at 1.3090, Target: 1.2890, Stop: 1.3150
Position: -
Target: -
Stop:-
Yesterday’s rebound to 1.3058 has retained our view that further consolidation above 1.2933 would be seen and initial upside risk remains for the recovery from this last week’s low to bring further gain to 1.3062, however, if our view that top has been formed at 1.3126 is correct, upside should be limited to 1.3090-00 and bring another decline later, below 1.2950-55 would signal the rebound from 1.2933 has ended, bring test of this level, break there would add credence to our view and extend the fall from 1.3126 top to 1.2910-15, break there would provide confirmation, then further fall to 1.2870-80 would follow but reckon support at 1.2812 would remain intact, bring rebound later.
Our preferred count on the daily chart is that cable's rebound from 1.3500 (wave (A) trough) is unfolding as a wave (B) with A ended at 1.7043, followed by triangle wave B and wave C as well as wave (B) has ended at 1.7192, the subsequent selloff is the larger degree wave (C) which is still unfolding with minor wave (III) of larger degree wave 3 ended at 1.1986, hence wave (IV) correction is in progress which could either be a triangle wave (IV) of a complex formation but upside should be limited to 1.3500 and price should falter well below 1.4000, bring another decline in wave (V) of 3 for weakness to 1.1500, then 1.1200.
On the upside, whilst further recovery to 1.3062 cannot be ruled out, price should falter below 1.3100 and bring another retreat later. A break above last week’s high of 1.3126 would signal recent upmove is still in progress and may extend headway to 1.3150, then towards 1.3190-00 but loss of upward momentum should limit upside to 1.3250, bring another retreat later.
EUR/USD Continued Bullish Momentum
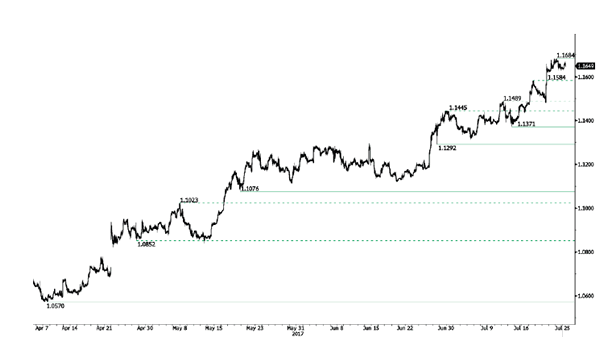
EUR/USD bullish pressures continue. Hourly resistance given at 1.1584 (18/07/2017 high) has been broken. Other hourly resistance can be found at 1.1684 (24/07/2017 high). Hourly support can be found at 1.1371 (13/07/2017 high). Stronger support lies at 1.1292 (28/06/2017 low). Expected to show continued bullish pressures.
In the longer term, the momentum is clearly negative. We favour a continued bearish bias towards parity. Key resistance holding at 1.1714 (24/08/2015 high) is on target while strong support lies at 1.0341 (03/01/2017 low).
Technical Outlook: AUDUSD – Holding In Narrowing Range Ahead Of Aus CPI Data, FOMC
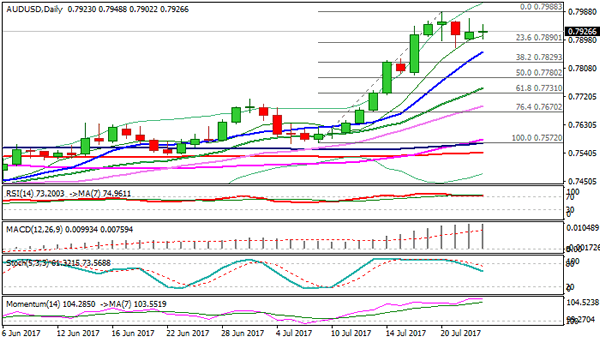
The Aussie dollar is holding in a choppy near-term trading, entrenched within narrowing range, following strong rejections at both sides (0.7988 at the upside and 0.7874 at the downside) in recent sessions.
Solid support at 0.7900 is holding the downside for now, while session high at 0.7948 marks initial resistance.
Overall bullish structure keeps focus at psychological 0.8000 barrier which so far resisted attacks and eventual break here would spark further upside action and expose next target at 0.8164 (14 May 2015 high / 50% of larger 0.9503/0.6825 descend).
Australian inflation data are in focus (CPI q/q is expected to slow in Q2 according to the forecast at 0.4% vs 0.5% in Q1), with RBA Governor Lowe also due to speak on Tuesday and expected to give signals about central bank's monetary policy, following hawkish minutes of previous meeting, released last week, which boosted the Aussie dollar.
Traders are also looking for signal from Fed which ends its two-day policy meeting tomorrow.
On the other side, signals of reversal generated by reversal of slow stochastic from overbought zone on daily chart and overbought daily RSI, keep the downside vulnerable.
Sustained break below 0.7900 support zone (reinforced by Fibo 23.6% of 0.7572/0.7988 rally and rising 10SMA) would generate initial bearish signal for extension towards pivotal support at 0.7830 (Fibo 38.2%), break of which would trigger deeper correction.
Res: 0.7948, 0.7967, 0.7988, 0.8000
Sup: 0.7900, 0.7874, 0.7830, 0.7800
Trade Idea: GBP/JPY – Sell at 145.90
GBP/JPY - 144.56
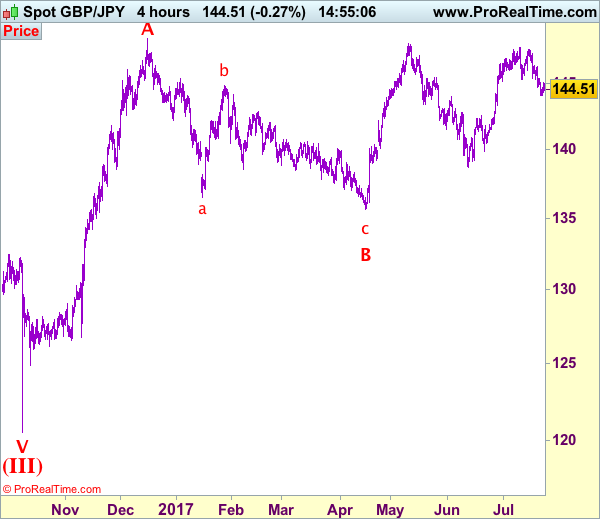
Recent wave: Medium term low formed at 120.50 and (A)-(B)-(C) major correction has commenced with (A) leg ended at 148.45, hence wave (B) is unfolding for retreat to 131.00-10.
Trend: Near term up
Original strategy:
Sell at 145.30, Target: 143.30, Stop: 145.90
Position: -
Target: -
Stop: -
New strategy :
Sell at 145.90, Target: 143.90, Stop: 146.50
Position: -
Target: -
Stop:-
Sterling continued finding support at 144.05 and has recovered, suggesting minor consolidation would be seen and initial recovery to 145.50-60 cannot be ruled out, however, upside should be limited to 146.00 and bring another decline later, below said support at 144.05 would add credence to our view that a temporary top has been formed at 147.75 earlier this month, bring retracement of recent upmove to 143.50, then towards support at 143.30, however, oversold condition should limit downside to 142.90-00 and price should stay above previous resistance at 142.50.
In view of this, would not chase this fall here and we are looking to sell sterling on further subsequent recovery as 145.90-00 should limit upside, bring another decline. Above resistance at 146.30-35 would abort and signal low is formed instead, bring a stronger rebound to 146.90-00 later.
Our preferred count is that larger degree wave V with circle is unfolding from 251.12 with wave (I) 219.34, (II): 241.38 and wave (III) is subdivided into 1: 192.60, 2: 215.89 (23 Jul 2008) and wave 3 ended at 118.87 earlier in 2009. The correction from there to 162.60 is wave 4 which itself is a double three and is labeled as first a-b-c ended at 151.53, followed by wave x at 139.03, 2nd a ended at 162.60, 2nd b at 146.75 and 2nd c leg of wave 4 ended at 163.00. Therefore, the decline from 163.00 to 116.85 is now treated as wave 5 which also marked the end of larger degree wave (III), hence wave (IV) major correction has commenced for retracement of the wave (III) from 241.38 and upside target at 183.95-00 (50% Fibonacci retracement of the wave (II) from 241.38) had been met, a drop below 160.00 would suggest wave (IV) has ended at 195.85, bring decline in wave (V) for initial weakness to 130 (already met) and 120.
CHF Ahead Of Further Weakness, BRL’s Rally Is Complete
Brazilian real declines after massive rally
Over the last four weeks the Brazilian real rallied more than 7% against the greenback amid easing political uncertainties. USD/BRL fell from 3.3485 to 3.1111 before stabilising at around 3.1450. The move came on the back of falling odds that Michel Temer would face corruption prosecutions together with the approval by Senate of a labour reform. Even though Michel Temer is not out of the wood yet, investors did not wait the final outcome to jump back into USD/BRL’s juicy carry trade.
However, the rapid appreciation of the real has triggered massive profit taking over the last few days, suggesting that investors do not anticipate further gains. Indeed, USD/BRL erased completely the gains resulting from speculations about Temer’s potential impeachment and has since then stabilised.
We do not rule out further marginal appreciation of the real. However, the correction is not complete and further positive developments on the political side, especially regarding the fiscal situation of the country, are required for justifying a stronger real. In addition, we expect the USD to get one’s head out of the water as the Fed’s tightening story will move back to the front stage, while the BCB is expected to continue easing monetary condition, which would reduce gradually the incentive to play the carry.
More Selling CHF to come
Judging from the bullish rush in the Euro the global reflation trade is back on. Investors are piling into risky asset to capture real returns, driving inflows into equities (relative growth over value) and EM. Tomorrow fed meeting is unlikely to shift the current markets psyche also a minor, short term correction in USD oversold positing is possible. Commodities prices have continued to move higher lead by crude prices. OPEC meeting today failed to indicate additional supply cuts yet crude prices remained bullish.
Nigeria and Libya ruled out cuts as they restored disrupted productions facilities, while both Russia and Oman have indicated that further productions limits would not support oil prices. On the other side of the trade, Halliburton has suggest that the shale boom is decelerating. Even the chaos in the US president trump administrations with son in-law Kusher denying improper Russian contact and rumors of foreign secretary Tillerson resignations later this summer has failed to derail the reflation trade. Stronger commodity prices should provide support for interest rates, which have already falling significantly. With risk to further downside in yields, low yielding currencies should come under selling pressure. Reiterated the standard corporate line, SNB’s Jordan stated that the CHF was still considerably overvalued.
The JPY has been difficult to call due to the expectations for a shift in monetary policy however; the SNB is clearly going nowhere. With buying pressure, subsiding from CHF the central bank can sustain its current policy indefinably (unlike the BoJ, which continues to expand balance sheet). We anticipate further CHF deprecation against most G10 and EM currencies in the current environment.
Forex Technical Analysis: EUR/USD, USD/JPY, GBP/USD
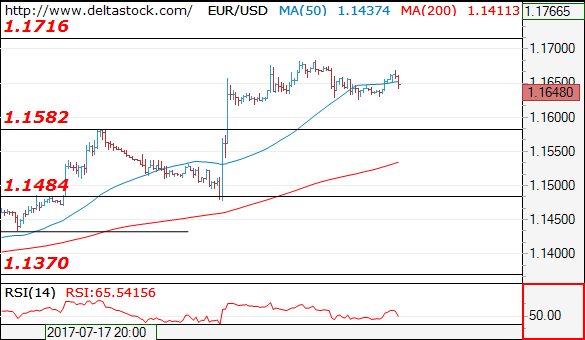
EUR/USD
Current level - 1.1648
The bias is rather neutral within the consolidation pattern below 1.1683, so allow another dip to 1.1580 area before renewal of the general uptrend beyond 1.1720.
| Resistance | Support | ||
| intraday | intraweek | intraday | intraweek |
| 1.1683 | 1.1720 | 1.1580 | 1.1370 |
| 1.1720 | 1.1720 | 1.1480 | 1.1290 |
USD/JPY
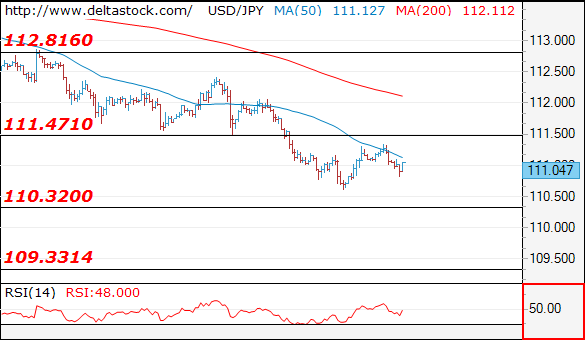
Current level - 111.04
Current rebound above 110.60 should be considered corrective and 111.50 should cap the upside, for another leg downwards, to 110.30 area, en route to 109.30.
| Resistance | Support | ||
| intraday | intraweek | intraday | intraweek |
| 111.50 | 114.50 | 110.30 | 110.30 |
| 112.80 | 115.50 | 109.30 | 108.10 |
GBP/USD
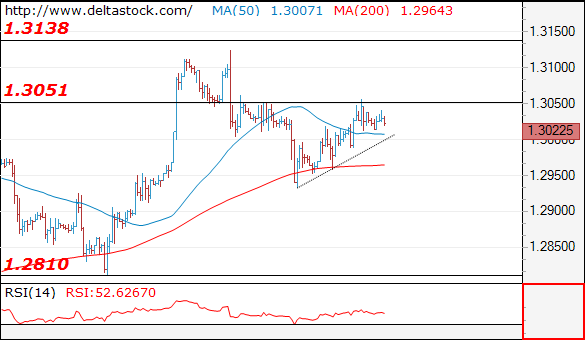
Current level - 1.3022
My outlook remains positive, for a violation of 1.3050 area, towards 1.3090 intraday resistance. The inner structure of the rise from 1.2930 is far from an impulsive one, so one should pay close attention of the dynamic support at 1.2990, as an eventual breach of the later will signal a reversal of the bias.
| Resistance | Support | ||
| intraday | intraweek | intraday | intraweek |
| 1.3050 | 1.3260 | 1.2990 | 1.2810 |
| 1.3130 | 1.3500 | 1.2810 | 1.2480 |
Technical Outlook: USDJPY – Reversal Signal Is Forming On Daily Chart
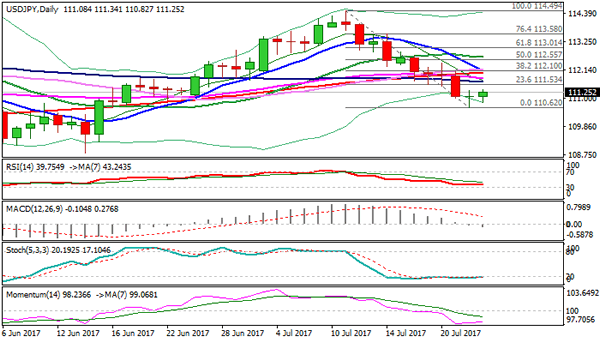
Downtrend from 114.49 (11 July high) showed initial signs of stall after Monday's trading was shaped in long-legged Doji candle and closed above strong support at 110.97 (Fibo 61.8% of 108.80/114/94 rally) after dipping to 110.62. Also, base of daily cloud (spanned between 110.74 and 111.23) contained Monday's dip, reinforcing strong support zone which is holding broader bears for now. Fresh strength on Tuesday is attempting above daily cloud, with strong bullish close today needed to complete reversal pattern (Morning Doji Star) and signal correction. Slow stochastic is turning higher in oversold zone on daily chart (bullish divergence has also been formed) and supports scenario. However, limited upticks are seen as strong resistance zone lies between 111.65 and 112.10 (formed by a number of daily SMA's in bearish setup). Key barrier at 112.10 also marks Fibo 38.2% retracement of 114.49/110.62 fall and weekly cloud top, break of which is expected to cap extended upticks before bears resume for final attack at psychological 110.00 support. Conversely, sustained break above 112.10 would generate stronger bullish signal and sideline bears for stronger correction.
Res: 111.65, 111.80, 112.10, 112.63
Sup: 110.97, 110.79, 110.62, 110.23