Sample Category Title
Foreign Exchange Market Commentary: EUR/USD, USD/JPY, GBP/USD, GOLD, WTI CRUDE, DJIA, FTSE100, DAX
EUR/USD
Caution prevailed among FX investors at the beginning of the week, with the greenback ending the day marginally higher against most of its major rivals. The EUR/USD pair anyway, remained near a recent two-year high of 1.1683, as worse-than-expected US housing data interrupted dollar's recovery. European data released at the beginning of the day failed to trigger EUR's demand, as July Markit preliminary PMIs came below market's expectations and previous month final readings. Growth in the private sector lost momentum according to Markit, with the composite index down to 55.8 from previous 56.3, its lowest in six months. In the US, however, the figures surprised to the upside, with the manufacturing and services sectors expanding at their fastest pace in four months, and the Composite index resulting at 54.2 from previous 53.9, a six-month high. Existing home sales, however, edged sharply lower in June, down by 1.8% to 5.52 million amid low supply.
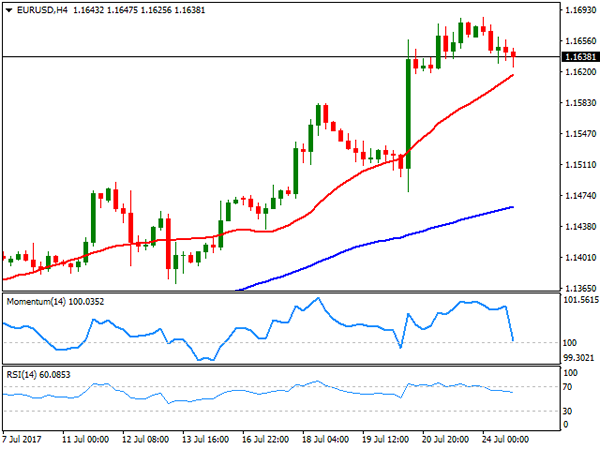
From a technical point of view, the pair is set to correct further lower short term, as in the 4 hours chart technical indicators turned south, with the Momentum aiming to cross below its 100 level and the RSI indicator at 57. The 20 SMA in the mentioned chart stands around 1.1615, 2016 yearly high and the immediate support. Below the level, the corrective movement can extend down to 1.1580 June 18th high. Further declines seem unlikely ahead of Fed's monetary policy announcement on Wednesday, moreover as the macroeconomic calendar has little relevant figures to offer this Tuesday.
Support levels: 1.1615 1.1580 1.1530
Resistance levels 1.16600 1.1710 1.1745
USD/JPY
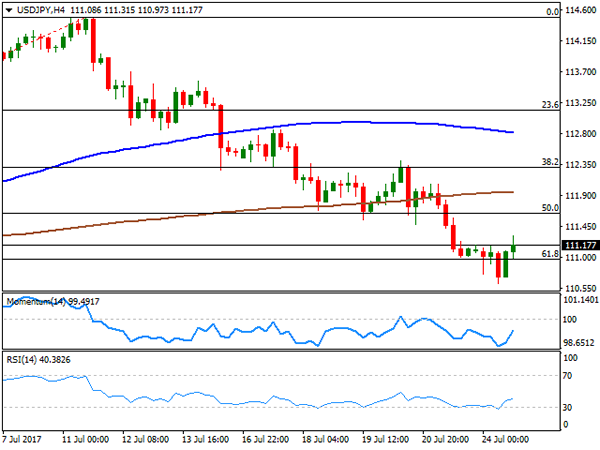
The USD/JPY pair bounced from a fresh monthly low of 110.61 to end the day a couple of pips above Friday's close. Data coming from Japan at the beginning of the day were generally soft, with the Nikkei Flash manufacturing PMI dropped to an eight-month low of 52.2 in July from 52.4 in June, while the Leading Index increased modestly when compared to April up to 104.6 from 104.2 in April. The Coincident index that reflects the current economic activity fell to 115.8 in May from a revised 117.1 in the prior month. US treasury yields bounced modestly, weighing on the yen during the US afternoon after a soft start to the day, with the 10-year benchmark up to 2.26% from previous 2.23%. The pair settled above a huge Fibonacci support at 110.90, the 61.8% retracement of its latest weekly advance after having spent most of the day below it, still at risk of falling further, as in the daily chart, the price remains below its 100 DMA, while technical indicators maintain their bearish slope within negative territory. In the 4 hours chart, technical indicators have bounced from oversold readings, but remain within negative territory while the price remains well below its 100 and 200 SMAs, limiting chances of a steeper advance.
Support levels: 110.90 110.55 110.20
Resistance levels: 111.45 111.90 112.35
GBP/USD
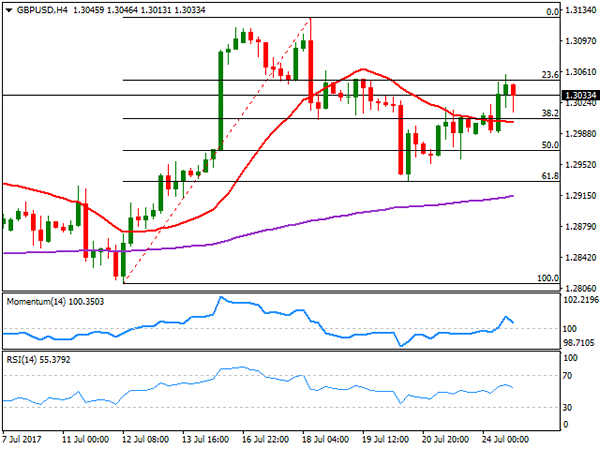
The GBP/USD pair extended its Friday's advance and recovered the 1.3000 threshold, reaching a 4-day high of 1.3057 before settling around 1.3030. There were no macroeconomic releases in the UK, with attention focused on UK's Q2 GDP, to be released next Wednesday. Growth is expected to have decelerated in the three months to June, seen yearly basis at 1.7% from previous 2%. In the meantime, the 4 hours chart shows that the pair has pared gains around the 23.6% retracement of its latest bullish run the immediate resistance at 1.3050. Also, the pair has managed to advance above an anyway flat 20 SMA that converges with the 38.2% retracement of the same rally at 1.3010, while technical indicators have turned lower within positive territory, indicating that further gains are conditioned to the pair's ability to advance beyond the mentioned Fibonacci resistance. In that case, the pair has scope to retest its July high at 1.3125, but further gains seem unlikely ahead of Wednesday's macroeconomic events involving both economies.
Support levels: 1.3050 1.3085 1.3125
Resistance levels: 1.3010 1.2965 1.2920
GOLD
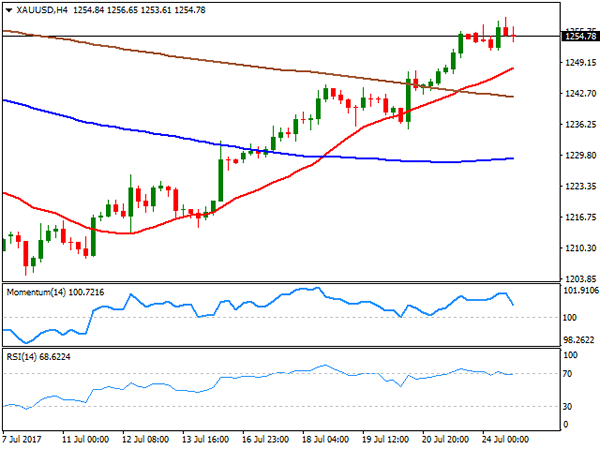
Spot gold closed the day pretty much flat at $ 1,254.80 a troy ounce, having, however, extended its advance up to 1,258.75, its highest for this July. More political jitters in the US, as President Trump press secretary, Sean Spicer quit over the weekend, kept the dollar in check. Spot's daily chart shows that the commodity held above its 100 DMA, while the Momentum extended its advance, no nearing overbought levels, whilst the RSI indicator consolidates around 64, all of which maintains the risk towards the upside. In the 4 hours chart, the 20 SMA has accelerated its advance beyond the 200 SMA, with the shortest now around 1,247.95, although technical indicators are currently retreating from overbought levels, suggesting a possible downward corrective movement ahead, particularly on a break below the daily low of 1,251.86.
Support levels: 1,251.90 1,242.50 1,236.30
Resistance levels: 1,258.80 1,266.60 1,274.10
WTI CRUDE OIL
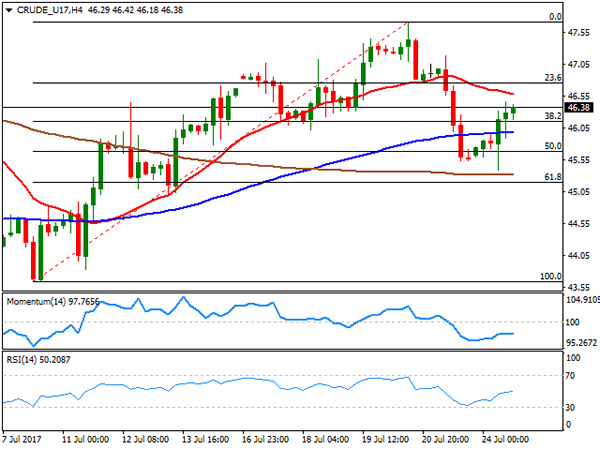
West Texas Intermediate crude oil futures closed at $46.38 a barrel, up from a daily low of 45.39, as in the OPEC and non-OPEC producers' meeting that took place it Saint Petersburg, Nigeria agreed to limit its oil output to 1.8 million barrels per day. Earlier on the day, the Saudi Energy minister announced that the kingdom will cut its oil allocations to customers during August, capping its oil exports at 6.6 million bpd. The daily chart shows that the black gold regained its positive bias as in the daily chart, the price settled back above it 20 DMA, also above the 38.2% retracement of its latest downward move at 46.15, whilst technical indicators resumed their advances after bouncing at their mid-lines. In the 4 hours chart, however, technical indicators remain below their mid-lines, with the Momentum aiming north, but the RSI flat around 49, and a bearish 20 SMA capping the upside around 46.20.
Support levels: 46.10 45.50 44.85
Resistance levels: 46.25 46.80 47.40
DJIA
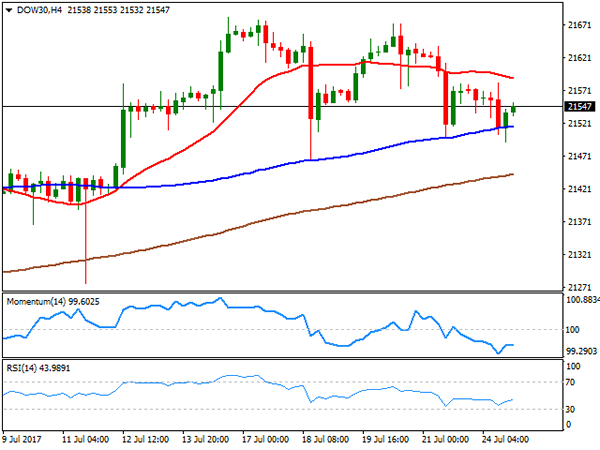
Wall Street closed mixed, with the Dow Jones Industrial Average down 56 points or 0.26%, to 21,523.58 and the S&P down 2 points, to 2.470.06. The Nasdaq Composite, on the other hand, set another record high, adding 23 points and finishing at 6,410.81. Within the Dow, Caterpillar was the best performer, up 1.55%, followed by Apple that added 1.29%. General Electric was the worst performer, shedding 1.87%, followed by Nike that closed 1.64%. From a technical point of view, the daily chart for the DJIA shows that the index keeps losing upward strength, but the movement remains as corrective, as its not far from record highs and around June's top. The mentioned chart shows that despite a brief slide below it, the index settled above a bullish 20 SMA, whilst the Momentum indicator turned south within positive territory as the RSI indicator extended its decline, currently at 53. While this seems not enough to confirm a bearish extension, the risk of a downward move increased. Shorter term, and according to the 4 hours chart, technical indicators lost upward strength after a modest bounce from near oversold levels, while the index remained below a bearish 20 SMA, supporting the longer term perspective.
Support levels: 21,493 21,464 21,418
Resistance levels: 21,570 21,628 21,673
FTSE100
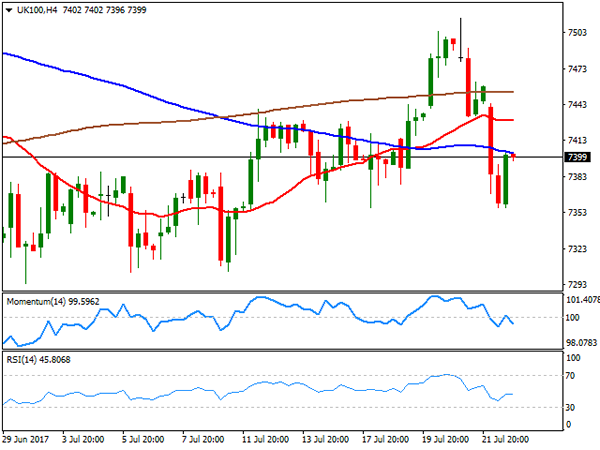
The FTSE 100 closed at7,377.73, down 1.01% or 74 points, with falls in airlines shares leading the way lower, also weighed by a stronger Pound. Ryanair said that it will cut its fares by as much as 9% on some routes during the next few months, hitting the sector. The best performer was Micro Focus International that added 1.46%, followed by Anglo American that gained 1.19%. Reckitt Benckiser Group led decliners, down 3.27%, followed by Next that shed 3.06%. Down for a second consecutive day, the index is currently a few points above the 20 and 100 SMAs, both converging at 7,385 and offering an immediate support, whilst technical indicators turned south, currently about to enter negative territory. In the 4 hours chart, the index is biased lower, as the index remains below all of its moving averages, while technical indicators turned south after failing to surpass their mid-lines.
Support levels: 7,385 7,434 7,290
Resistance levels: 7,435 7,482 7,518
DAX
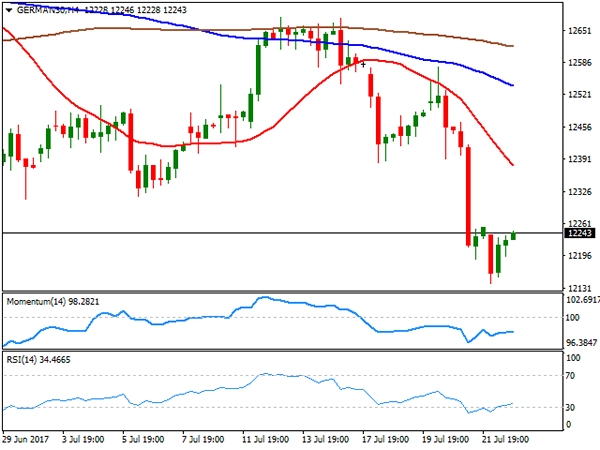
European equities closed mixed this Monday, with the German DAX ending at 12,208.95, down by 31 points as softer-than-expected preliminary PMIs for July and a decline in the automotive sector weighed. Carmakers fell amid fears of a new scandal in the sector, on allegations the companies colluded on technology for decades. Bayerische Motoren led decliners, down 2.53%, followed by Daimler that shed 2.15%. Banks led gainers, with Commerzbank up 3.24% and Deutsche Bank adding 3.02%. The index bounced modestly in after-hours trading, heading into the Asian opening around 12,250, but still looking bearish, given that in the daily chart, the index is well below its 20 and 100 DMAs, whilst technical indicators stand pat within negative territory. In the 4 hours chart, the index remains far below its moving averages, whilst technical indicators lost upward strength within bearish territory, after a modest correction from oversold readings, also in line with additional slides.
Support levels: 12,234 12,190 12,153
Resistance levels: 12,278 12,310 12,367
Bank Of Japan Holds Policy Steady But Cuts Inflation Forecasts
Summary
- BoJ leaves interest rates and stimulus program unchanged
- Inflation forecasts pushed further back
- BoJ expectations inflation to rise 1.8% in the fiscal year 2018/2019
- BoJ upgrades GDP expectations, attributes it to the central bank's QQE program
- BoJ expects inflation to reach 2% sometime during 2019
The Bank of Japan met last Thursday, July 20 for its monthly monetary policy meeting. As widely expected, the Bank of Japan left the key interest rates unchanged at -0.10% and its QQE stimulus program untouched.
The central bank maintained the yield target on the 10-year Japanese Government Bonds (JGB's) around zero percent.
The central bank reiterated its commitment towards achieving the inflation target, thus noting that the QQE program would stay until the inflation target was met.
BoJ lowers inflation forecasts, upgrades GDP
In a surprise move, however, which was expected from some circles, the BoJ lowered the inflation forecasts for 2017 and 2018 and beyond for the next two years. However, the central bank upgraded the gross domestic product (GDP) forecasts for the same period.
According to central bank communication, inflation is expected to be at 1.1% for the fiscal year 2017. This was lower than the 1.4% inflation forecast that the central bank had previously forecast.
For the next fiscal year, the BoJ said that inflation could rise to 1.8%, slightly down from the previous forecasts of 1.9%. The timing of the inflation expectations was also pushed back with expectations that the central bank will reach the 2% inflation target sometime in 2019.
"The timing of the year-on-year rate of change in the CPI reaching around 2 percent will likely be around fiscal 2019," the BoJ said in its official statement.
Some economists were expecting that the BoJ could completely shift its stance from inflation targeting, which did not happen.
While inflation forecasts were lowered, there was some positive news on growth. The BoJ was upbeat, noting that the GDP expectations for the current year could be around 1.8%, followed by a 1.4% increase for the next fiscal year.
The GDP forecasts were higher than the previous estimates given, which was 1.6% for the current fiscal year and 1.3% for the year after.
Japan's GDP at 1.3% in Q1 of 2017
According to the most recent estimates, data showed that Japan's GDP grew at an annual rate of 1.3% in the first quarter of 2017. Previously, the GDP growth rate was registered at 1.6% which marked four consecutive quarterly periods of expansion.
At 1.3%, Japan's GDP is still somewhat higher and better than the third quarter 2016 GDP which was registered at 1.1%.
The BoJ's statement said that the Japanese economy would continue to expand at a moderate pace. The central bank noted that domestic demand would be following an uptrend with income and spending driving growth both on the household and corporate sectors. This was attributed to the BoJ's QQE program.
The most recent data, however, showed that inflation is Japan continues to remain stubbornly weak. The wider economy is expected to be a firm footing, however, earlier in the day, data showed that exports in Japan rose at a pace of 9.7% in June. This was higher than the expectations of 9.5%.
By pushing inflation forecasts even further, this makes it the fourth time since Kuroda; the BoJ governor began the massive monetary stimulus program in 2013. The BoJ's unchanged stance comes at a time when central banks elsewhere are beginning to tighten monetary policy.
Conflicting Forces Await AUD Tomorrow
The conflicting forces await AUD tomorrow which could instil volatility back into the battler.
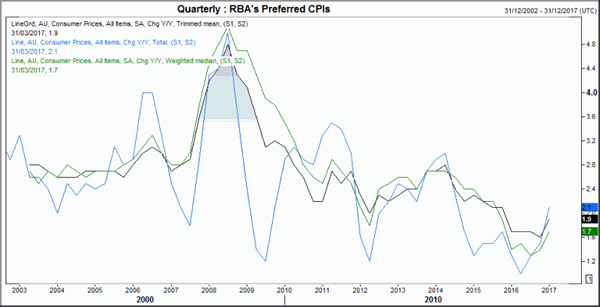
Conflicting forces await AUD tomorrow which could instil volatility back into AUD crosses. On one hand, any sign of a pick-up of inflation could get hawks and bulls into a frenzy as AUD traders gun for 80c once more. On the other hand, the RBA aren't going to like it. As the RBA Governor Philip Lowe speaks just 90 minutes after the CPI set, we think the risk of another verbal intervention is high.
The recent pickup with CPI is a good sign for the economy, although RBA doubt its ability to sustain the current trajectory and for it to be variable over the coming quarters. It is for this reason that inflation does surprise to the upside, it may be more of a surprise. So, RBA have the to figure out the delicate balance of hoping for better economic data whilst simultaneously hoping for a weaker Australian Dollar. We argue that higher CPI is not even required to warrant another jawbone, yet stronger CPI only further reinforces the probability of it.
AUD currently sits in a holding pattern ahead of tomorrow's CPI data, with the Fed meeting also suppressing volatility for now. As this holding pattern is above the 2016 high (a level which was smashed after RBA's last meeting) it could be argued Debelle's jawboning needs reinforcement. And there's no better person to do it than Lowe.
Technically it could be forming a bullish triangle which would assume a direct break of 80c once the APEX has been completed. Whilst we remain above the weekly pivot (purple line) then we expect buyer to step in and support it, although a break beneath it suggests a return to the 2016 high.
However, what is really causing RBA a headache is the weak US Dollar which continues to plummet thanks to unfavourable Whitehouse circumstances and weak data. If this trend continues, then it is hard to see how the RBA can single handily control AUD lower.
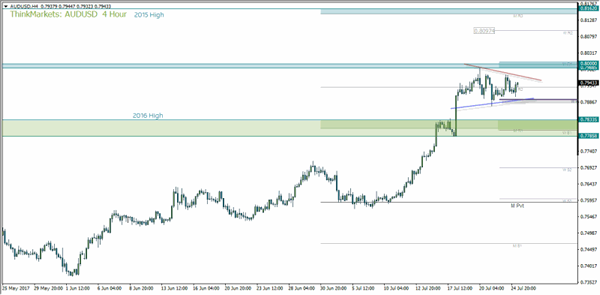
This also makes it likely any downside move may be limited as AUD is by far the stronger currency than USD on several timeframes. Moreover, as technicals, sentiment and fundamentals point lower for USD, the expectation of a dull Fed meeting only add to the reasons to not ‘bottom pick' the Dollar (At least not for too long) which means AUD may end up breaking 80c regardless of what happens domestically.
Technical Outlook: GBPUSD Remains Capped At 1.3050 But 1.3000 Pivot Stays Intact For Now
Cable stands at the back foot in early Tuesday's trading, following strong upside rejection at key near-term barrier at 1.3051 (Fibo 61.8% 1.3125/1.2932 pullback / 19 July high) on Monday (the price hit daily high at 1.3058 but closed at 1.3026).
Good offers lay at 1.3050 zone and keep near-term bias shifted lower for retest of strong support at 1.3000 (psychological level / hourly cloud top / rising daily Tenkan-sen).
Bullish daily studies favor further upside, with 1.3000 handle required to hold dips and sustained break above 1.3051 needed to re-focus targets at 1.3100/25, as weaker dollar supports pound's bulls.
Return below 1.3000 (also trendline support) and extension below 1.2980 (base of thick 4-hr cloud) would weaken near-term tone and risk return to key near-term support at 1.2931 (20 July correction low / Fibo 61.8% of 1.2811/1.3125 rally).
Res: 1.3051, 1.3080, 1.3100, 1.3125
Sup: 1.3013, 1.3000, 1.2980, 1.2968
Technical Outlook: EURUSD Is Holding In Directionless Mode Ahead Of Fed
Near-term directionless mode extends in the third straight day, with EURUSD pair holding within 1.1620/80 range, awaiting conclusions from FOMC two-day meeting which ends on Wednesday.
The Euro regained traction and moved higher in Asia, after being in red on Monday, deflated by short recovery of the dollar.
No clear near-term direction signals seen while the pair is holding within the current range.
Overall bulls look for final push towards key barriers at 1.1713/35 but weighed by overbought daily studies (no bearish signal for now).
Pivotal supports at 1.1620/00 (range floor / Fibo 38.2% of 1.1479/1.1684 upleg) stay intact for now and break here is needed to generate bearish signal for correction.
At the upside, tops at 1.1682/84 and round-figure 1.1700 barrier, guard upper triggers at 1.1713/35, break of which would spark significant upside action.
Fed’s post-meeting tone is expected to give firmer signals for near-term direction.
Res: 1.1668, 1.1684, 1.1700, 1.1713
Sup: 1.1620, 1.1600, 1.1580, 1.1557
EURJPY Ranging Since Reaching 18-Month High, Medium-Term Bullish
EURJPY has experienced significant advancing since mid-April, reaching all the way up to 130.76, the near eighteen-month high from July 11. The pair has since moved within a relatively narrow range.
Delving into the Ichimoku analysis, the Tenkan-sen line (red) remains above the Kijun-sen (blue) after crossing above it in late June – this positive alignment is suggesting the existence of a bullish bias for the pair.
Turning to RSI and looking at momentum in the very short-term, the indicator is comfortably in bullish territory at 60 but it flatlined, hinting to neutrality.
Immediate intra-day resistance could come around the Tenkan-sen at 129.49 – notice that this level was briefly violated today with the price subsequently falling below it. Further up, an additional barrier to the upside might be formed by the July 11 high of 130.76 and 131 handle.
On the downside, the area around the 129 mark, another potential psychological level (similar to 131) which was of significance recently, could offer support. A break below would shift focus to the Kijun-sen at 127.20 for additional support.
Regarding the medium-term picture, it is clearly bullish given the upward sloping 50- and 200- day moving average (MA) lines. In addition, price action has been taking place above both MAs since late April.
EURGBP Maintains Bullish Bias Despite Minor Pull Back
EURGBP maintains a bullish bias despite the minor correction from the July 21 high of 0.8994. The uptrend that took place from the 0.8300 handle from April 18 is still intact.
Strong support was found at 0.8760. It was previously a resistance level which was broken on June 9 and consequently turned to support, which was tested several times until July 17 when the market rallied to 0.8994.
There was a bullish crossover of the 50-day moving average with the 200-day MA on June 28. This gives a technically bullish picture for EURGBP but strong resistance could limit upside moves at the October 2016 high of 0.9261. This may provide a challenge for the market as it is the highest level since 2009.
Meanwhile, RSI is in bullish territory above 50, although it appears to have lost momentum. This could suggest some consolidation in the market in the near term, as long as support at 0.8760 holds. A break below this would target a support zone between 0.8625 to 0.8635, which is defined by the 200-day MA and the June 9 low. A further decline would open the way towards the key 0.8400 area and April 18 low of 0.8312.
In the bigger picture, the current pull back from 0.8994 could be seen as a corrective move of the recent uptrend. There are no clear signs of a reversal in the trend yet and EURGBP maintains a bullish outlook as long as it is located above 0.8760.
Dollar Softens Ahead Of FOMC Meeting, Saudi Arabia Helps Push Oil Prices Up
During the Asian session, forex markets didn't have much to react to in the absence of important economic releases. Hence, yesterday's events along with the upcoming two-day US Federal Open Market Committee meeting that starts today have been commanding most of the moves today.
The US dollar weakened against most currencies as investors await the news from the two-day FOMC meeting on interest rate policy that starts later today. Many investors expect the Federal Reserve to announce that it will begin reducing its balance sheet at its September meeting, though the probability of another interest rate hike this year has fallen below 50%. Fed Fund futures show investors are pricing the highest chance of another rate hike for December and that is well below 40%. This suggest traders are waiting for data to confirm the so far hawkish-perceived view of the Fed before they price in any upside potential for the greenback. At 93.87, the dollar index approached the lowest level since June 2016. Dollar/yen fell to 110.88.
During the first session of the day, the euro recovered yesterday's losses following the soft PMI readings for July. Looking ahead, traders will be focusing on the Ifo Business Climate index for July, hoping to gauge the outlook for the eurozone economy. With the PMI falling short of expectations and investor confidence weakening according to the ZEW Institute, today's German Ifo report may add further pressure to the euro. Economists are expecting a reading of 114.9, a slowdown from 115.1 in June. Euro/dollar was last trading at 1.1665, up 0.20% on the day.
Sterling also firmed up during Asian trading. Pound/dollar is up for the third consecutive day to last trade at 1.3033. The UK has started its post-Brexit trade talks with the US in Washington.
Most Asian currencies gained against the US dollar during the Asian session. The aussie was up 0.20%, recovering most of Friday's losses. Aussie traders will be focusing on two key events this week, June quarterly inflation data and a speech by Reserve Bank of Australia Governor Philip Lowe, both on Wednesday.
Oil extended gains above $46 a barrel following the decision by Saudi Arabia to cut crude exports in August to help ease a global supply glut. WTI was last trading at $46.55 a barrel (up 0.45%) and Brent was at $48.81 a barrel (up 0.43%).
Gold prices inched higher after hitting a one-month high in the last session yesterday. Political uncertainty in the US along with the upcoming FOMC meeting supported the increase in the price of the precious metal. Gold was last trading at $1,256.67 an ounce.
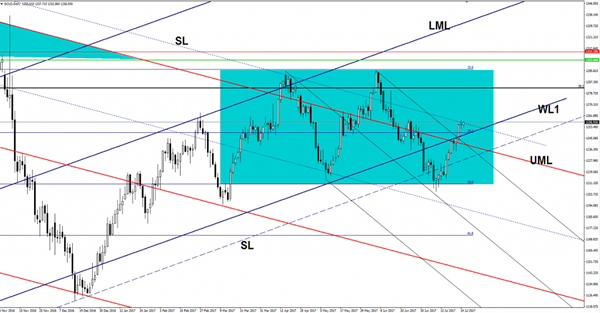
GOLD Facing Tough Resistance
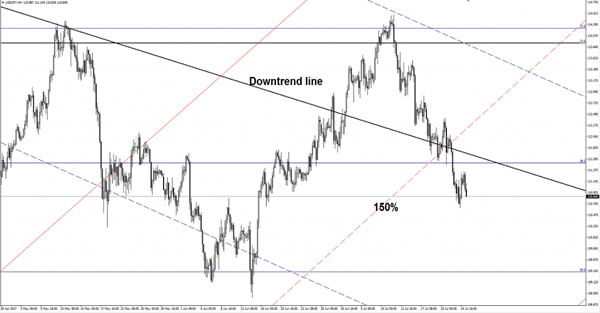
The yellow metal continues to move in range between the 23.6% and the 50% retracement levels, is trading at the half of this sideways movement. Is pressuring the outside sliding parallel line (SL), a valid breakout above this line will confirm a larger increase.
Technically should climb much higher on the Daily chart after the breakout above the upper median line (UML) of the major descending pitchfork and outside the minor descending pitchfork’s body. We may have a buying opportunity if will stabilize above the SL and if will come down to retest the warning line (WL1).
USD/JPY On The Way Down
Price is trading in the red on the short term and is expected to drop much below the 110.00 psychological level if will have enough direction energy to take out the support from 110.61 previous low.
Should extend the sell-off after the failure to reach and retest the 38.2% retracement level and the broken downtrend line. Is moving sideways on the Daily chart, so is somehow expected to approach the 50% retracement level again, where he could find support again. The Yen dominates the currency market on the short term as the Nikkei failed to stay above the 20058 static resistance.