Sample Category Title
BITCOIN Bearish Consolidation
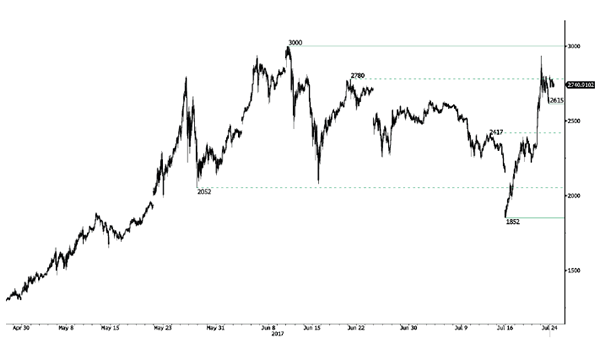
Bitcoin has surged strongly last week. Hourly resistance can be found at 3000 (12/06/2017 high) and hourly support is given at 2615 (21/07/2017 low). Expected to show further retracement.
In the long-term, the digital currency has had an exponential growth. There are decent likelihood that the asset will consolidate above $1500. Long-term support is given at $1464 (04/05/2017 low).
EUR/CHF Pushing Higher
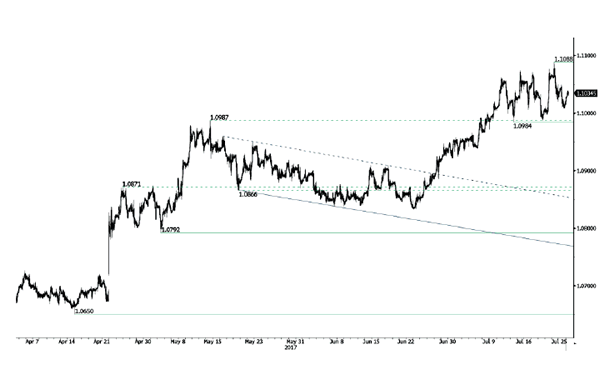
EUR/CHF is still trading above psychological level at 1.1000 and the pair is ready to monitor 1.1100. Selling pressures are growing below 1.1100. Hourly support is located at a distance at 1.0922 (30/06/2017 low). Expected to inch higher.
In the longer term, the technical structure is mixed. Resistance can be found at 1.1200 (04/02/2015 high). Yet,the ECB's QE programme is likely to cause persistent selling pressures on the euro, which should weigh on EUR/CHF. Supports can be found at 1.0184 (28/01/2015 low) and 1.0082 (27/01/2015 low).
EUR/GBP Ready For Another Leg Higher
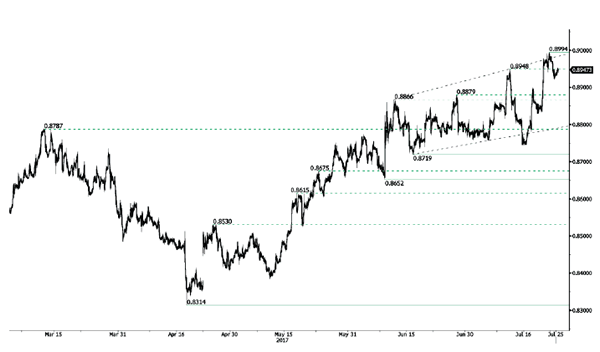
EUR/GBP is very volatile. The pair has surged toward 0.9000. Hourly resistance is given at a distance at 0.8742 (16/07/2017 low). Downside risks are important.
In the long-term, the pair has largely recovered from recent lows in 2015. The technical structure suggests a growing upside momentum. The pair is trading above from its 200 DMA. Strong resistance can be found at 0.9500 psychological level.
DAX Higher As German Ifo Business Climate Hits New Record
The DAX index has posted gains in the Tuesday session. Currently, DAX is trading at 12,275.00, up 0.50% on the day. On the release front, German Ifo Business Climate climbed to 116.0 points, beating the estimate of 114.9 points. German Import Prices posted a fourth straight decline, coming in at -1.1%. This reading was weaker than the estimate of -0.7%. On Wednesday, the Federal Reserve will conclude its 2-day policy meeting and publish a rate statement.
German numbers continue to move upwards. On Tuesday, German Ifo Business Climate impressed in July, as the indicator strengthened for a sixth straight month. The indicator hit another record high of 116.0, surprising the markets which had forecast a small drop from the previous reading. Clements Fuest, president of the Ifo Institute, continues to use superlatives to describe the German economy, calling sentiment in the business sector “euphoric”. Fuest added that optimism in the business sector is at its highest since Germany’s reunification. German data continues to point upwards, and the robust economy has been the locomotive behind a reinvigorated eurozone economy. The marked improvement in economic conditions in the eurozone has sent the euro soaring, as the currency is up 9.8% since March 1. Although, the strong euro has not put a dent in business sentiment, this has not been the case with German stock markets. The high exchange rate has weighed on exporters’ shares and the DAX has declined 2.7% since June 1.
The Federal Reserve is holding its monthly policy meeting on Tuesday and Wednesday, With the odds of a rate hike at just 3%, the markets will be focused on the Fed’s rate statement, which will be released on Wednesday. US numbers in the second quarter have been mixed, and inflation remains well below the Fed target of 2.%. Given these economic conditions, investors remain skeptical as to whether the Fed will raise rates in December, with the odds currently at 47%, according to the CME Group. Analysts will be looking for nuances in the language of the statement, and a dovish tilt from the Fed could hurt the dollar and boost the red-hot euro. Another issue for Fed policymakers is the $4.2 trillion bond portfolio, a result of the aggressive quantitative easing program which was put in place after the financial crisis in 2008. In June, the Fed outlined plans to reduce its bloated balance sheet, with experts circling September as the start date of the reduction.
Euro Steady, Shrugs Off Strong German Business Sentiment Report
The euro has ticked higher in the Tuesday session. Currently, EUR/USD is trading at 1.1650. On the release front, German Ifo Business Climate climbed to 116.0 points, beating the estimate of 114.9 points. In the US, today’s key event is CB Consumer Confidence, which is expected to slip to 116.9 points. On Wednesday, the US releases New Home Sales and the Federal Reserve will publish its rate statement.
German Ifo Business Climate impressed in July, as the indicator strengthened for a sixth straight month. The indicator hit another record high of 116.0, surprising the markets which had forecast a small drop from the previous reading. Clements Fuest, president of the Ifo Institute, continues to use superlatives to describe the German economy, calling sentiment in the business sector “euphoric”. Fuest added that optimism in the business sector is at its highest since Germany’s reunification. German data continues to point upwards, and the robust economy has been the locomotive behind a reinvigorated eurozone economy. The marked improvement in economic conditions in the eurozone has sent the euro soaring, as the currency is up 9.8% since March 1.
The Federal Reserve is holding its monthly policy meeting on Tuesday and Wednesday, With the odds of a rate hike at just 3%, the markets will be focused on the Fed’s rate statement, which will be released on Wednesday. US numbers in the second quarter have been mixed, and inflation remains well below the Fed target of 2.%. Given these economic conditions, investors are unsure if the Fed will raise rates in December, with the odds currently at 47%, according to the CME Group. Analysts will be looking for nuances in the language of the statement, and a dovish tilt from the Fed could hurt the dollar and boost the red-hot euro. Another issue for Fed policymakers is the $4.2 trillion bond portfolio, a result of the aggressive quantitative easing program which was put in place after the financial crisis in 2008. In June, the Fed outlined plans to reduce its bloated balance sheet, with experts circling September as the start date of the reduction.
GBP/USD Elliott Wave Analysis
GBP/USD – 1.3019
GBP/USD – Wave 4 is unfolding as an (A)-(B)-(C) and could have ended at 1.7192
Cable’s retreat after last week’s initial brie rise to 1.3126 suggests a temporary top is possibly formed and consolidation below this level would be seen with downside bias for weakness and below 1.2933 support would bring weakness to 1.2890-00, however, break of indicated previous support at 1.2812 is needed to provide confirmation to this view, bring retracement of recent upmove to 1.2770, then towards 1.2700-10 which is likely to hold from here.
Our preferred count on the daily chart is that cable's rebound from 1.3500 (wave (A) trough) is unfolding as a wave (B) with A ended at 1.7043, followed by triangle wave B and wave C as well as wave (B) has possibly ended at 1.7192, below support at 1.4232 would add credence to this count, then further fall to 1.4000 level would follow but reckon downside would be limited to 1.3655 support and price should stay above previous support at 1.3500.
On the upside, whilst initial recovery to 1.3060 cannot be ruled out, as top has been formed at 1.3126, reckon upside would be limited and bring another decline later. Only break of said resistance at 1.3126 would suggest the erratic rise from 1.1986 low is still in progress for further gain to 1.3140-50 (38.2% Fibonacci retracement of 1.5018-1.1986) and possibly 1.3200 but overbought condition should prevent sharp move beyond 1.3300.
Recommendation: Hold short entered at 1.3040 for 1.2840 with stop below 1.3140.
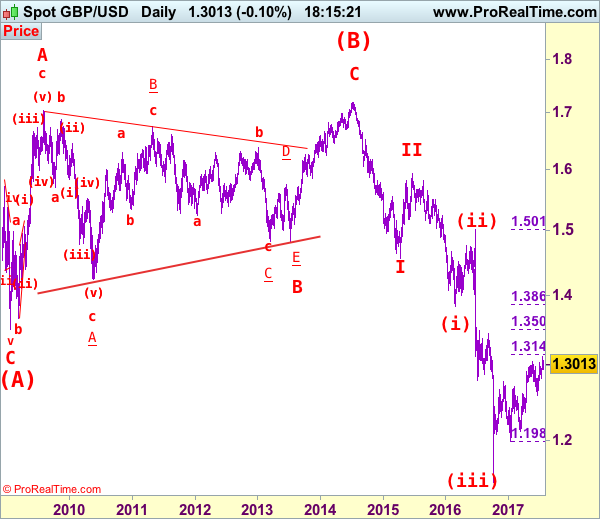
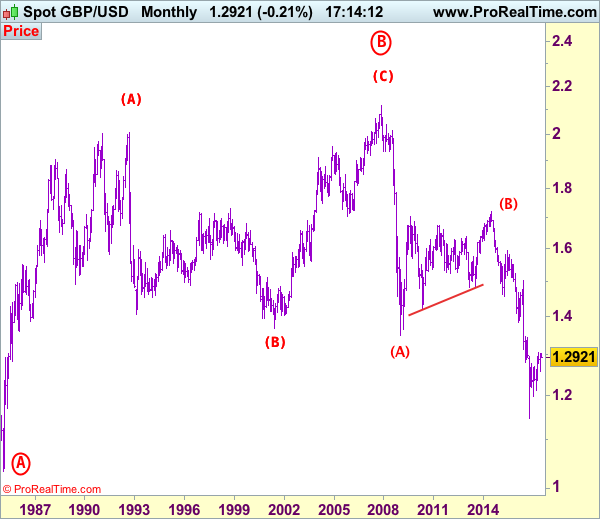
Longer term - Cable's rise from 1.0520 (Feb 1985) to 2.0100 (September 1992) is seen as [A], the decline to 1.3682 is labeled as (B) and (C) wave rally has ended at 2.1162 (9 Nov, 2007) which is also the top of larger degree wave B with circle. The selloff from there is a 5-waver with wave (A) ended at 1.3500 (23 Jan 2009), wave (B) itself is labeled as A: 1.6733, triangle wave B: 1.4813 and wave C as well as top of wave (B) ended at 1.7192 (2014), hence the selloff from there is an impulsive wave (C) with wave I : 1.4566, wave II 1.5930, an extended wave III is unfolding and already exceeded our downside target at 1.3500 and 1.3000, hence weakness to 1.2500 and possibly 1.2000 cannot be ruled out, however, price should stay well above psychological level at 1.0000.
Daily Technical Analysis: USD/JPY Close To 50.0 Fib Retracement And Weekly H3 Pivot Point Confluence
.
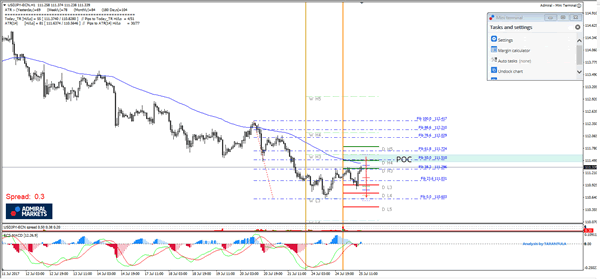
Intraday time frames are still in downtrend on the USD/JPY pair and at this point there is a retracement. The pair is getting close to the POC zone 111.50-65 (D H4, W H3, EMA89, 50.0, ATR high) where it could reject to retest 111.30 and 111.00 again. A successful rejection and subsequent break of 111.00 should target 110.60. The pair should ideally stay close below 111.85 if bears still want to have the upper hand.
GBP/CHF Elliott Wave Analysis
GBP/CHF – 1.2485
GBP/CHF – Circle wave v ended at 0.9106 and major correction has commenced for subsequent gain to 1.5547.
Sterling only recovered to 1.2639 (just missed our recommended short entry at 1.2655) before meeting anticipated selling interest and the subsequent selloff adds credence to our bearish view that the rebound from 1.2241 has ended and downside bias remains for a retest of this level, break there would confirm the decline from 1.3069 top has resumed and may extend weakness to previous chart support at 1.2215, then 1.2150, having said that, loss of momentum should prevent sharp fall below another chart support at 1.2102 (this year’s low) and price should stay above psychological support at 1.2000, bring rebound later.
To recap the larger degree count, the selloff from 2.4965 (July 2007) is the beginning of wave V with circle and is labeled as 1: 2.3760, 2: 2.4425, wave 3 extension ended at 1.1470, followed by wave 4 at 1.5547, the quick rebound from 0.9106 suggests wave 5 as well as entire circle wave V could have ended there, hence consolidation with mild upside bias is seen for major correction to take place, bring initial test of 1.5547 (previous 4th of a lesser degree).
On the upside, whilst current recovery from 1.2270 may bring initial bounce to 1.2400, reckon resistance at 1.2472 would limit upside and bring another decline to aforesaid downside targets. Only a break of previous minor support at 1.2537 (tentatively sub-wave 1 trough) would abort and prolong consolidation, risk a stronger rebound to 1.2590-00 but price should falter below said resistance at 1.2639, bring another decline later.
Recommendation: Sell at 1.2455 for 1.2255 with stop below 1.2555.

On the Monthly chart, the longer-term count is that major downtrend is under way with circle wave I at 2.8645 (Sep 1.978), then wave II with circle at 4.6175 (Feb 1981), the wave III with circle ended at 1.7425 (Nov 1995) and followed by wave IV with circle at 2.4965 (July 2007 with a short wave C) and wave V with circle has possibly ended at 0.9106. A monthly close above 1.5547 would add credence to this view, bring major correction to 1.7000, then towards psychological level at 2.0000.

AUD/USD Consolidating
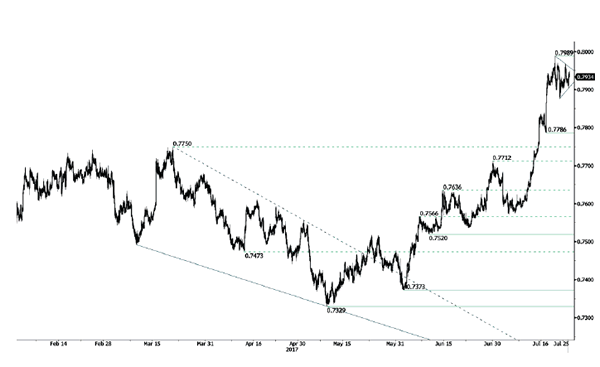
AUD/USD's technical structure is bullish since early May despite some profit-taking. Hourly resistance is given at 0.7989 (19/07/2017 high). Hourly support is given at 0.7875 (21/07/2017 low).
In the long-term, we are waiting for further signs that the current downtrend is ending. Key supports stand at 0.6009 (31/10/2008 low) . A break of the key resistance at 0.8295 (15/01/2015 high) is needed to invalidate our long-term bearish view.
USD/CAD Riding Lower
USD/CAD is going lower and the pair remains in a strong bearish momentum. Hourly resistance is given at 1.2701 (17/07/2017). Expected to show continued bearish pressures.
In the longer term, the pair is now monitoring long-term support that can be found at 1.2461 (16/03/2015 low). Strong resistance is given at 1.4690 (22/01/2016 high). The pair should head lower.