Sample Category Title
EUR/USD Targeting The 1.1700 Level
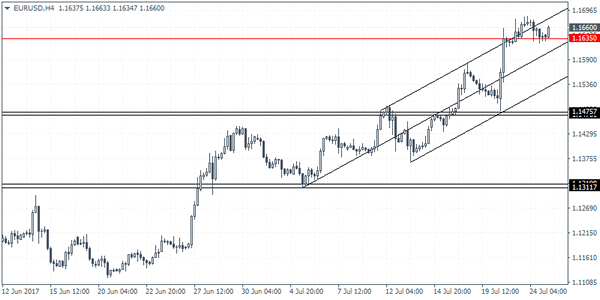
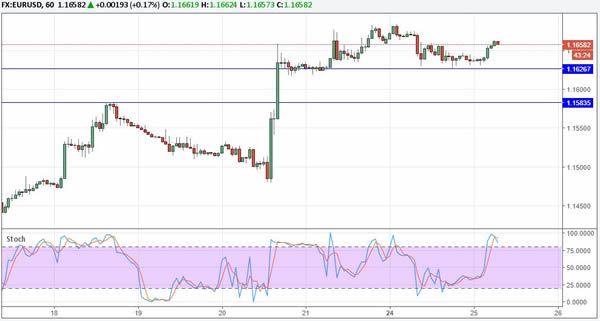
Price increased in the morning and looks motivated to approach and reach new highs in the upcoming days. USD drops further versus all its rivals ahead the US data, another disappointment in the afternoon will send the EUR/USD much above the 1.1683 previous high.
USDX is trading in the red and is very close to hit the 0.9383 yesterday’s low, a further drop is favored because is under massive selling pressure on the Daily chart. The index should drop further because we don’t have any reversal sign at this moment, will increase a little in the afternoon only if the United States data will impress.
The main event will be the release of the CB Consumer Confidence, which could drop from 118.9 to 116.5 points.
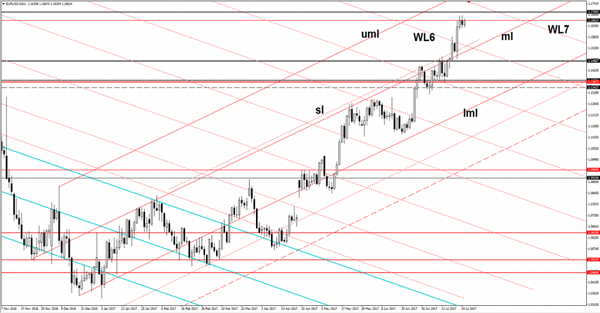
Price increased a little and tries to approach the 1.1700 psychological level, but he needs to take out the minor resistance from 1.1683. Resistance can be found at the seventh warning line (WL7) of the former descending pitchfork, while the major static resistance is at the 1.1712 level. Is strongly bullish after the impressive breakout above the WL6 and could be attracted also by the upper median line (uml) of the ascending pitchfork.
Currencies: Dollar Holding Near Recent Lows
Sunrise Market Commentary
- Rates: Subdued trading ahead of FOMC?
Risks for today's eco data are mainly tilted to the downside of expectations, but the figures will probably pass unnoticed ahead of tomorrow's FOMC meeting. The start of the US refinancing operation could cause marginal underperformance versus the German Bunds. Overall, we expect trading to remain confined to small range and to occur in low volumes. - Currencies: dollar holding near recent lows
The dollar decline slowed yesterdady but the overall picture for the US currency didn't improve. Today's eco data will probably only be of intraday significance. Even so, disappointing US data might still push EUR/USD closer to the key 1.1714/35 resistance as markets look forward to the FOMC policy decision.
The Sunrise Headlines
- Asia Pacific traders largely adopted a wait-and-see approach after a muted start to the week on Wall Street ahead of Wednesday's Fed meeting and awaiting some earnings releases from big-name tech companies.
- The July preliminary US manufacturing PMI was, at 53.2, higher than the expected 52.3 and the previous 52.0., The services PMI stabilised, as expected.
- Sales of US Existing Home sales declined by 1.8% in June after a rise of 1.1% in May (consensus of -0.9%). Tight supply and high prices constrained housing activity despite strong demand.
- President Trump made a plea to the US Senate Republicans to “do the right thing” and vote today to open a debate on an overhaul of Obamacare. It remains unclear whether McConnell will have enough votes to open the debate.
- The Bank of Japan minutes showed policymakers discussed how much information to disclose on a possible exit from QE, but close the discussion as the BoJ is still far of its 2% inflation goal.
- Brent oil extended its gains to around $48.90 a barrel as Saudi Arabia promised deep cuts to crude exports next month to ease the global glut. In addition, some signals are emerging that US shale producers are tapping the brakes on drilling.
- The main items on the eco-calendar today are the US consumer confidence (July) and the Richmond Fed manufacturing index (July) and German July IFO business confidence.
Currencies: Dollar Holding Near Recent Lows
USD holding near recent lows
Dominant FX trends that ruled trading recently halted yesterday. The dollar decline slowed and so did the rise of the euro. The pause in the euro rally was ‘justified' by softer than expected EMU PMI's. There was no high profile news to inspire a directional USD move. EUR/USD stabilized in the mid 1.16 area and closed the session at 1.1642. USD/JPY dropped temporary below 111, but closed the session at 111.10.
Overnight, Asian equities are trading mixed, in line with WS. ECB's Mersch said he saw upward risks to EMU growth and that he's more assured about a return of inflation to the target. At the same time he reiterated that policy accommodation remains needed. EUR/USD rebounded to the 1.1660 area on the Mersch headlines. USD/JPY stabilizes near 111.
Today's eco calendar contains German IFO, US consumer confidence and Richmond Fed manufacturing. The IFO reached a multi-year top in June. A small decline from 115.1 to 114.9 is expected in July. We see downside risks given yesterday's PMI's. US consumer confidence (Conference Board) is expected to have weakened in July (116 from 118.9). Based on the more timely measures of confidence, we expect confidence to have weakened, maybe even more than the consensus forecasts.
Yesterday's unexpected easing of the EMU PMI's provided a good reason to slow the recent ascent of the euro. However, it's far from sure that a softer Ifo will have a similar impact. The euro still enjoys a solid bit and the overall picture for the dollar remains fragile. Soft US consumer confidence even might push the dollar back to the recent lows going into tomorrow's Fed policy decision. Even a test of the key EUR/USD 1.1714/35 resistance might be on the cards. On the US political scene, a new vote on the healthcare bill is a wild card. Any (unexpected) progress on the issue might be slightly supportive for the dollar. Even so, (FX) markets will maintain some kind of wait-and-see modus going into tomorrow's FOMC decision. There is already quite some negative news discounted for the dollar after the recent setback, but we still see no trigger for a positive U-turn on the US dollar. For that to happen, the dollar needs really positive news. Good data might help to build a floor for the dollar, but might only come later this week (US GDP) and/or next week. For now, there is no reason to front-run on a positive reversal for the dollar.
USD: technical picture worsens further
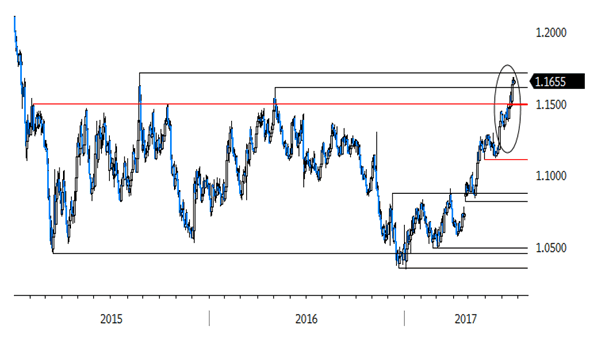
EUR/USD rebounded above the 1.1300/66 resistance at the end of June. Recent data were not good enough to trigger a sustained USD rebound. Finally EUR/USD broke beyond the 1.1489/1.15 resistance, paving the way to the LT-correction tops at 1.1616/1.1714. A sustained break would end the long consolidation that followed the sharp decline of EUR/USD in 2014/early 2015. Such a key area is not easy to break. We don't preposition for a break, but the pressure is mounting. Return action below 1.13 would be a first indication of a loss in upside momentum.
USD/JPY rebounded in the 108.13/114.37 range after the June 14 Fed meeting. The pair regained interim resistance at 112.13, but follow-through gains remained modest. USD/JPY 114.37 resistance was tested, but rejected. The pair is currently drifting lower in the broader consolidation pattern between 114.50 and 108.83/13. A test of the downside becomes more likely. A break below would probably be sign of a further deterioration on the global USD sentiment
EUR/USD: top MT consolidation pattern under heavy strain
EUR/GBP
EUR/GBP rally eases, but holding north of 0.89
Yesterday, sterling staged a technical rebound against the dollar and the euro, after Brexit bickering weighed on the UK currency last week. The eco news was intrinsically negative for sterling, but ignored. EUR/GBP closed the session at 0.8935. Cable returned north of 1.30.
Today, the CBI Trades orders will be published. A modest decline from 16 to 12 is expected. The series is timely in nature, but has limited market moving potential. A speech of UK Chief economist Haldane is a wildcard. End June, he indicated that the BoE should seriously look at the possibility of raising interest rates. Will he reiterate this view after recent softer than expected UK eco data? If he would turn more cautious on a rate hike, markets might consider that the BoE is returning to wait-and-see modus, a sterling nagative.
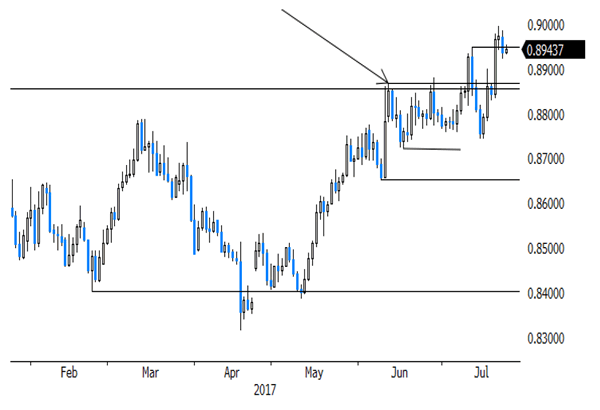
From a technical point of view, EUR/GBP broke above the 0.8854/66 resistance (2017 top) to set a new correction top north of 0.89, but the rally slowed at the end of last week A break below 0.8720 would suggest that upside momentum is easing. For now, we don't see a trigger for a sustained rebound of sterling against the euro. We still look to buy EUR/GBP on more pronounced dips. For that to happen, EUR/GBP probably needs some help from a correction in EUR/USD.
EUR/GBP: consolidation near recent top
Dollar Attempts To Post A Rebound
The markets were seen trading subdued yesterday with thelack of any tier-one data. Economic data, for the most part, was to do with flash manufacturing and services PMI numbers out of the Eurozone and the US.
In the Eurozone, the flash PMI's were broadly weaker than expected, while in the US flash manufacturing showed signs of another increase, while services PMI was as expected. The US existing home sales data was also slightly below expectations, rising just 5.53 million compared to expectations of 5.59 million.
Looking ahead, it is likely to be another slow day. The German import prices data will be coming out followed by the US Richmond Fed manufacturing index data. The conference board's consumer confidence data is expected to slip to 116.2, compared to 118.9 previously.
EURUSD intraday analysis
EURUSD (1.1660): The EURUSD slipped to test the support at 1.1635 yesterday and price action has been since rising higher following the bounce off the support. We could expect to see some consolidation above 1.1635 in the near term, and further gains can come only on a breakout above the previous high. Failure to break past the previous highs near 1.1685 could signal a near term retracement. Below 1.1635, EURUSD could be seen testing the next lower support at 1.1475.
GBPUSD intraday analysis
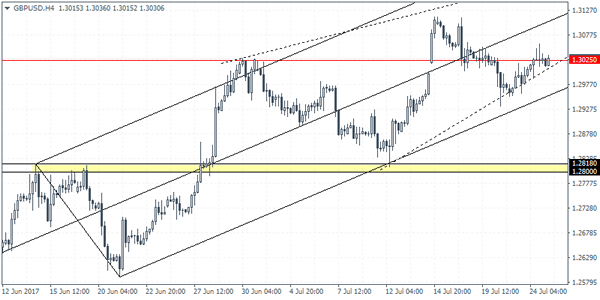
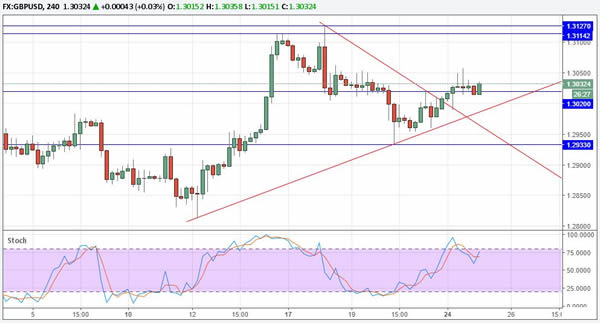
GBPUSD (1.3030): The British pound posted a modest rally which saw price action testing the resistance level at 1.3025. As long as this resistance level holds, GBPUSD could be seen pushing lower in the near term. With the broader price action seen consolidating within the rising wedge pattern, the bias is to the downside, unless we get to see a convincing close above 1.3025. On the 4-hour chart, price action has been rather volatile with GBPUSD seen briefly breaking above 1.3025 but only to close back below this level. Support is seen at 1.2818 which could be tested in the near term if there is a reversal at 1.3025.
USDJPY intraday analysis
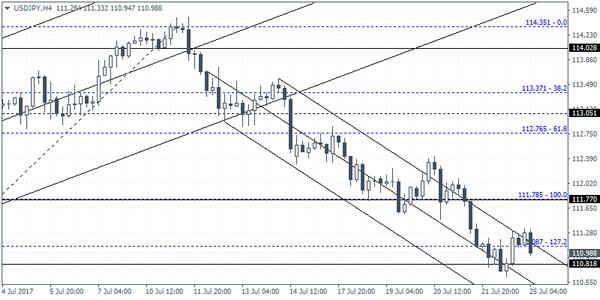
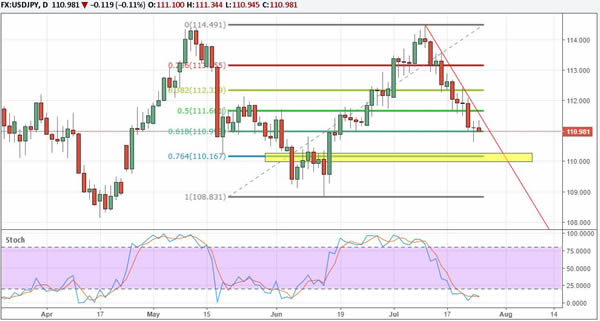
USDJPY (110.98): The USDJPY closed with a doji candlestick pattern yesterday. This comes near the identified support level at 101.80. A higher close is required to establish the upside bias in USDJPY, or we could expect to see further declines in the near term. On the 4-hour chart following yesterday's brief drop below 110.81, the current higher low that is forming could signal a reversal of the trend. Still, USDJPY needs to break above 111.08 in order to signal a move to the upside. Short-term resistance is seen at 111.78 followed by a move towards 113.05.
Eurozone Growth Continues
Markets were focused on Washington D.C., where Jared Kushner answered questions before a Senate Committee on his dealings with Russian contacts during his father-in-law’s Presidential Campaign. Kushner confirmed having 4 meetings with Russians during the presidential campaign and the transition, but described the encounters as 'unmemorable'. Donald Trump Jr. and former Trump campaign Chairman Paul Manafort will testify before a Senate Committee on Wednesday. Data released on Monday indicated that the Eurozone is experiencing a mild slowdown but the Eurozone economy was still growing at a relatively good pace. A good guide to economic growth was Monday’s Markit’s Euro Zone Flash Composite Purchasing Managers’ Index (Jul). Although the latest release fell to 55.8 from June’s 56.3 it is still well above the 50 level that separates growth from contraction. The release underlines strong job creation, business optimism and a strong pace of commercial activity for the Eurozone economy.
EURUSD continued its strong run climbing to a new 23 month high of 1.16836 on Monday. EUR is the best performing G10 currency in 2017 being up 10% to date. Currently, EURUSD is trading around 1.1655.
GBPUSD rose 0.3% on Monday to reach a high of 1.30568 – a level not seen for over a week. Currently, GBPUSD is trading around 1.3030.
USD showed a gain against JPY of 0.5% on the day, after climbing off an early low of 110.616 and USDJPY is currently trading around 111.10.
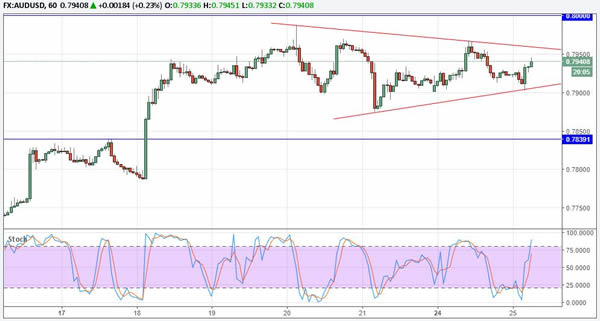
AUDUSD rose 0.4%, trading up to 0.79668 on Monday, before giving back all its early gains as the markets await a speech by Reserve Bank of Australia Governor Philip Lowe on Wednesday. AUDUSD is currently trading around 0.7935.
Gold hit its highest level in more than a month on Monday to trade at $1,258.69. Currently, Gold is trading around $1,256.
Oil rose 1.8% on the day to $46.49pb as Saudi Arabia commented that 'it would make deep cuts to its crude exports in August and encourage better compliance with supply reductions from other producers'. WTI continued edging higher overnight and is currently trading around $46.68pb.
At 11:00 BST the CESifo Group will release German IFO data. IFO Expectations (Jul) are forecast to be slightly lower at 106.5 from the previous reading of 106.8. As an indicator of current conditions and business expectations of 7,000 Business Leaders, the release may provide the markets with a better indication as to the state of the German economy and, in turn, the wider Eurozone economy. A higher number will indicate a more positive view of conditions and is therefore likely to be bullish for EUR, with the converse being true for a lower release.
Fed Policy makers begin their meeting today with a decision due on Wednesday.
At 17:00, Bank of England Chief Economist Andy Haldane will be speaking in London at the Finance Foundation Annual Lecture.
OPEC Meeting
The Oil markets are attempting to extend their gains during early trading on Tuesday after OPEC and Non-OPEC members displayed optimism over the current production cut deal and seemed confident that the path they were treading would eventually rebalance the markets. Gains were also supported by Saudi Arabia pledging to make deeper cuts to its crude exports in August, and Nigeria agreeing to cap production output at 1.8 million barrels a day.
While OPEC's optimism and public pledge of commitment towards tackling the ongoing oversupply of Oil in the market may continue to support its valuation in the short term, investors should keep in mind that no deeper cuts were made at this point in time. While this was not expected to be the outcome to the meeting in Saint Petersburg, the unexpected outcome would have likely encouraged the material bounce higher in price that Oil producers are looking to eventually achieve.
The OPEC meeting in St. Petersburg was simply a renewal of commitment by OPEC and non-OPEC members to respect their current production cut deal.
All in all, oversupply will continue to dominate price action in the Oil markets for the foreseeable future and the markets will likely remain anxious over higher production volumes from other producers. The recent threat that an OPEC member such as Ecuador could have been considering leaving the production cut deal does also indicate the element of stress that the production cut agreement is putting on those taking part
Trade Idea: EUR/JPY – Stand aside
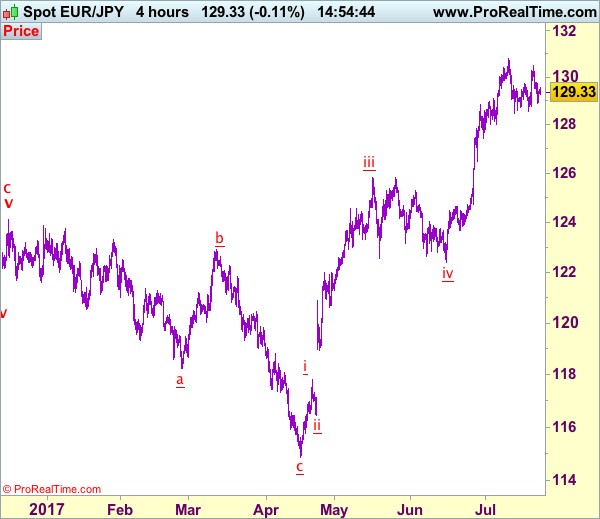
EUR/JPY - 129.36
Recent wave: wave v of (C) ended at 94.12 and major correction in wave A has ended at 149.79
Trend: Near term up
New strategy :
Stand aside
Position: -
Target: -
Stop:-
Euro’s retreat after meeting resistance at 130.51 late last week has retained our view that further consolidation below recent high of 130.77 would be seen and near term downside risk is for a test of 128.57 support, however, break of support at 128.49 is needed to retain bearishness and bring retracement of recent upmove to 128.00, then towards previous support at 127.44.
On the upside, whilst recovery to 129.60-70 cannot be ruled out, reckon 130.00 would limit upside and resistance at 130.51 should hold, bring another decline later. Only a break of 130.51 would signal the retreat from 130.77 has ended, bring retest of this level, break there would confirm recent upmove has resumed for headway to 131.00-10, then towards 131.50, however, loss of upward momentum should prevent sharp move beyond latter level and reckon 132.00 would hold from here, risk from there is seen for a retreat later.
Our latest preferred count is that wave (ii) is ABC-X-ABC which ended at 123.33 and wave (iii) is unfolding with wave iii ended at 100.77, followed by wave iv at 111.57 and wave v as well as the wave (iii) has ended at 97.04, followed by wave (iv) at 111.43 and wave (v) has ended at 94.12 which is also the end of the larger degree v, this also implied the major wave (C) has also ended there, hence major correction has commenced from there with (A) leg unfolding in its lower degree wave c which has possibly ended at 145.69. Under this count, A-B-C wave (B) has commenced with A leg ended at 136.23, wave B at 143.79 and wave C has possibly ended at 149.79.
Our larger degree count is that the decline from 139.26 is wave (C) and is sub-divided into a diagonal triangle i-ii-iii-iv-v with wave i - 105.44, wave ii- 123.33, wave iii - 97.03, wave iv - 111.43, followed by the final wave v as well as the end of wave (C) at 94.12, this also mark the bottom of larger degree wave B. Under this count, major rise in wave C has commenced as an impulsive wave with minor wave III ended at 145.69, wave V is still in progress for further gain to 150.00. Having said that, this so-called wave V could well be the first leg of larger degree 5-waver wave C and this wave C should bring at least a retest of wave A top at 169.97 (July 2008).
Trade Idea: AUD/USD – Buy at 0.7840
AUD/USD – 0.7940
Recent wave: Wave 5 ended at 1.1081 and major correction has commenced for fall to 0.7000 and then towards 0.6500-10
Trend: Near term up
Original strategy :
Buy at 0.7840, Target: 0.7990, Stop: 0.7780
Position: -
Target: -
Stop: -
New strategy :
Buy at 0.7840, Target: 0.7990, Stop: 0.7780
Position: -
Target: -
Stop:-
Although aussie has rebounded again after finding support at 0.7902 today, break of recent high at 0.7990 is needed to confirm recent upmove has resumed and extend gain to 0.8040-50 but loss of upward momentum should prevent sharp move beyond 0.8080 and reckon 0.8100 would hold from here, risk from there is seen for a retreat later. We are keeping our latest bullish count that recent impulsive waves is unfolding as (1 2, (i)(ii), i ii) and may extend headway to aforesaid upside target.
In view of this, would not chase this rise here and we are looking to buy aussie on subsequent pullback as 0.7800 should limit downside, bring another upmove later. Below support at 0.7786 would defer and suggest wave iii top is formed, bring correction in wave iv to 0.7750 but wave i top at 0.7712 should remain intact.
On the 4-hour chart, the move from 0.8066 is the wave 5 with i: 0.8860, ii: 0.8315, wave iii is an extended move ended at 1.0183, iv: 0.9706 and wave v has ended at 1.1081 (also the top of entire wave 5). The subsequent selloff is the major correction which is unfolding as ABC-X-ABC and 2nd A leg has ended at 0.8848, followed by a-b-c wave B which ended at 0.9758, hence, 2nd C wave is now in progress and indicated downside target at 0.7000 and 0.6950 had been met, so further fall to 0.6710-20 cannot be ruled out.

Market Update – Asian Session: Markets Lack Direction Ahead Of FOMC
Asia Summary
Markets lacked direction, opening mixed and spending the session little changed. Data in the session was light and Bank of Japan (BOJ) minutes from June failed to inspire. Japan earnings start to pick up this week and will start with Mitsubishi Motors today. NZD/USD fell to a fresh session low of 0.7401 after New Zealand press reported that contagious disease was found in 14 cows, not long after returned to unchanged levels at 0.7434.
China Central Committee Political Bureau (politburo) indicated that China will continue seeking progress while maintaining stability for its economic work in H2 2017. They will also focus on stabilizing the real estate market, curbing local government debt growth and implementing supply side reform.
Key economic data
(KR) South Korea July Consumer Confidence: 111.2 v 111.1 prior (6th consecutive rise, 6.5-yr high)
(AU) Australia ANZ Roy Morgan Weekly Consumer Confidence Index: 115.1 v 112.5 prior
Speakers and Press
China
(CN) Liquidity condition in the money market has passed tightest period and may ease further in early August - China Securities Journal Op Ed
(CN) China President Xi: Economy in H1 maintained steady growth with a positive outlook, deepened structural adjustment, and better than expected performance in major indicators
(CN) China Think Tank sees H2 exports +6.6% in USD terms - Chinese Press
Korea
(KR) South Korea President Moon: Said to have discussed increasing the weight of South Korean ballistic missile’s warhead to 1 ton from 500kg when he met with US President Trump last month - Korean press
(KR) South Korea Finance Ministry raises GDP outlook: 2017 and 2018 GDP to 3% (prior 2.6%) on exports and extra budget; Sees 2017 exports +10.2% y/y
(KR) South Korea Fin Min Kim: Facing structural crisis of inequality and low growth; will spend 70% of extra budget in Q3
Japan
(JP) Bank of Japan (BOJ) June 15th and 16th Monetary Policy Meeting Minutes: Japan's economy had been turning toward a moderate expansion; Financial conditions were highly accommodative
Other
Macronix, 2337.TW Reports Q2 (NT$) Net 622M v loss 835M y/y; Op 585M v loss 846M y/y; Rev 6.56B, +27% y/y
Asian Equity Indices/Futures (00:00ET)
Nikkei -0.0%, Hang Seng -0.00%, Shanghai Composite -0.1%, ASX200 +0.91%, Kospi -0.08%
Equity Futures: S&P500 -0.02%; Nasdaq -0.07%, Dax +0.02%, FTSE100 +0.02%
FX ranges/Commodities/Fixed Income (00:00ET)
EUR 1.1664-1.1631; JPY 111.34-110.99; AUD 0.7944-0.7903; NZD 0.7445-0.7401
Aug Gold +0.15% at 1,256/oz; Aug Crude Oil +0.58% at $46.61/brl; Sept Copper +0.87% at $2.77/lb
GLD SPDR Gold Trust ETF daily holdings fall 4.14 tonnes to 809.6 tonnes
USD/CNY *(CN) PBOC SETS YUAN REFERENCE RATE AT V 6.7485 V 6.7410 PRIOR
(CN) China PBOC OMO injects CNY140B in 7 and 14 day reverse repos v CNY350B prior
(JP) Japan MoF sells ¥500B in 0.9% 40-year JGB bonds, bid to cover: 3.20x v 2.87x prior (highest bid-to-cover since Jan 2015)
Equities notable movers
Australia
Grange Resources, GRR.AU Reports Q4 pellet production 184Kt v 486Kt q/q; Pellets sold 318kt v 473Kt q/q; +5.8%
Yowie, YOW.AU Reports Q4 Rev +23% y/y; YNA Net Sales $3.48M, flat y/y; -13.3%
Hong Kong/China
Sunac China, 1918.HK To place 220M shares at HK$18.33/shr for HK$4.03B (~5.6% of shares outstanding and at an 8.8% discount to Monday close); -8.4%
China Merchants Bank, 3968.HK Reports H1 prelim (CNY) Net 39.3B v 35.2B y/y, Op 49.6B v 45.0B y/y, Rev 112.7B v 112.9B y/y; +11.4%
Japan
Show Denko, 4004.JP Revises FY17/18 guidance: cuts Net ¥21B from ¥25B; Op ¥60B from ¥54.5B; Rev to ¥762B from ¥745B; -5.4%
South Korea
Hynix,000660.KR Reports Q2 (KRW) Net 2.47T v 2.32Te; Op 3.05T v 2.93Te; Rev 6.69T v 6.82Te; -1.8%
Other
Logitech, LOGI Reports Q1 $0.24 v $0.22e, Rev $529.9M v $521Me; -0.2% afterhours
US markets on close: Dow -0.3%, S&P500 -0.1%, Nasdaq +0.4%, Russell +0.2%
Best Sector in S&P500: Financials
Worst Sector in S&P500: Telecom
Biggest gainers: WYNN 3.3%; NRG 3.2%; INCY +3.0%
Biggest losers: HAS -9.4%; FL -4.6%; HAL -4.2%
At 17:00ET/21:00GMT: VIX 9.43 (+0.07pts); Treasuries: 2-yr 1.37% +1.6%), 10-yr 2.26% (+1.1%), 30-yr 2.84% (+1.2%)
Source
Central Banks Back In Focus On Tuesday
- Divisions within the BoJ?
- Fed meeting gets underway;
- Will BoE’s Haldane maintain hawkish view?
A relatively subdued session in Asia overnight is providing little direction ahead of the European open on Tuesday, with indices currently seen opening a little higher.
The summer period can often be a very quiet one for the markets but with the major central banks across the globe waking up from years of extreme accommodation, this has certainly not been the case so far. One of the few that has until now shown no signs of shifting has been the Bank of Japan but the minutes overnight may suggest that some divisions are appearing among policy makers.
The minutes from last week’s meeting showed some disagreement within the committee regarding the disclosure of an exit strategy from its bond buying program. While the yen was relatively unresponsive to these divisions, the fact that some are already considering its exit strategy publicly at a time when there are concerns regarding liquidity of Japanese bonds should be monitored in the months ahead. The BoJ wouldn’t be the first central bank recently to consider tightening well ahead of market expectations and these divisions could represent early signs of such a shift.
Still, traders don’t currently view these divisions as a sign that bond buying could be scaled back. The BoJ only last week pushed back the date for when the 2% inflation target would be hit to 2019 which makes any tapering in the near-term unlikely.
The Federal Reserve will begin its two day meeting later on today, with the announcement and statement following it tomorrow evening. While no change in policy is expected and no press conference is taking place, with the central bank believed to be preparing measures to reduce the balance sheet from September, there may be hints at such a move in the statement.
As for today, we have a couple of economic releases lined up with German Ifo business climate due this morning and CB consumer confidence this afternoon. We’ll also hear from Bank of England policy maker Andy Haldane this evening, which should be interesting given his recent comments on interest rates and the dip in the inflation data. Earnings season also continues and could well be the key focus for many investors.
Daily Technical Outlook And Review: EUR/USD, GBP/USD, USD/JPY, AUD/USD, NZD/USD, USD/CAD, XAU/USD, WTI
EUR/USD
The Euro found decent support at 1.1625 and recovered from there. However, resistance at 1.17 is tough, and the pair will not clear this obstacle that easily.
Should EUR/USD gather enough momentum and break above 1.17 though, the rally is likely to extend to 1.20 in the near-term. To the downside, initial support is seen at 1.1625, followed by stronger support at 1.1585.
GBP/USD
Cable broke out of the triangle pattern and above 1.3020 resistance. This suggests that we could see another test of the major resistance area between 1.3115-30.
However, Cable is unlikely to gather enough strength to break above it. Further consolidation seems likely, and trading the 1.29-1.31 range the preferred strategy for now.
USD/JPY
The outlook for USD/JPY is looking increasingly bearish. A test of 110 should follow soon. A clear break would likely trigger further momentum selling and pave the way for a retracement to 108.
To the topside, heavy resistance is seen at 111.80-112.
AUD/USD
Volatility has been subdued in the past few trading days, but the Aussie Dollar remains well bid. AUD/USD is currently consolidating within a triangle pattern and resistance is seen at 0.7950 and ahead of 0.80. It is unlikely that we will see a major breakout ahead of Wednesday's inflation data, but the pair could test 0.80 soon.
Above that level, there is little resistance until 0.82. To the downside, look for support at the rising trendline from Friday's low and the former key resistance level at 0.7840.
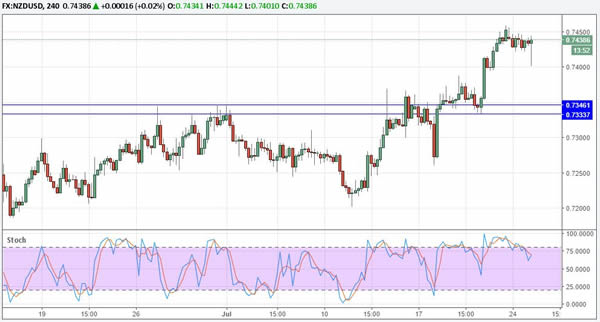
NZD/USD
The New Zealand Dollar is heavily overbought in the short-term, and a retracement seems likely before the uptrend continues.
Initial support is seen at 0.74, but NZD/USD is likely to test 0.7335/45 support soon.
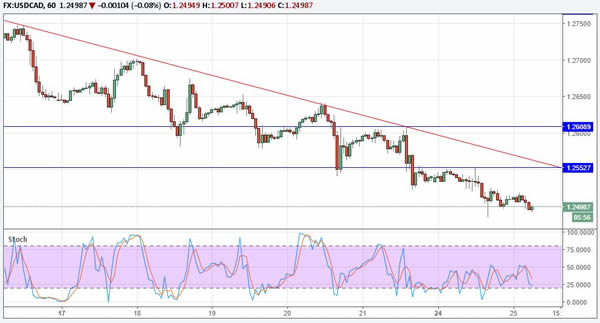
USD/CAD
The downtrend remains clearly intact and further losses seem likely. However, USD/CAD is approaching a major support level at 1.2460 and should see a bounce from there.
Selling interest will remain high though. Resistance at 1.2550/55 and again at 1.2600/10 will not be easy to overcome.
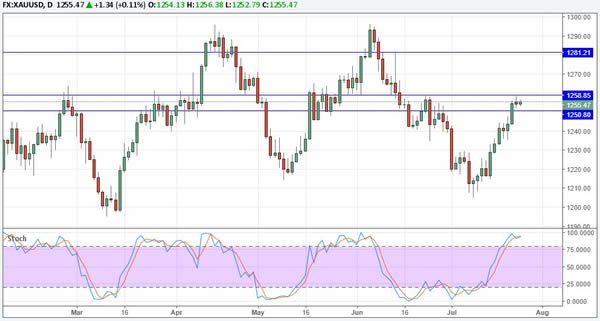
XAU/USD
The short-term outlook for XAU/USD is bullish following the clear break above $1250 resistance. Gold is currently struggling a bit with resistance at $1259, but it should be able to extend gains to at least $1280 in the near-term.
Buying dips is the preferred strategy, and decent demand should be seen near the former resistance level at $1250.
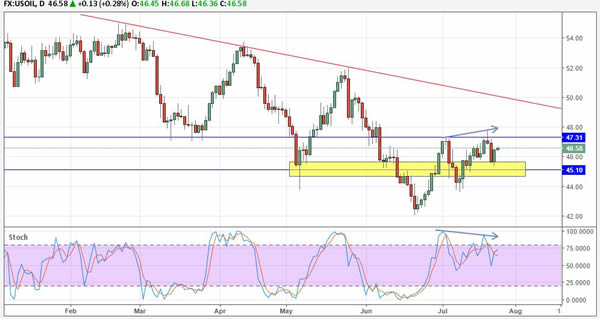
WTI
Price has bounced ahead of $45 support, and this signals that WTI could have another test of the $47.30-50 resistance area. Above that, WTI would face solid resistance in form of the falling trendline from the February high, followed by the $50 level.
Overall, the short-term outlook is positive, but WTI faces strong resistance ahead of $50.