Sample Category Title
EUR/GBP Weakening Within Bullish Trend, EUR/CHF Consolidating Above 1.10, BITCOIN Facing Strong Downside Risk.
EUR/GBP Weakening within bullish trend.
EUR/GBP has failed to test for the third time resistance area around 0.8900. Hourly support is given at 0.8719 (16/06/2017 low). Expected to show further buying pressures.
In the long-term, the pair has largely recovered from recent lows in 2015. The technical structure suggests a growing upside momentum. The pair is trading above from its 200 DMA. Strong resistance can be found at 0.9500 psychological level.
EUR/CHF Consolidating above 1.10.
EUR/CHF is still trading above psychological level at 1.1000. Selling pressures will definitely be important at this point. Hourly support is located at a distance at 1.0922 (30/06/2017 low). Expected to inch higher.
In the longer term, the technical structure is mixed. Resistance can be found at 1.1200 (04/02/2015 high). Yet,the ECB's QE programme is likely to cause persistent selling pressures on the euro, which should weigh on EUR/CHF. Supports can be found at 1.0184 (28/01/2015 low) and 1.0082 (27/01/2015 low).
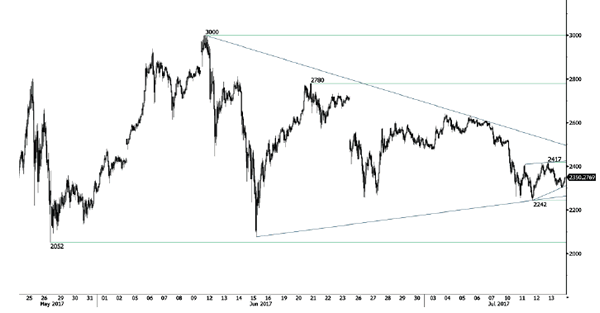
BITCOIN Facing strong downside risk.
Bitcoin is located in a medium-term bearish trend while very short-term momentum is slightly bullish. Hourly resistance can be found at 2417 (13/07/2017 high) and hourly support is given at 2242 (12/07/2017 low).
In the long-term, the digital currency has had an exponential growth. There are decent likelihood that the asset will consolidate above $1500. Long-term support is given at $1464 (04/05/2017 low).
USD/CHF Sideways Price Action, USD/CAD Consolidating, AUD/USD Bullish Breakout.
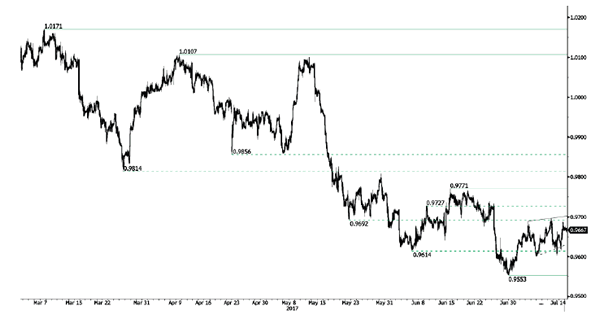
USD/CHF Sideways price action.
USD/CHF is trading higher within a slight short-term bullish trend. Hourly resistance can be found at 0.9696 (09/06/2017 high). Strong resistance is given at 1.0107 (10/04/2017 high). Hourly support is given at 0.9553 (30/06/2017 low).
In the long-term, the pair is still trading in range since 2011 despite some turmoil when the SNB unpegged the CHF. Key support can be found 0.8986 (30/01/2015 low). The technical structure favours nonetheless a long term bullish bias since the unpeg in January 2015.
USD/CAD Consolidating.
USD/CAD is consolidating but the pair remains in a strong bearish momentum. Hourly support is given at 1.2681 (12/07/2017 low). Resistance is located at 1.3014 (02/15/2017). Expected to show continued bearish pressures.
In the longer term, the pair lies in a bullish channel since a year. Strong resistance is given at 1.4690 (22/01/2016 high). Long-term support can be found at 1.2461 (16/03/2015 low).
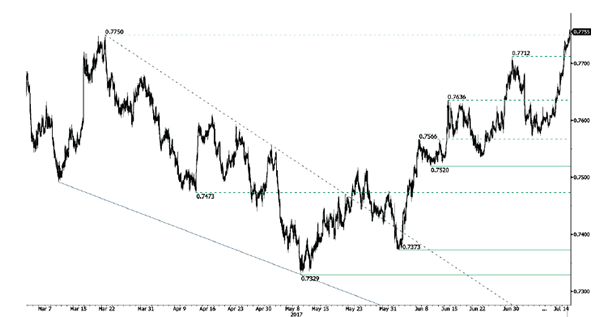
AUD/USD Bullish breakout.
AUD/USD's technical structure is bullish since early May despite some consolidation move. An unlikely break of support at 0.7520 (09/06/2017 low) would nonetheless indicate a renewed bearish trend.
In the long-term, we are waiting for further signs that the current downtrend is ending. Key supports stand at 0.6009 (31/10/2008 low) . A break of the key resistance at 0.8295 (15/01/2015 high) is needed to invalidate our long-term bearish view.
EUR/USD Entering Into A Consolidating Phase, GBP/USD Continued Increase, USD/JPY Consolidating.
EUR/USD Entering into a consolidating phase.
EUR/USD bearish pressures are weak and the pair is still lying in a bullish momentum. Hourly resistance is given at broken resistance at 1.1489 (12/07/2017 high). Hourly support can be found at 1.1292 (28/06/2017 low). Stronger support lies at 1.1076 (18/05/2017 low). Expected to show sideways price action.
In the longer term, the momentum is clearly negative. We favour a continued bearish bias towards parity. Key resistance holds at 1.1714 (24/08/2015 high) while strong support lies at 1.0341 (03/01/2017 low).

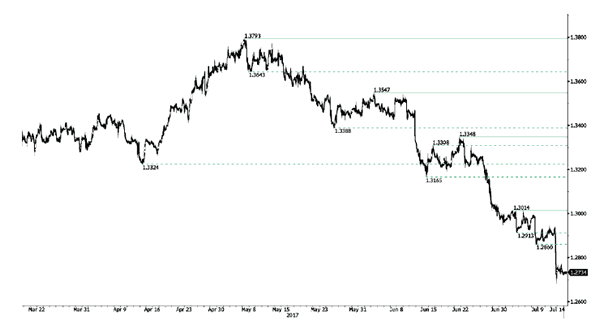
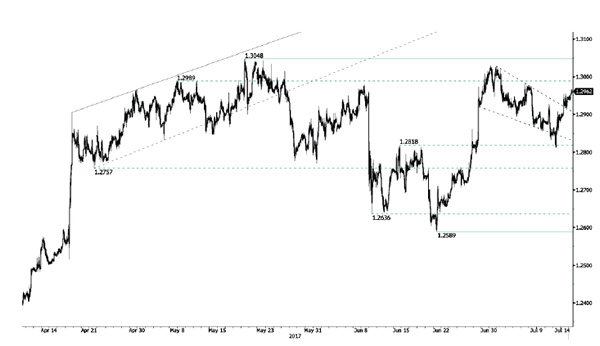
GBP/USD Continued increase.
GBP/USD is pushing higher towards 1.3000. Strong resistance can be found at 1.3048 (18/05/2017 high). Expected to show continued bullish pressures.
The long-term technical pattern is even more negative since the Brexit vote has paved the way for further decline. Long-term support given at 1.0520 (01/03/85) represents a decent target. Long-term resistance is given at 1.5018 (24/06/2015) and would indicate a long-term reversal in the negative trend. Yet, it is very unlikely at the moment.
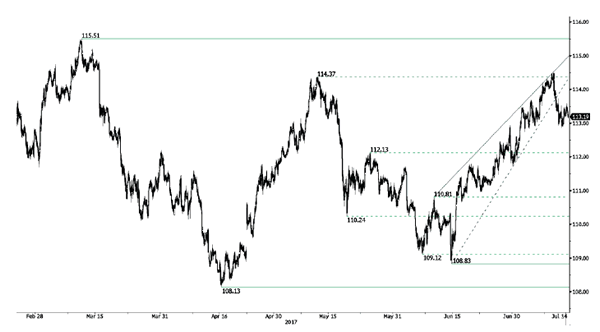
USD/JPY Consolidating.
USD/JPY is consolidating after exiting symmetrical triangle. Hourly support can be found at 112.83 (13/07/2017 low). Stronger support is located at a distance at 108.13 (17/04/2017 low). Expected to show increasing bearish pressures.
We favor a long-term bearish bias. Support is now given at 96.57 (10/08/2013 low). A gradual rise towards the major resistance at 135.15 (01/02/2002 high) seems absolutely unlikely. Expected to decline further support at 93.79 (13/06/2013 low).
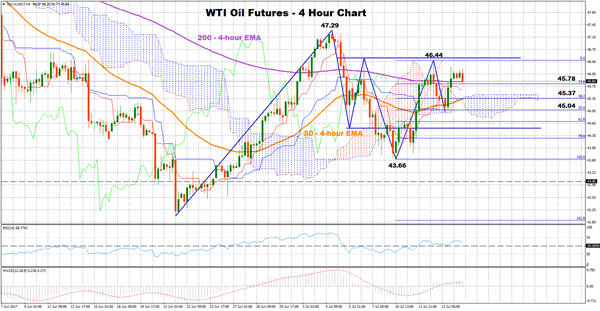
WTI Oil Futures Consolidate Above $45, Bullish Bias Returns
WTI oil futures have broken the downtrend they started building on July 4, as they recently could not post a lower low below 43.66, flashing a potential trend reversal to the upside. Oil is currently consolidating above the key level of 45 per barrel and several indicators are giving an additional bullish signal.
In the near-term, technical indicators argue for an upside bias, as both the RSI and the MACD fluctuate in a bullish area. However, the RSI, as well as the MACD, have slowed down their speed, meaning that a potential uptrend could be weak. A bullish evidence is also given by the price crossing above the Ichimoku cloud, the 50-4-hour and slightly up the 200-4-hour exponential moving average (EMA).
Should the price head down, an immediate support could be provided by the 23.6% Fibonacci retracement level of 45.78 (upleg from 43.66 to 46.44). A second support is likely to be found around the 38.2% Fibonacci of 45.37, where the 50-4-hour EMA and a cross between the Senkoun– span A and Senkoun – Span B are also located. A steeper decline would target the 50% Fibonacci mark of 45.04.
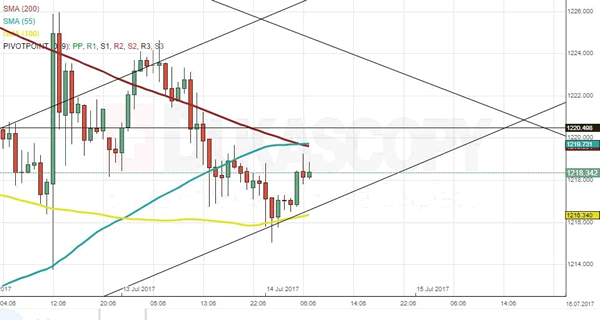
XAU/USD Analysis: Trades Below 1,220 Mark
The metal continues to trade in the borders of the previously established channel up pattern. As it can be observed on the hourly chart, the commodity price recently found support in the combination of the lower trend line of the mentioned channel and the 100-hour SMA at the 1,216 mark. Since then both the support levels have moved upwards in tandem, and they might force the commodity price even higher. However, the metal will face the combined resistance of the 55 and 200-hour SMAs below the 1,220 mark and the monthly S1 at the 1,220.50 level. Although, in the recent history the SMAs have not shown enough force to change the direction of the metal.
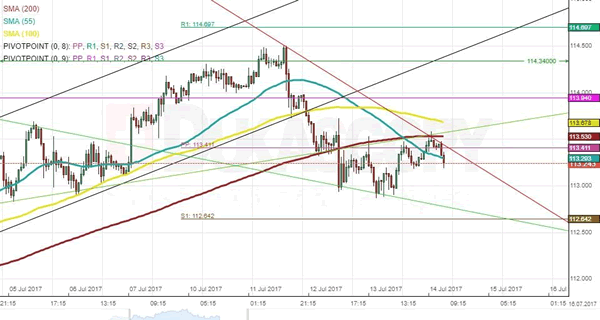
USD/JPY Analysis: Trades In Wedge
During Thursday's trading session, the US Dollar was trading between the weekly PP and S1. The American currency succeeded at surpassing the former early in the morning, but was reserved back in the range after encountering the 200-hour SMA near the 113.50 mark. There is still some downside potential that may be realised in in the upcoming hours. The Dollar has formed a minor descending wedge against the Yen that could be breached soon. A breakout to the upside is the most likely scenario that may occur in this session in case the pair fails to move below the 113.00 mark. Nevertheless, an upside surge may be hindered or even stopped at the 200– or 100-hour SMAs, while gains should be capped at the monthly R1 circa 114.00.
GBP/USD Analysis: Bound Between Weekly PP And R1
Following a massive leap upwards on Thursday morning, GBP/USD returned to test the weekly PP at 1.2926. Despite various attempts, the Sterling failed to overcome this level and edge lower. The nearest resistance is formed by the weekly R1 at 1.2986. This level may be tested today, given the continuous support from the 20-hour SMA. The market in the morning session demonstrates lack of volatility. Thus, traders may be cautious prior to fundamentals from the US at 1230GMT. In case these data do not shake the market tremendously, it is likely that the pair remains between the weekly PP and R1 in the 1.2910/1.3000 range. Solid downside risks could likewise push the rate to a support cluster formed by the 55-, 100– and 200-hour SMAs circa 1.2900.
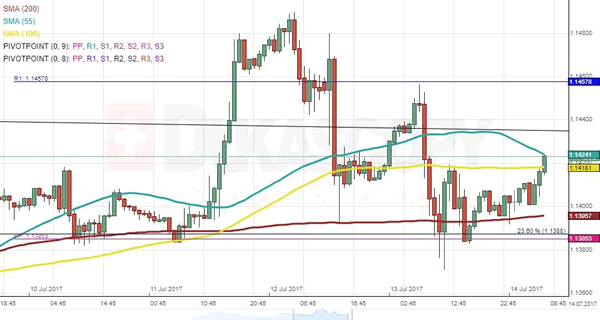
EUR/USD Analysis: Finds Support
After the fall of the common European currency against the US Dollar on Thursday morning the pair had recovered some of the suffered losses on Friday morning. The currency pair found support in the described cluster below it. However, it did reach down below the 1.1380 level at one moment, which might have triggered placed orders. Meanwhile, on Friday morning it was expected that the surge will continue, as the EUR/USD pair faced only the minor resistance of the 55-hour SMA at the 1.1425 mark. Although, there is a previously broken trend line located just below the 1.1440 mark. The trend line might show some minor resistance, as it did during the early hours of Thursday’s trading.
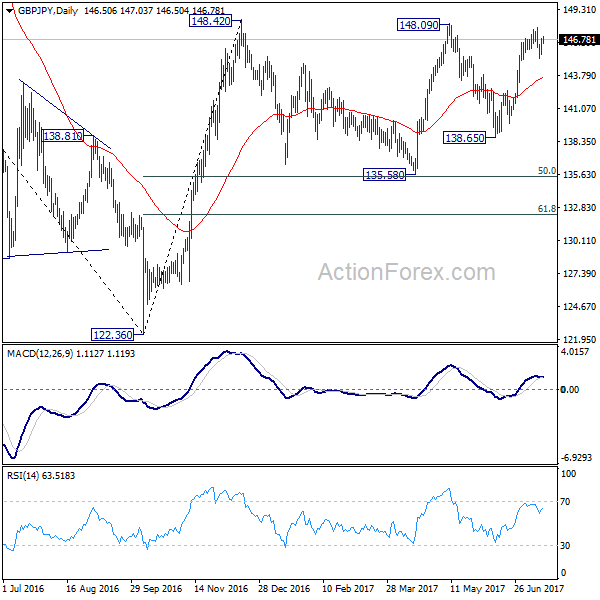
GBP/JPY Daily Outlook
Daily Pivots: (S1) 145.79; (P) 146.33; (R1) 147.12; More
Intraday bias in GBP/JPY is turned neutral with the current recovery. But still, as short term top is formed at 147.76, deeper decline is in favor. Below 145.25 will turn bias to the downside for 55 day EMA (now at 143.70). Break there will target 135.58 key support level again. On the upside, though, decisive break of 148.09/42 will pave the way to long term fibonacci level at 150.43.
In the bigger picture, rise from medium term bottom at 122.36 is expected to continue to 38.2% retracement of 196.85 to 122.36 at 150.43. Decisive break there will carry long term bullish implications and pave the way to 61.8% retracement at 167.78. In case the sideway pattern from 148.42 extends, we'd be looking for strong support from 135.58 and 50% retracement of 122.36 to 148.42 at 135.39 to contain downside.

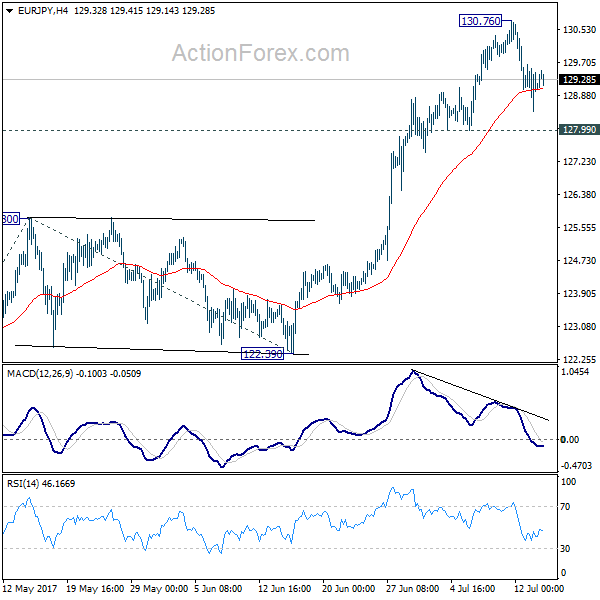
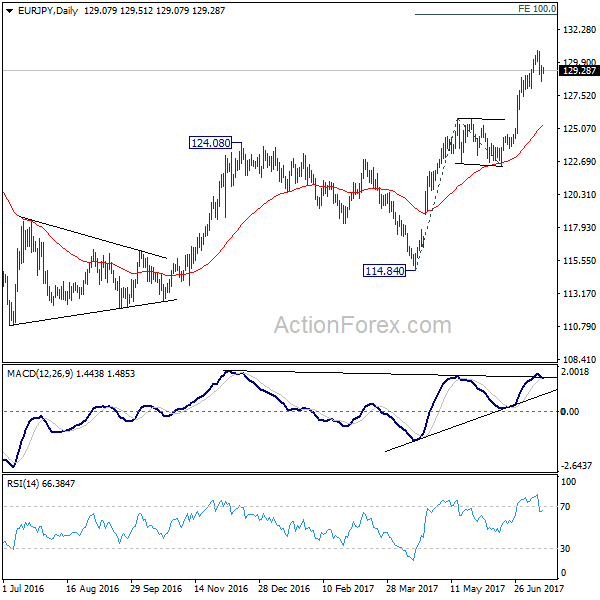
EUR/JPY Daily Outlook
Daily Pivots: (S1) 128.51; (P) 129.08; (R1) 129.68; More...
Intraday bias in EUR/JPY remains neutral for consolidation below 130.76 temporary top. Near term outlook remains bullish as long as 127.99 support holds. Above 130.76 will target 100% projection of 114.84 to 125.80 from 122.39 at 133.35 next. However, considering bearish divergence condition in 4 hour MACD, break of 127.99 will bring deeper pull back 55 day EMA (now at 125.24).
In the bigger picture, the break of 126.09 support turned resistance should have confirmed completion of down trend form 149.76 (2014 high), at 109.03 (2016 low). Current rise from 109.03 would now target 61.8% retracement of 149.76 to 109.03 at 134.20 and above. Medium term outlook will remain bullish as long as 122.39 support holds.