

Sample Category Title
EUR/GBP Daily Outlook
Daily Pivots: (S1) 0.8782; (P) 0.8827; (R1) 0.8853; More
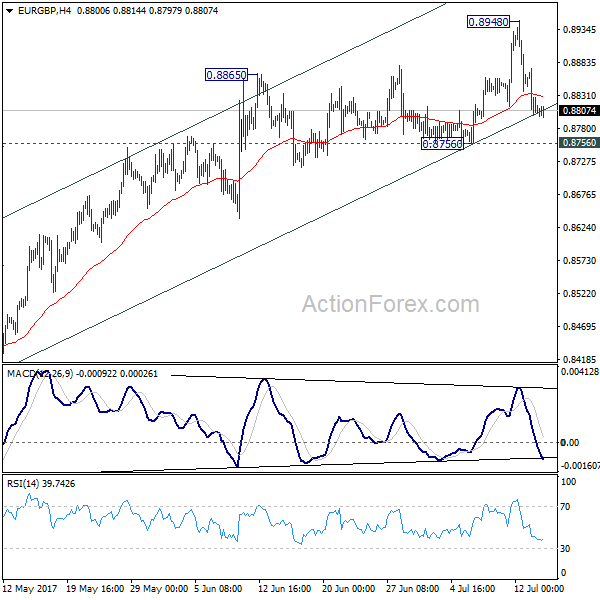
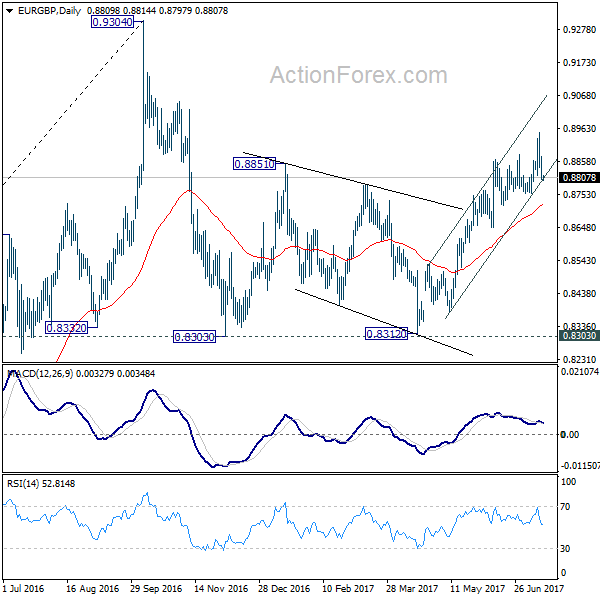
EUR/GBP is holding above 0.8756 support for the moment and intraday bias stays neutral. Further rise is still expected as long as 0.8756 support holds. Above 0.8948 will extend the rise from 0.9312 to retest 0.9304 high. However, firm break of 0.8756 will indicate near term reversal and turn bias to the downside.
In the bigger picture, price actions from 0.9304 are viewed as a medium term corrective pattern. It's uncertain whether it is finished yet. But in case of another fall, we'd expect strong support from 0.8116 cluster support (50% retracement of 0.6935 to 0.9304 at 0.8120) to contain downside and bring rebound. Whole up trend from 0.6935 is expected to resume after consolidation from 0.9304 completes.
USD Consolidates Ahead Of Key Data Releases
In her second testimony before Congress yesterday, Fed Chair Yellen provided little new information on policy to guide dollar traders. The most noteworthy point she made in our view, was that even though low inflation is owed to temporary factors like cheaper prices for phone plans and prescription drugs, there 'may be more going on'. However, she quickly added that it is premature to conclude the underlying inflation trend is falling well short of 2%.
Given the lack of concrete signals from the Fed, we think investors are likely to turn their eyes to today's CPI and retail sales releases for June in order to gauge the likelihood of another rate increase this year. Getting the ball rolling with the CPIs, the headline rate is expected to have slid for the 4th consecutive month, while the core rate is anticipated to have held steady after falling for 4 months in a row as well. We believe traders will have their gaze locked primarily on the core rate, where we see the risks surrounding the forecast as tilted to the upside, given that the nation's Markit services PMI for the month showed that prices charged rose at the fastest pace for 16 months.
As for retail sales, the forecast is for both the headline and core rates to have rebounded from the previous month. The consensus for a rebound is supported by both the Conference Board and U of M consumer sentiment indices for the month, both of which rose. A rebound in sales combined with a potential upside surprise in the core CPI rate could raise the likelihood for another Fed rate hike this year and thereby, reverse some of the dollar's recent losses.
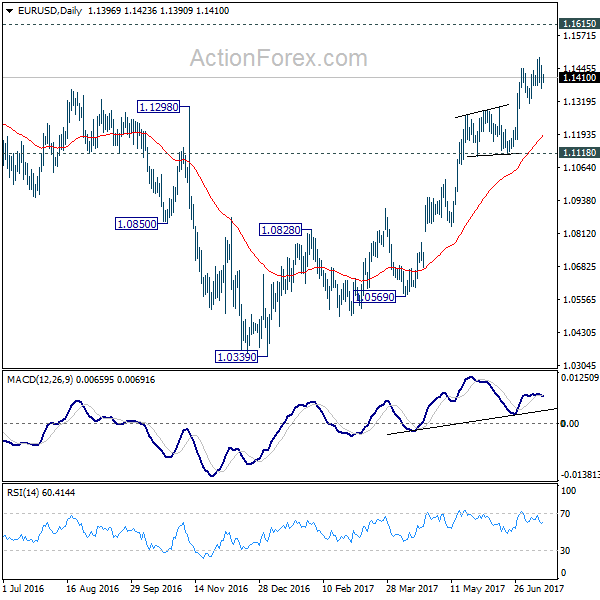
USD/JPY traded higher yesterday after it hit support near the prior downside resistance line taken from the peak of the 11th of January. Then, the rate hit resistance at 113.60 (R1). In our view, the fact that the pair continues to trade above the aforementioned medium-term downside line keeps the door open for further advances. A clear break above 113.60 (R1) could initially aim for the 114.00 (R2) hurdle, where another break may target again the key resistance territory of 114.40 (R3). The catalyst for such a move may be a possible rebound in the US core CPI rate today. Having said that though, if inflation continues to slow, we may see the pair sliding back below the key downside resistance drawn from the peak of the 11th of January, something that may turn the picture negative, at least for a while.
XAU/USD traded lower yesterday after it hit resistance slightly below the downtrend line drawn from the peak of the 7th of June. As long as the precious metal is trading below that line, we consider the near-term outlook to be negative and as such, we would expect a dip below 1215 (S1) to aim for another test near the 1205 (S2) line. However, as we get closer to the 1200 (S3) psychological barrier, we would be careful of a possible rebound, as the 1200 (S3) zone appears to be the lower bound of a medium-term sideways range that contains the price action since the end of January. We prefer to wait for a clear close below 1200 (S3) before we get confident on larger declines.
As for the rest of today's highlights:
During the European day, the economic calendar is relatively light. The only notable indicator we get is Eurozone's trade balance for May, though no forecast is available. From the US, besides the CPIs and retail sales, we will also get the nation's industrial production for June and the preliminary U of M consumer sentiment index for July.
We have only one speaker on the agenda: ECB Governing Council member Ewald Nowotny.
USD/JPY
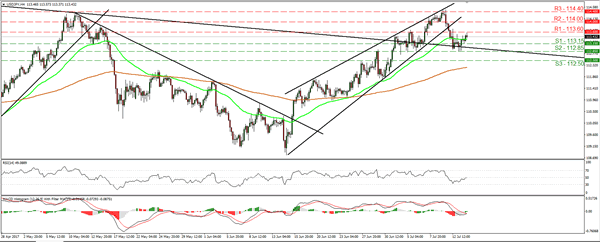
Support: 113.15 (S1), 112.85 (S2), 112.50 (S3)
Resistance: 113.60 (R1), 114.00 (R2), 114.40 (R3)
XAU/USD
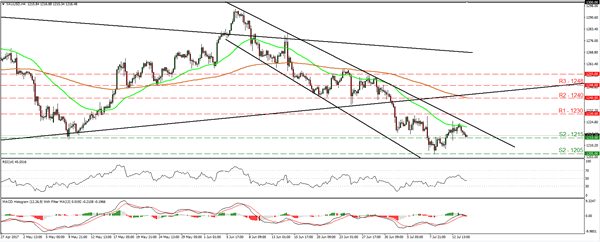
Support: 1215 (S1), 1205 (S2), 1200 (S3)
Resistance: 1230 (R1), 1240 (R2), 1248 (R3)
EUR/AUD Daily Outlook
Daily Pivots: (S1) 1.4669; (P) 1.4781; (R1) 1.4857; More...
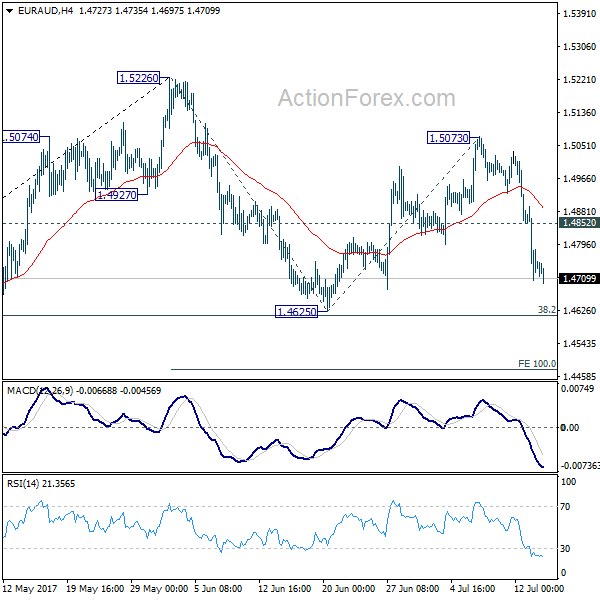
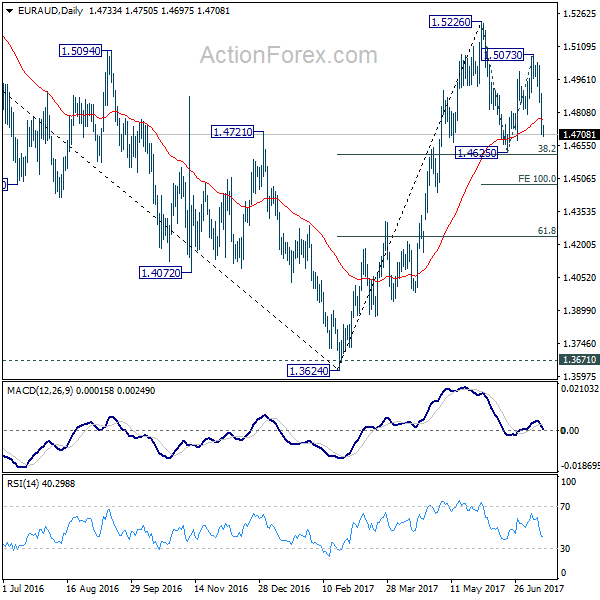
Intraday bias in EUR/AUD remains on the downside for 1.4625 support. Break there will whole corrective decline from 1.5526 and target 100% projection of 1.5226 to 1.4625 from 1.4472. On the upside, above 1.4852 minor resistance will turn intraday bias neutral again.
In the bigger picture, price actions from 1.6587 medium term top are viewed as a corrective pattern. Such correction should be completed at 1.3624 after defending 1.3671 key support. Rise from 1.3642 would extend to 61.8% retracement of 1.6587 to 1.3624 at 1.5455. Sustained break there will pave the way to retest 1.6587. However, sustained break of 1.4625 support will dampen this bullish view. In that case, we'll assess the outlook later after looking at the structure and depth of the pull back.
EUR/CHF Daily Outlook
Daily Pivots: (S1) 1.0991; (P) 1.1015; (R1) 1.1045; More...
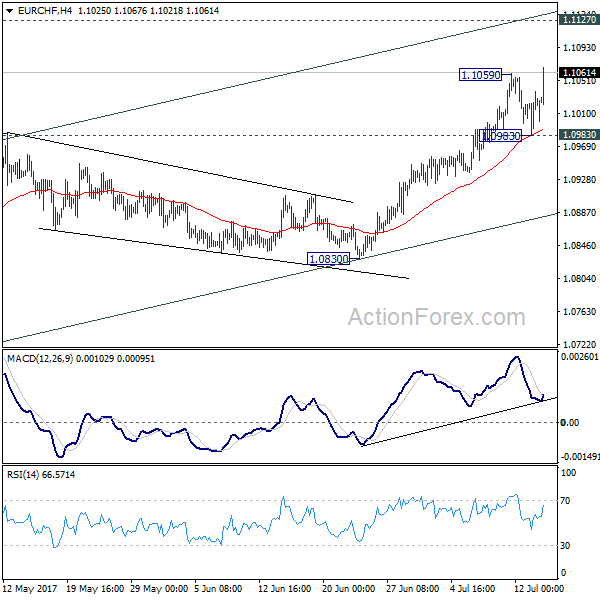
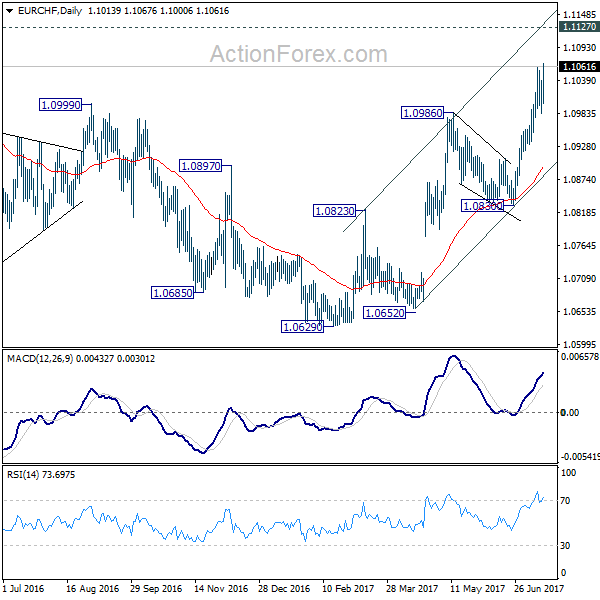
EUR/CHF's rally resumed after brief consolidation and intraday bias is back on the upside. Current rise is expected to target 1.1127 resistance next. On the downside, break of 1.0983 support is needed to indicate short term topping. Otherwise, outlook will remain bullish in case of retreat.
In the bigger picture, the price actions from 1.1198 are seen as a corrective move. Such correction could have completed after defending 38.2% retracement of 0.9771 to 1.1198 at 1.0653. Decisive break of 1.0999 resistance should target a test on 1.1198 high. For now, this will be the preferred case as long as 1.0830 support holds.
Producer Price Edge Up, Initial Jobless Claims Drop 3K
'We expect inflation pressures to firm in the second half of the year, but any realized gains are likely to be limited.' - Sam Bullard, Wells Fargo Securities
The US Producer Price Index for final demand nudged up 0.1% in June on the back of sustained increases in services cost that managed to offset plunging energy prices, data released by the Labour Department revealed on Thursday. The gain came in as a surprise, as the vast majority of analysts had predicted the index to stay unchanged, and suggested that a recent moderation in inflation was likely temporary. In 12 months through June, the PPI advanced 2.0%, down 0.4% from May's reading, as the energy-led spike was dropped out of the calculation. Meanwhile, the Core Finished Goods PPI advanced a modest 0.1% over the reported period, missing economists' expectations for a 0.2% uptick and following the 0.3% surge registered in May. Year-on-year, the core PPI climbed 2.0% in June after rising 2.1% in the preceding month. In another report, the Labour Department said the number of Americans filing for unemployment benefits dropped 3K to a seasonally adjusted 247K in the week ended July 8.
Elliott Wave Analysis: USDCAD Trading Bearish, A Temporary Correction May Follow
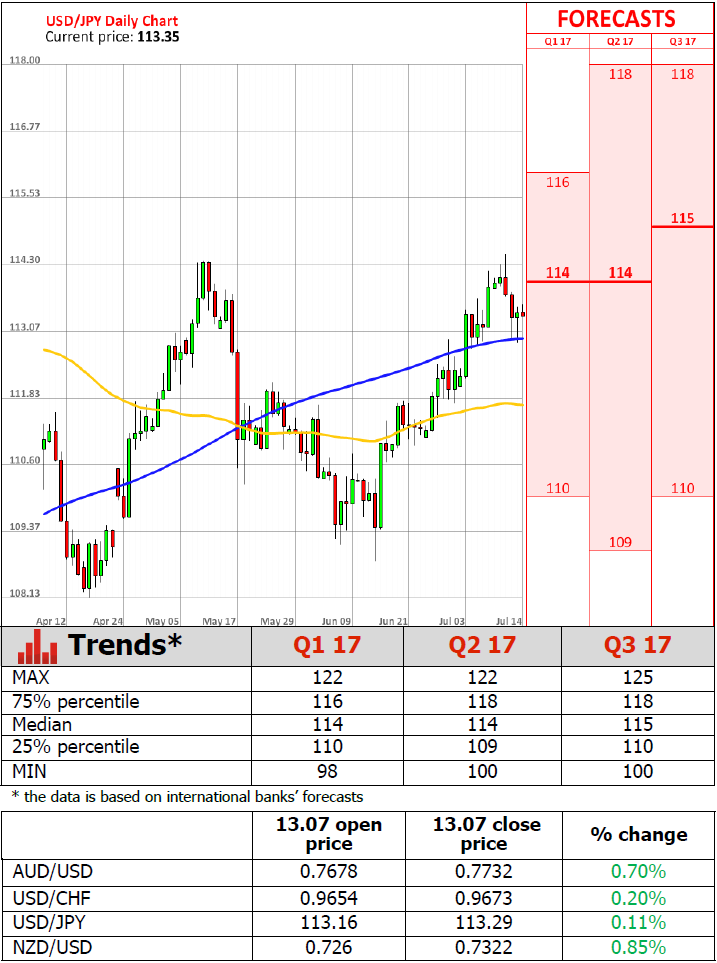
USDCAD made a sharp drop two days ago, which we now see it as the final piece of an extended impulse of blue wave three. If that is the case, then current drop can now face some limited downside near the Fibonacci ratio of 423.6 region and make a new three wave recovery higher in days ahead. Ideally we will see blue wave iv unfold a new minimum three wave rally to the upside, specifically to around 1.2943/1.3000 region, where former wave four consolidations can act as resistance and push price again lower into wave five of 3.
USDCAD, 4H
EUR/USD Daily Outlook
Daily Pivots: (S1) 1.1360; (P) 1.1407 (R1) 1.1445; More.....
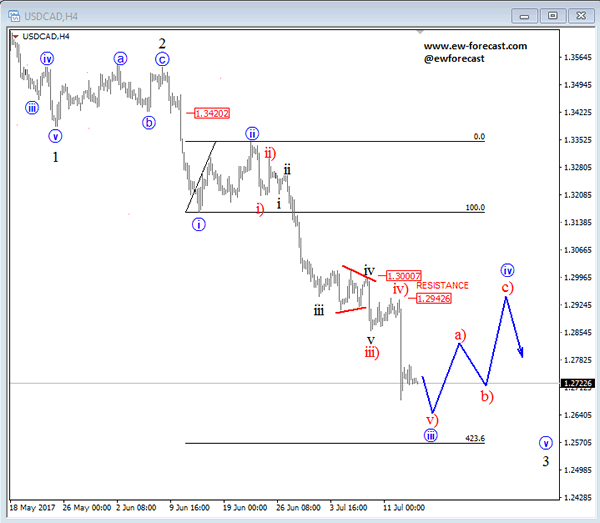
Intraday bias in EUR/USD remains neutral for the moment. 1.1489 should be a short term top on bearish bearish divergence condition in 4 hour MACD. Deeper retreat could be seen to 1.1312 support and below. But downside should be contained by 1.1118 support to bring rise resumption. On the upside, break of 1.1489 will extend recent rally from 1.0339 to 1.1615 key resistance next.
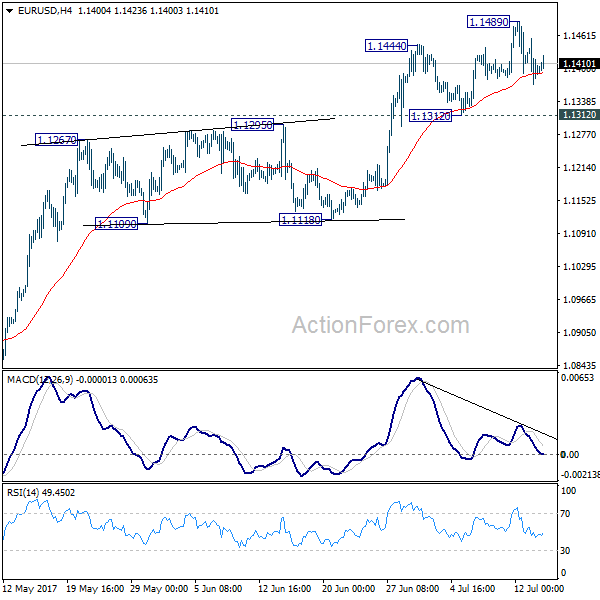
In the bigger picture, the firm break of 1.1298 resistance further affirm medium term reversal. That is an important bottom was formed at 1.0339 on bullish convergence condition in weekly MACD. Further rise would be seen to 55 month EMA (now at 1.1763). Sustained break there will pave the way to 38.2% retracement of 1.6039 (2008 high) to 1.0339 (2017 low) at 1.2516 next. This will now remain the favored case as long as 1.1118 support holds.
Gold Not Far Above 1,200, Remains Neutral In The Medium-Term
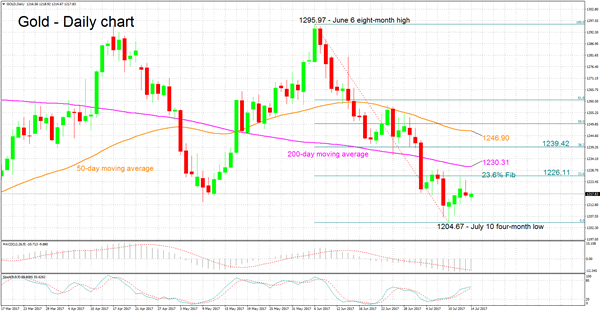
Gold has lost significant ground since the eight-month high of 1,295.97 it reached on June 6th. The precious metal currently trades not far above the 1,200 level.
The MACD indicator is painting a bearish picture. Specifically, the MACD is negative as well as below its red signal line. Despite the bearish bias, momentum in the very short-term seems to be to the upside as indicated by the stochastics. In particular, the %K line maintains a steep positive slope, while it has crossed above the slow %D line.
If the price heads higher, resistance could be met around the 23.6% Fibonacci level (June 6 – July 10 downleg) at 1,226.11. Further advancing would shift focus to the area around the 200-day moving average (MA) at 1,230.31 as an additional barrier to the upside.
Should the price fall, the area around the four-month low of 1,204.67 from July 10 could provide support. Further down, support is likely to come around the 1,200 handle, which has served as a key psychological level in the past.
Turning to the medium-term picture, it remains neutral with significant sideways movement for the precious metal over the last number of months. The 50- and 200-day MAs being flat at the moment add to this conviction.
GBP/USD Daily Outlook
Daily Pivots: (S1) 1.2890; (P) 1.2922; (R1) 1.2970; More...
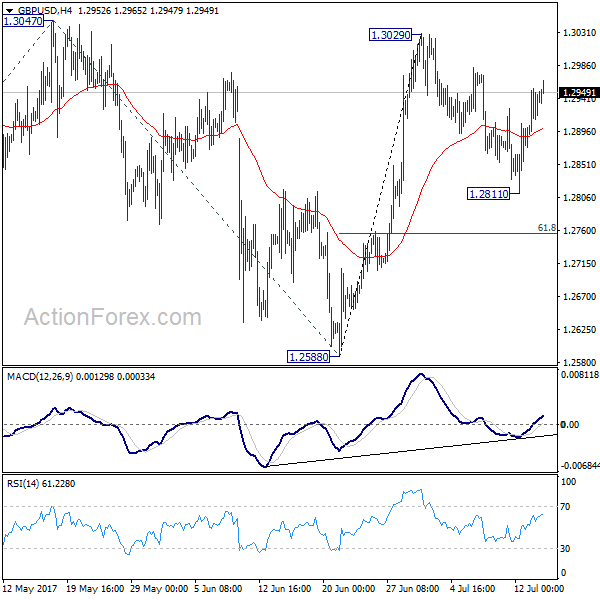
Intraday bias in GBP/USD remains on the upside for 1.3029/47 resistance zone. Decisive break there will extend the larger rally to 61.8% projection of 1.2108 to 1.3047 from 1.2588 at 1.3168 next. On the downside, sustained break of 1.2811 and 55 day EMA will dampen our bullish view and turn bias back to the downside for 1.2588 support instead.
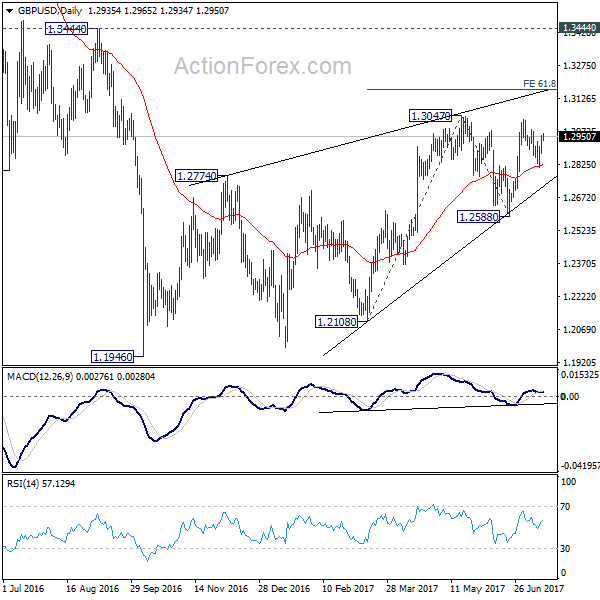
In the bigger picture, overall, price actions from 1.1946 medium term low are seen as a corrective pattern that is still in progress. While further upside is now in favor, overall outlook remains bearish as long as 1.3444 key resistance holds. Larger down trend from 1.7190 is expected to resume later after the correction completes. And break of 1.2588 will indicate that such down trend is resuming.
Dollar Steady Ahead Of Key Inflation Release, Euro, Sterling Gain
The US dollar was steady against the yen during the Asian session, but weakened against most other majors. The key inflation data out of the US could potentially dictate today's biggest forex market moves. The euro and the pound were both up, while oil came under some pressure ahead of the European open.
The dollar steadied against the yen, helped by upbeat US economic data, after earlier weakness due to a dovish-perceived testimony by Federal Reserve Chair Janet Yellen to Congress. The Fed Chair believes that the current level of interest rates is not far from a neutral policy stance and hence rates would not have to rise “all that much”. She also sounded less confident about the lack of inflationary pressure being just a temporary issue. A set of important US data releases, which could significantly impact dollar trading such as June consumer inflation and retail sales, is due later today.
The dollar index was down 0.05% at 95.68 ahead of European trading. The dollar was broadly flat against the yen and the loonie, but weakened against other major counterparts. Dollar/yen was last trading at 113.29.
Both, the Australian and New Zealand dollars gained against the dollar during the Asian session, continuing their rally from yesterday. Aussie/dollar was last up 0.32%, trading at 0.7751, while kiwi/dollar was up 0.05%, trading at 0.7326. The kiwi came under a bit of pressure after business PMI for June fell to 56.2, below last month's high of 58.5, though it quickly recovered.
The euro was up 0.20% against the dollar to last trade at $1.1415 ahead of the European open. The eurozone common currency got a lift yesterday following the report by the Wall Street Journal on the European Central Bank signalling the timing of QE tapering in September.
Sterling continued strengthening against the dollar for the third consecutive day as investors covered some short positions after the Fed Chair induced dollar weakness. Pound/dollar was up 0.20% to last trade at 1.2961. Following the recent hawkish comment by Bank of England member Ian McCafferty, no other obvious catalyst seems apparent in terms of economic releases and news today.
The Canadian dollar weakened slightly against its US counterpart, but at 1.2730 the loonie is still around the 12-month high level.
Crude prices were on the rise for most of the Asian session after a late-day rally during the preceding session. However, prices came under some pressure as European trading was starting. WTI was last trading at $45.92 a barrel, while Brent was at $48.31.
Gold prices rose erasing yesterday's losses. The precious commodity was last trading at $1,218.23 an ounce.