Sample Category Title
BoE Should Consider Winding Down Its Asset Purchase Programme Sooner: BoE’s Ian McCafferty
For the 24 hours to 23:00 GMT, the GBP rose 0.39% against the USD and closed at 1.2941, after the Bank of England (BoE) member, Ian McCafferty, struck a hawkish tone on monetary policy.
The BoE rate-setter, Ian McCafferty, stated that it is appropriate for the BoE to consider tapering its £453.0 billion asset purchase programme sooner rather than later.
Separately, the BoE's credit conditions survey report revealed that availability of unsecured credit to households had decreased in the previous three months and banks are expected to further tighten the screw on consumer credit over the coming quarter as the outlook for household finances darkens amid uncertainty over Britain's economic prospects.
In the Asian session, at GMT0300, the pair is trading at 1.2944, with the GBP trading a tad higher from yesterday's close.
The pair is expected to find support at 1.2906, and a fall through could take it to the next support level of 1.2869. The pair is expected to find its first resistance at 1.2968, and a rise through could take it to the next resistance level of 1.2993.
With no economic releases in the UK today, investors await Britain's crucial inflation and retail sales data, slated to release next week.
The currency pair is showing convergence with its 20 Hr moving average and trading above its 50 Hr moving average.

Japan’s Industrial Output Fell More Than Initially Estimated In May
For the 24 hours to 23:00 GMT, the USD rose 0.06% against the JPY and closed at 113.38.
In the Asian session, at GMT0300, the pair is trading at 113.40, with the USD trading marginally higher against the USD from yesterday's close.
On the economic front, Japan's final industrial production fell 3.6% in May, while the preliminary print had indicated a drop of 3.3%. In the previous month, industrial production had advanced 4.0%.
The pair is expected to find support at 112.98, and a fall through could take it to the next support level of 112.56. The pair is expected to find its first resistance at 113.7, and a rise through could take it to the next resistance level of 114.00.
Going ahead, traders will closely monitor the Bank of Japan's interest rate decision, slated to be announced next week.
The currency pair is trading above its 20 Hr and 50 Hr moving averages.

Canada’s New House Price Index Came In Better-Than-Anticipated In May
For the 24 hours to 23:00 GMT, the USD declined 0.2% against the CAD and closed at 1.2733.
Macroeconomic data indicated that Canada's new housing price index rose more-than-expected by 0.7% on a monthly basis in May, compared to market expectations for a rise of 0.3%. The index had recorded a rise of 0.8% in the prior month.
In the Asian session, at GMT0300, the pair is trading at 1.2729, with the USD trading slightly lower against the CAD from yesterday's close.
The pair is expected to find support at 1.2710, and a fall through could take it to the next support level of 1.2690. The pair is expected to find its first resistance at 1.2760, and a rise through could take it to the next resistance level of 1.2790.
Moving ahead, Canada's consumer price index, retail sales and existing home sales data, all due to release next week, will be on investors' radar.
The currency pair is showing convergence with its 20 Hr moving average and trading below its 50 Hr moving average.

Swiss Franc Trading Marginally Higher This Morning
For the 24 hours to 23:00 GMT, the USD rose 0.22% against the CHF and closed at 0.9673.
On the macro front, Switzerland's producer and import prices unexpectedly fell 0.1% MoM in June, compared to market expectations for a flat reading. The producer and import price index had dropped 0.3% in the prior month.
In the Asian session, at GMT0300, the pair is trading at 0.9668, with the USD trading a tad lower against the CHF from yesterday's close.
The pair is expected to find support at 0.9627, and a fall through could take it to the next support level of 0.9586. The pair is expected to find its first resistance at 0.9698, and a rise through could take it to the next resistance level of 0.9728.
Going forward, investors will keep a close watch on Switzerland's trade balance data for June, the sole important release next week.
The currency pair is trading above its 20 Hr and 50 Hr moving averages.

US Data Eyed After Yellen’s Comments
- Has the Fed become more dovish in light of persistent subdued inflation?
- Weak retail sales and inflation data could dent rate hike hopes further.
European futures are pointing to a slightly higher open on Friday, adding to gains from earlier in the week which have broadly been triggered by the possibility of slower tightening from the Federal Reserve.
Yellen's comments on Wednesday regarding the neutral rate and subdued inflation sent a more dovish message to the markets than we've become accustomed to, particularly of late with a number of central banks suddenly appearing in a rush to tighten monetary policy. The recent commentary has weighed a little on equity markets and it would appear the prospect of a less hawkish Fed has offered a little reprieve.
While we may not be hearing from many central bankers during today's session – Fed's Robert Kaplan the only policy maker due to make an appearance – it is likely that focus will remain on the Fed as we get some important US economic data. Retail sales and CPI inflation are two of the most important pieces of US data we get each month and both are due to be released shortly before the open on Wall Street.
With the first half of the European session looking very quiet, the US will be the primary focus today. The Fed is currently expected to raise interest rates once more this year, most likely in December, and announce plans to start reducing its roughly $4.5 trillion balance sheet following years of US Treasury and Mortgage Backed Securities purchases. Market have struggled to get on board with one more rate hike though and Yellen's comments on Wednesday suggest Fed officials are not entirely convinced either.
Weakness in the data today will only fuel these concerns, particularly with regards to inflation which has remained stubbornly low throughout the tightening process so far. While CPI may not be the Fed's preferred measure of inflation, it is released earlier and identifies whether prices are ticking higher or remain subdued. Should we see the latter today, as expected, and it be accompanied by uninspiring spending data, it will only harden people's belief's that the Fed should hold off on the next hike until next year and could therefore weigh further on the dollar and Treasury yields.
GBPCHF Poised For A Tumble Moving Forwards
Key Points:
- The near-term technical bias is now looking rather bearish.
- A reversal could see the pair back at the 1.24 handle.
- Long-term bias remains bullish
A surprise rally of around 80 pips has brought the GBPCHF into conflict with some robust resistance which could mean a sharp correction is now on the way for the pair. Indeed, the bears could swing into action in the coming session or early next week as, at least on the face of it, the bull's latest bid to break above the 1.2538 handle seems to have failed.
As shown below, despite some strong buying pressure, the 38.2% Fibonacci level has remained intact once again. Of course, this isn't entirely surprising given the presence of the 100 day moving average – a decent source of dynamic resistance. Additionally, the movement of the stochastics into overbought territory will be stifling any hopes that a breakout is on the way. As result, there is really little where else for the pair to go but down over the coming days
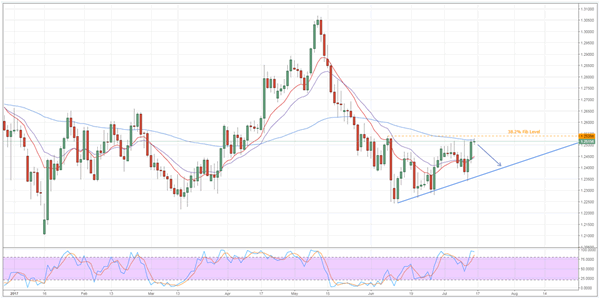
Nevertheless, things aren't entirely grim looking ahead as the trend of higher-lows is also still in play which should see losses limited to the 1.24 handle. What's more, the unexpected push higher over the prior 48 hours has revived the bullish parabolic SAR bias which will help to keep support intact around the 1.24 handle. Furthermore, it will also enable the pair to reverse to the upside once it has tested that trendline again.
If we do see a secondary reversal, it will be worth watching exactly to where the subsequent uptrend extends to. This is largely due to the fact that it will help us to confirm whether we are amidst a rising wedge or a bullish channel. Determining this will allow us to judge the pace of the apparent long-term recovery of the pair – something the bulls are keenly monitoring.
Overall, expect to see losses in the near-term followed by a recovery, potentially above the 38.2% Fibonacci level. However, don't neglect the fundamental side of things as the GBP has been having some strong reactions to both the hard data and the rhetoric which could upset this technical forecast. Indeed, a suitably bullish reaction to a fundamental upset could spark a breakout above the 1.2538 level that might actually see the pair surge to the 1.2650 handle before moderating.
Gold Directional Bias Remains In Question
Key Points:
- Price action appears ready to recommence a move towards the channel bottom.
- RSI Oscillator rising within neutral territory.
- Watch for an upside move by the metal in the week ahead
Precious metals markets have seen some relatively strong swings in the past few months as the market continues to come to terms with the changing battleground which is monetary policy. Subsequently, gold's directional bias has been a little difficult to predict as it has regularly changed in response to the level of rhetoric emanating from the FOMC. However, some interesting technical and fundamental factors have appeared which could pave the way for a change in the metal's direction.
Fundamentally, Gold's price movements have been tightly connected with the Fed's monetary policy and the past few months have proved relatively negative as the central bank uses the expectation channel to hammer home their desire to raise interest rates. However, the past week has seen much of the speculation of a cycle of tightening start to reverse as the Fed Chair, Janet Yellen, is seemingly backing away from her relatively hawkish rhetoric. In fact, the central banker has been at pains to suggest that she remains ‘Cautiously Optimistic' whilst at the same time suggesting the Fed is now nearing a neutral interest rate. Subsequently, there is little prospect of successive tightening in the remainder of 2017.
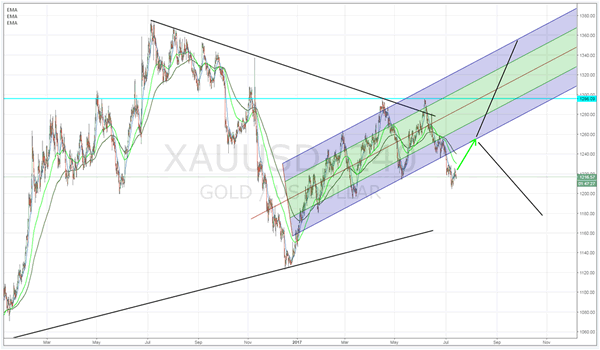
The technical aspects of the precious metal are also suggestive that there is likely to be a change in directional bias in the coming days. In particular, price action has recently fallen out of the bottom of an Andrews pitchfork and was trending lower until the recent spate of Fed dovishness. Since that point, the RSI Oscillator appears to have started trending higher, within neutral territory, whilst price action appears to be consolidating. Subsequently, there is a technical view that, as the sentiment continues to build, that Gold will continue to rise back towards the pitchfork channel.
Subsequently, there are plenty of reasons to see some bullishness for the metal in the week ahead given both the aforementioned fundamental and technical factors. However, at the point where price action returns to the pitchfork, the medium term view becomes significantly hazier with plenty of doubt as to whether the metal will recommence its bullish march towards $1300 an ounce.
Ultimately, the short term is likely to be relatively beneficial to gold prices and the most likely scenario is one where price action trends towards the bottom of the channel at $1239 before further consolidation is seen. At that point, it would be prudent to take a wait and see approach as to whether gold remains upwardly biased
Market Morning Briefing: Lots Of Data Today
STOCKS
Dow (21553.09, +0.10%) is trading below crucial resistance near 21600 and while that holds, a small dip back to levels near 21500-21400 is possible in the medium term. Only on a sustained rise above 21600, would we negate the immediate fall and shift our focus on higher levels. Till then we wait and watch for price confirmation.
Dax (12641.33, +0.12%) could move higher and face an initial rejection from levels near 12800 before pausing for sometime. Overall near to medium term looks bullish. A rise towards 12800 is expected in the coming sessions.
Shanghai (3214.25,-0.12%) is trading slightly lower today but while above 3190, near term looks bullish towards 3240-3250 levels.
Nikkei (20122.34, +0.11%) is almost stable and is trading above immediate support near 20100. A rise from here is expected in the coming sessions. The fall in USDJPY in the last few sessions is keeping the Nikkei stable. In case the Nikkei bounces back from current levels, it could pull the currency pair also with itself to higher levels.
Nifty (9891.70, +0.77%) opened with a gap up yesterday and kept moving up to test 9900 much faster than we had expected. The rally to 10000 could be achieved possibly by the next week itself if the current momentum continues to play out.
COMMODITIES
The recent trading ranges for Gold (1215) and Silver (15.60) could be 1188-1231 and 15.20-16.10 respectively. Both of them are in a neutral trading zone and we will be assured of strength in Gold and Silver only when a firm and sustainable closing above 1231 and 16.50 are made by both of them. Otherwise a failure to close above those levels may push them towards 1200 and 15.20 levels respectively.
Muted price action had been seen in Copper (2.66), trading within the same range of 2.66-2.78. Only above 2.78 higher resistances of 2.85 can come into consideration. In the medium term 2.55-57 are going to be a strong support and we will remain bullish while it is trading above those levels.
We have consecutive shortage of 7.3, 3.2 and 6.3 M B in U.S oil inventories for last three weeks and at last, the movement in Brent (48.40) and WTI (46.03) during yesterday has been comparatively in line with that.From the previous week’s low of 46.28 (Brent) and 46.38 (WTI), both of them rallied to 48.40 and 46.03 respectively. Despite the lack of momentum, with the higher lows formation in the last few days, bulls are slowly gathering momentum. As discussed earlier, the upside possibilities remain open till the supports of 47.75 (Brent) and 45.60 (WTI) holds.
FOREX
Lots of data today. US CPI and Retail Sales at 12:30 GMT (18:00 IST) and US Industrial Production at 13:15 GMT (18:45 IST). Currencies might be quiet till then, as the EU Trade Balance during the day might not move the market.
Dollar-Yen (113.40) dipped to 112.65 overnight, but has bounced well from there and may try to move higher towards 114.00. If successful, it would open up chances of 116 later in the month. Failure to move up today could pull Dollar-Yen down towards 112.50 and lower next week.
The Euro-Yen (129.31) had seen a sharp decline to 128.50 yesterday and has bounced well from there. But, it has to rise past 130 today in order to make further headway next week. Else, there might be chances of seeing a fall towards 127 as well.
In this context, the Euro (1.1405) perhaps depends a lot on Euro-Yen. Euro has seen good profit-taking on Longs near 1.1480 this week and trades at a crucial juncture just now. Failure to move up past 1.1440 today would make it vulnerable to a dip towards 1.1350-00 next week.
Perhaps the biggest thing in favor of the Euro is that the German 30 Yr has broken well above a long-term declining trendline Resistance coming down from level near 3.9% in 2011.
Dollar Index (95.75) remains weak below 96.00 and the major support at 95.50-40 is back in focus now. To confirm the bullishness of Euro, Dollar Index needs a breakdown below 95.50-40. In case, 96.50 holds, the Dollar bulls can attempt a rise above 96.00. Keep an eye on the direction of the break.
Aussie (0.7735) is trading at a 4-month high as it tests the long term resistance zone of 0.7700-75 above which comes 0.7830-50. The resistance of 0.7700-75 may hold for now and trigger a correction. Caution warranted for the bulls.
Contrary to our expectation, Dollar-Rupee (64.45) dipped to 64.35 at the Open itself, perhaps adjusting for expectations of an interest rate cut on 2nd August, on the heel of the 1.54% CPI release on the previous day. The price action further reduces the chances of upside beyond 64.70-80 and increases the chances of eventual dip below 64.40-35 to target 64.15 initially.
INTEREST RATES
The US yields are trying to consolidate at lower levels. The 5YR (1.89%), 10YR (2.35%) and the 30Yr (2.91%) are all trading marginally higher and if these levels hold them we might see some reversal during next week.
Producer Prices Soften, Consumer Prices Up Next
The softness on PPI data overnight sugests a top has been seen, which doesn;t bode well for CPI data or Fed tightening in H2.
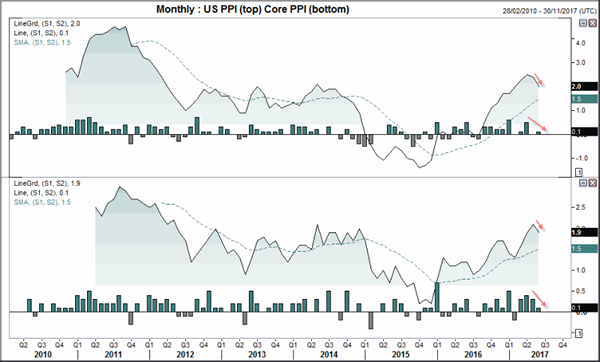
Producer prices softened in June, with the broad PPI read falling to 2% YoY from 2.4% in May, although slightly above expectations of 1.9%. Core PPI disappointed by missing exactions of 2% and falling from 2.1% in May to 1.9% in June. As the monthly reads for both have declined since April the we can expect further softness in July unless we are treated to a spike higher. We don’t see this as a likely occurrence when we consider that both reads have edged lower from prior levels of resistance and our assessment of commodity prices. This is an important point which we’ll cover in greater detail shortly, especially as inflation data is out tonight for the US.
Yellen appeared before the Senate again last night, in what could be her last testimony if Trump replaces her next year. The sentiment surrounding the economy was mostly a repeat of the prior session, of a cautiously optimistic view and talk of slight balance sheet reduction. However, about President Trump’s 3% growth target Lady Yellen deemed it to be 'quite challenging'. Acknowledging it would be a wonderful target to achieve she went on to say it would require a broad set of changes form tax reforms and improved education. With all the controversy surrounding the Whitehouse and failure to reform the health care system, tax reforms currently look dead in the water so perhaps ‘challenging’ would be an understatement.
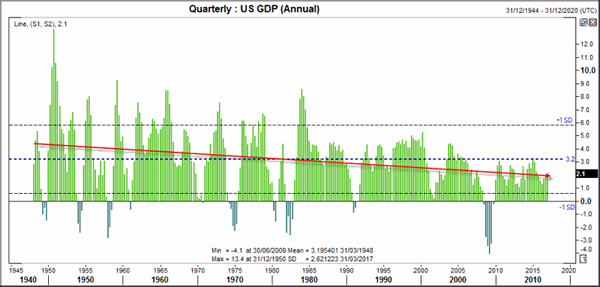
If we assess annual GDP from 1948 we can see the long-term trend points lower and that the long-term average is 3.2%. At 2.1% we are at the lower bound of the top half of the average to -1 standard deviation, which is another sign of weakness. When these long-term stats are working against you it likely requires even more effort to overpower them, let alone sustain growth on average at such a pace. As this is clearly a secular trend we doubt the abilities of any single president or government to turn this one around. So with growth more likely to trend lower than reverse the secular trend, we take a look at the other issue for the Fed; inflation.
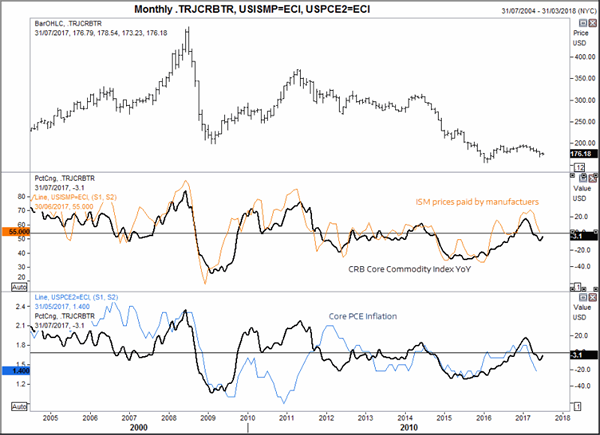
The next chart provides a huge problem for the Fed and partially explains why traders remain sanguine about the Fed’s hiking trajectory. The CRB commodity index is a key ingredient for inflation and remains within a secular downtrend. Perhaps the low was seen in Feb 2016, but we would have to see a break above 200 before seriously considering it. By taking the YoY% rate of commode prices we can easily see the close relationship between prices paid by manufacturer’s (taken from the ISM report) and, interestingly, Core PCE inflation. The latter excludes volatile items such as commodities yet the relationship remains clear. If commodity prices are rising then this puts upwards pressure through the supply chain to the consumer and, conversely, they fall in tandem too. With commodity prices currently down -3.1% over the past 12 months and considering the time it takes for the declines deflationary effect to impact inflation, then it is more than likely inflation will remain pressured over the next few months or even the remainder of the year.
GBP/USD Likely To Test The Dynamic Resistance, USD/JPY Undecided, Brent Oil Poised To Approach The $50 / Barrel
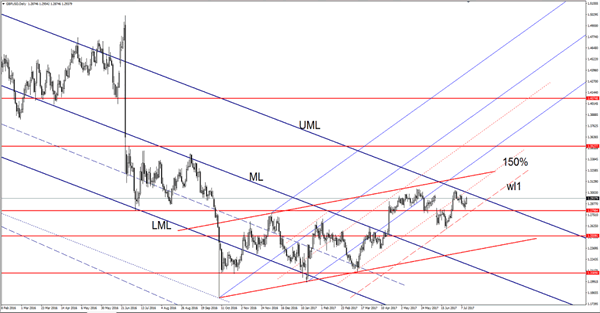
GBP/USD likely to test the dynamic resistance
Price increased on Thursday and looks to have enough energy to reach new highs, surges thanks to a weaker dollar. Approaches a major dynamic resistance after the failure to retest the 1.2798 static support.
Continues to move somehow sideways on the short term, maintaining a bullish perspective on the short term as long as the short term uptrend line remains intact. Cable edges higher as the dollar index stay much below the 96.00 psychological level, only a USDX’s rally will force the GBP/USD to turn to the downside again. USDX could move sideways on the short term, but remains to see if this will be an accumulation or a distribution movement.
We may still have a Falling Wedge on the USDX, all he needs is a bullish spark from the United States economy, which could come today if the US data will come in line with expectations or better. I want to remind you that a poor US data will send the greenback tumbling.
GBP/USD could finally reach and retest the upper median line (UML) of the major descending pitchfork, which represents a very strong dynamic obstacle. Is trading within an ascending channel, so the perspective remains bullish.
The failure to reach and retest the 1.2798 static support and the first warning line (wl1) of the ascending pitchfork has signalled that the buyers are still very strong and could drive the rate towards new highs. The behavior has changed on the short term when has started to make higher lows, but the sentiment remains unchanged as long as is trapped within the major descending pitchfork’s body.
GBP/USD signalled an exhaustion when has failed to reach the 1.3047 previous high, but remains bullish as long as is trading above the warning line (wl1), only a drop below this level will confirm an important drop.
USD/JPY undecided
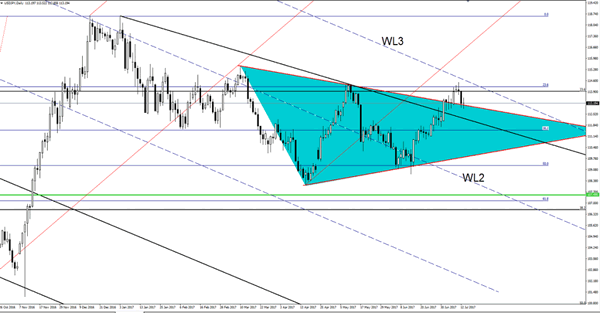
We had some volatility on the USD/JPY on Thursday, right now will be better to stay away from this pair because we don’t have a clear direction on the short term. Continues to move sideways on the short term, was rejected by a resistance area and now is into a corrective phase, but remains to see how long this will be because has touched a dynamic support.
The greenback lost significant ground versus the Yen after the false breakout above the 23.6% retracement level, the current retreat is natural after the failure to reach the warning line (WL3), we’ll have a perfect buying opportunity only if the rate will jump and will stabilize above the WL3 and above the 23.6% retracement level.
Brent Oil poised to approach the $50 / barrel
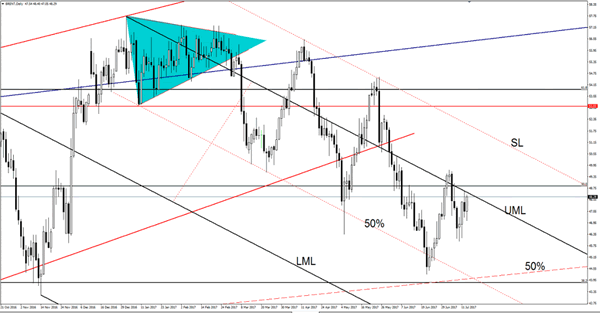
Brent Oil is trading in the green and tries to take out the major dynamic resistance from the upper median line (UML) of the major descending pitchfork. A further increase will be confirmed only after a valid breakout above the 50% retracement level. Could increase further after the failure to stabilize below the 46.50 psychological level.