
Sample Category Title
US Dollar Looks To Consumer Prices And Retail Sales Data
The US dollar was seen trading mixed as the greenback attempted to post some gains against the euro while the antipodean currencies continued to post strong gains. The Fed Chair, Janet Yellen was seen concluding her two-day remarks to the US lawmakers. It was evident by the end that the Fed was hinting a dovish rate hike cycle.
Yesterday, the BoE policymaker, Ian McCafferty argued the case for policy tightening. He said that he favors a sooner unwinding of the QE. McCafferty is a well known hawk on the BoE's board and was one of the members who voted for a rate hike at last month's BoE meeting.
Looking ahead, the data today will focus on the US numbers. Inflation and retail sales figures will be coming out. Inflation is expected to remain soft while retail sales are expected to post a modest rebound following a decline of 0.3% on both the core and headline retail sales figures.
EURUSD intraday analysis
EURUSD (1.1404): The EURUSD was a bit volatile as price attempted to rally but failed after posting an intraday high at 1.1455. Currently, on the 4-hour chart, we can see EURUSD posting modest gains to retrace the breakout level from the rising wedge pattern. A reversal could signal a continuation to the downside. Support at 1.1320 will be the initial downside target for the EURUSD. Given the bullish nature of the currency pair, the bearish bias will be invalidated if we see EURUSD breaking past the resistance level at 1.1444.
GBPUSD intraday analysis
GBPUSD (1.2956): The British pound is looking at extending the gains from the previous two days. Hawkish comments from BoE policy maker has put the currency pair biased to the upside. It is likely that GBPUSD will be testing the resistance level at 1.2970 which was tested in the early parts of July. A breakout above 1.2970 is required for GBPUSD to push higher. This would make it possible for the currency pair to test 1.3000 level once again. To the downside, if resistance is formed at 1.2970, then expect the downside to continue with price staying flat within 1.2970 and 1.2894
USDJPY intraday analysis
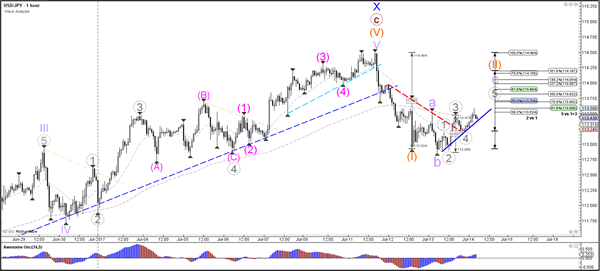
USDJPY (113.45): USDJPY closed with some modest gains yesterday. However, the upside could be limited towards 113.71 level. Only a convincing breakout above this level will signal further continuation to the upside. Therefore, it is quite likely for USDJPY to post a reversal near this resistance level in the short term. On the 4-hour chart price action is likely to stay range bound within the levels of 114.03 and 113.39. A lower high being formed at this level could signal a possible move to the downside. Also, note the potential head and shoulders pattern that is forming at this level. The current gains could see a right shoulder being formed while the neckline support is seen at 113.05.
Market Update – Asian Session: Asian Markets Generally Higher Ahead Of Key US Data
Asia Summary
Asian equity markets have generally traded with a slightly positive tone, in line with what was seen with US bourses. Trading has, however, been cautious ahead of upcoming US data (including CPI and retail sales) and bank corporate earnings (JPMorgan, Citigroup and Wells Fargo). In Japan, the Nikkei has underperformed the Topix index, as Fast Retailing has declined by over 4% amid its 9-month results and accompanying broker downgrades. Taiwan Semi has traded slightly lower amid weaker than expected Q2 results and some disappointment in the market regarding its outlook. Infosys has gained over 2% on better than expected quarterly results.
On the macroeconomic front, Singapore reported weaker than expected preliminary GDP figures for Q2. Overall, the country is the first major economy in Asia to report Q2 growth figures and China is expected to release its Q2 GDP data around Monday, July 17th.
Key economic data
(SG) SINGAPORE Q2 ADVANCED GDP Q/Q: 0.4% V 1.1%E; Y/Y: 2.5% V 2.7%E
(CN) CHINA JUNE FISCAL REVENUES CNY1.71T, +8.9% Y/Y; June Fiscal Expenditures CNY2.70T, +19.1% y/y
(JP) Bank of Japan (BoJ) announced planned bond purchases: To buy 3-5 year JGBs worth ¥330B v ¥330B prior
(NZ) NEW ZEALAND JUNE BUSINESS NZ MANUFACTURING PMI: 56.2 V 58.5 PRIOR
Speakers and Press
China
(CN) China Insurance Regulatory Commission (CIRC) vice chairman Chen Wenhui: insurance industry is facing a number of risks, ranging from liquidity pressure to reputational, insurers need to take precautions – Xinhua
(CN) Fitch: Liquidity and asset risk for life insurance companies in China are rising
Japan
(JP) Japan Finance Min Aso: Wants forward-looking extra budget to improve production and logistics in the agricultural sector; Will help domestic companies competing under the EU trade deal; Has not made decision on supplemental budget
(JP) Japan PM Abe: Will do 'utmost' to relieve concerns about the EU Economic Partnership Agreement (EPA)
Mexico
(MX) Mexico Central Bank Chief Carstens: Risks for the Peso include oil prices, relationship with US and 'surprises' from US monetary policy; reiterates first 6-9 months of 2018 Too Early for 'Cut Talks'
Philippines
(PH) S&P cuts Philippines 2017 GDP growth forecast to 6.4% from 6.6% - financial press
Asian Equity Indices/Futures (00:30ET)
Nikkei +0.1%, Hang Seng +0.1%, Shanghai Composite -0.2%, ASX200 +0.3%, Kospi +0.2%
Equity Futures: S&P500 flat; Nasdaq flat, Dax flat, FTSE100 flat
FX ranges/Commodities/Fixed Income (00:30ET)
EUR 1.1391-1.1411; JPY 113.27-113.57; AUD 0.7727-0.7746; NZD 0.7313-7329
Aug Gold flat at $1,216/oz, Aug Crude -0.22% at $45.98/bbl; Sept Copper +0.2% at $2.68/lb
(CN) PBOC SETS YUAN REFERENCE RATE AT 6.7774 V 6.7802 PRIOR
(CN) PBoC OMO: injects CNY100B in 7-day reverse repos at unchanged yields v skipped prior, did not announce a 14-day or 28-day reverse repo; During the prior session, the PBoC skipped its OMO and instead announced a CNY360B 1-year medium term lending facility (MLF) at 3.2%
(CN) FITCH AFFIRMS CHINA SOVEREIGN RATING AT A+; OUTLOOK STABLE; Ratings are underpinned by the strength of China's external finances and macroeconomic track record; Near-term growth prospects remain favorable.
(CN) China Finance Ministry (MOF) sells 3 and 6-month bills
The Aussie traded marginally higher, after gaining over 0.7% during the prior session amid the release of Chinese trade and iron ore imports data. USD/JPY saw little volatility, amid the BoJ’s uneventful bond purchase operation and ahead of the upcoming US data.
In fixed income, some Asian sovereign yields are slightly higher, following yesterday’s rebound in Treasury yields. Australia’s 3-year yield has risen by 2bps. Japan JGB yields are little changed, amid the BoJ’s bond purchase operation.
In China, the H1 local government debt avg yield rose by 82bps y/y to 3.85%, according to the Chinese press.
Various Japanese corporates issued bonds: Toyota’s Finance unit priced ¥40B in 4, 7 and 10-year bonds. Mizuho priced ¥460B in subordinated bonds in two tranches. Other issuers included Komatsu (¥50B in 3-year bonds).
Asia equities notable movers
Australia
Redflow Ltd, RFX.AU Announced strategic review and capital raise; -9.5%
Programmed Maintenance Services, PRG.AU A$791M takeover offer; +65%
Hong Kong
Angang Steel, 347.HK H1 guidance; +4%
China Candy Holdings, 8182.HK Takeover offer lapses; -52%
India
Infosys, INFO.IN Q1 results above estimates; +2.3% (pre-market)
Japan
Fast Retailing, 9983.JP Reported 9-month results; -4.5%
Taiwan
Taiwan Semi, 2330.TW Issued Q2 results and guidance; -0.2%
US Session Highlights
US markets on close: Dow +0.1%, S&P +0.2%, NASDAQ +0.2%; Russell +0.1%***
Upcoming US data in focus includes June Retail Sales, CPI and Industrial Production. July Prelim Michigan Consumer Sentiment to also be released.
Elliott Wave View: NIFTY
Short term NIFTY Elliott Wave view suggests the rally to 9709.3 ended Intermediate wave (1), and the pullback to 9449.06 low ended Intermediate wave (2). Rally from there could be unfolding as an Elliott wave Zigzag structure where Minor wave A is in progress as a Leading diagonal structure. Minute wave ((i)) ended as a double three Elliottwave structure at 9649.80 and Minute wave ((ii)) ended at 9596.30. Up from there Minute wave ((iii)) is unfolding as Elliott wave Triple three structure where Minutte wave (w) ended at 9700.7, Minutte wave (x) ended at 9642.65, Minutte wave (y) ended at 9830.05, second Minutte wave (x) ended at 9778.85 low, and Minutte (z) of ((iii)) is proposed complete at 9892.6.
Expect Index to pullback in Minute wave ((iv)) in 3, 7, or 11 swing to correct the cycle from 9595.50 low before the rally resumes higher again for 1 more leg in Minute wave ((v)) of A. Afterwards index should pullback in Minor wave B to correct the cycle from 9449.06 low in 3, 7 or 11 swing before another extension higher. We don't like selling the Index and expect buyers to appear after Minute wave B pullback is complete provided the pivot at 9449.06 low remains intact.
NIFTY 1 Hour Elliott Wave Chart
US Retail Sales Figures For June
Market Movers Today
Focus will be on US data with the release of the CPI inflation figure. We expect headline inflation to decline to 1.6% y/y in June from 1.9% y/y in May while core inflation is set to remain unchanged at 1.7% y/y. The Fed has recently had little focused on inflation being below target as it has strong belief in the Phillips curve i.e. the tight labour market should be enough to push wage growth and inflation higher eventually.
US retail sales figures for June are also due for release today. We expect a pick-up in the sales figure and growth of 0.3% m/m (control group) after it was flat on the month in May. In relation to this release the market will also keep an eye on latest consumer confidence data from University of Michigan to gauge consumer sentiment.
The oil market will look to the weekly US oil rig count for signs that US oil producers are responding negatively to recent slide in oil prices.
Selected Market News
It was reported yesterday that ECB president Mario Draghi may be speaking at the Jackson Hole conference on monetary policy in August. Last time he spoke at the conference was in 2014 – a speech that since has been regarded as the first step towards the ECB's bond purchase programme which started in 2015. Hence, the market immediately started to speculate whether he will use the opportunity this time to signal an end to bond purchases ahead of the ECB meeting in September. The news was sufficient to counter the move lower in EUR/USD which followed comments from the ECB's Rimsevics about the ECB maintaining a large balance sheet for 'a few years'.
The second day of Fed Chairwoman Janet Yellen's testimony before congress did not reveal any new hints on monetary policy. She expressed scepticism on the question of whether President Trump's 3% growth objective was achievable. She also acknowledged the theory of whether excessive use of opioids among prime-age workers had contributed to falling labour participations. Overall, the market did move on second leg of her testimony.
In commodity markets, the aluminium market stood out yesterday as prices jumped as much as 2.9%. The aluminium market balance has been in deficit throughout 2017 and news that China may cut back production added to concerns the market will continue to stay tight. Wheat prices continued to fall back yesterday, as fears of lower supply out of the US harvest eased further.
Daily Technical Analysis: USD/JPY Builds Potential Head And Shoulders Reversal Chart Pattern
Currency pair USD/JPY
The USD/JPY broke back above the resistance trend line (dotted red) and could be retracing within a wave 2 (orange). The structure is valid unless price manages to break above the 100% level, which would invalidate the wave 2 and potential reversal for a new downtrend. There is also a potential for a head and shoulders reversal chart pattern (purple boxes) if price were to reverse around the 50-61.8% Fibonacci resistance level. A break below the neck support line (green) would then confirm the development of the chart pattern.
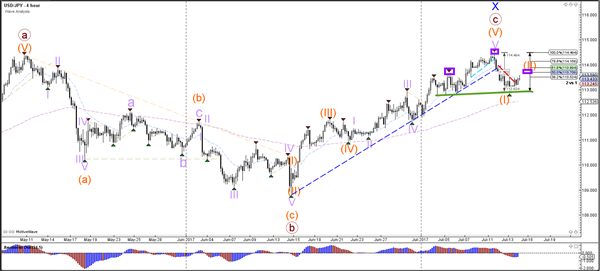
The USD/JPY indeed bounced at the previous bottom to complete a wave b (purple) correction as mentioned in yesterday's analysis. The bullish bounce seems to be unfolding in 5 waves (grey) within a wave c (purple).
Currency pair EUR/USD
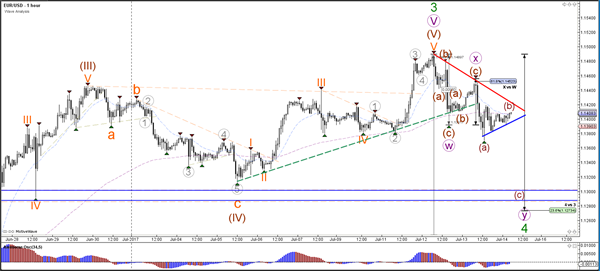
The EUR/USD has extended the bearish correction as mentioned in yesterday's analysis. This increases the chance of a larger bearish retracement within wave 4 (green) towards the Fibonacci retracement levels of wave 4 vs 3. A break above the current top at 1.1490, however, indicates a likely uptrend continuation and invalidates a larger correction within wave 4.
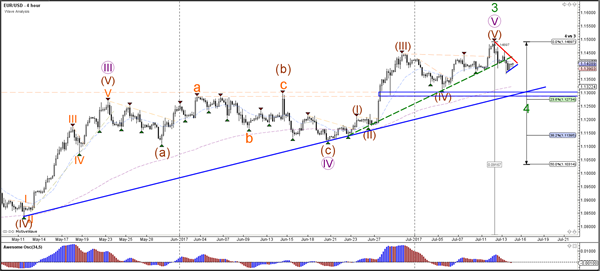
The EUR/USD completed the ABC (brown) and bounced at resistance trend line (red) and the 61.8% Fibonacci resistance level at 1.1450. A break below the support trend line (blue) could see a continuation wave c (brown) whereas a break above resistance (red) could expand the wave b (brown) correction.
Currency pair GBP/USD
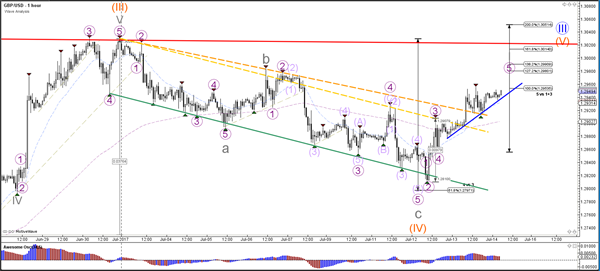
The GBP/USD broke above the resistance trend line (dotted yellow) which could spark the start of wave 5 (orange). The Cable will however still need to break above the larger resistance trend line (red) before an uptrend has more space to develop.
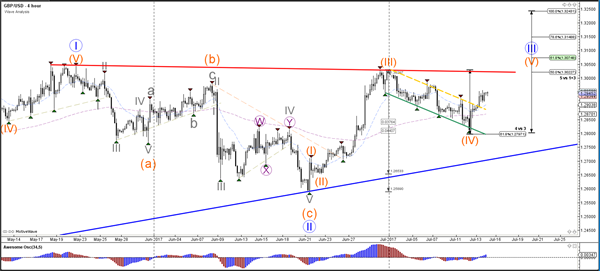
The GBP/USD could be building a 5 wave (purple) within a wave 1 (grey) of wave 5 (orange). Once price reaches the resistance (red) and targets of wave 5, price might make a retracement for a wave 2 before continuing the uptrend. The invalidation level is at the current bottom at around 1.2810.
Daily Technical Outlook And Review: EUR/USD, GBP/USD, AUD/USD, USD/JPY, USD/CAD, USD/CHF, DOW 30, GOLD
A note on lower timeframe confirming price action...
Waiting for lower timeframe confirmation is our main tool to confirm strength within higher timeframe zones, and has really been the key to our trading success. It takes a little time to understand the subtle nuances, however, as each trade is never the same, but once you master the rhythm so to speak, you will be saved from countless unnecessary losing trades. The following is a list of what we look for:
- A break/retest of supply or demand dependent on which way you're trading.
- A trendline break/retest.
- Buying/selling tails ... essentially we look for a cluster of very obvious spikes off of lower timeframe support and resistance levels within the higher timeframe zone.
- Candlestick patterns. We tend to only stick with pin bars and engulfing bars as these have proven to be the most effective.
We typically search for lower-timeframe confirmation between the M15 and H1 timeframes, since most of our higher-timeframe areas begin with the H4. Stops are usually placed 1-3 pips beyond confirming structures.
EUR/USD
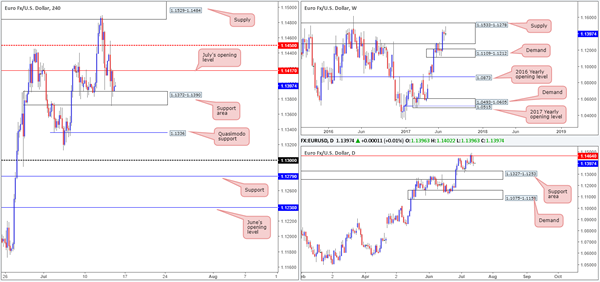
Despite the single currency clocking a session high of 1.1455 on Thursday, price ended the day challenging the H4 support area seen below at 1.1372-1.1390. While this zone is seen holding ground right now, we believe the odds of price breaching this area is high. Our reasoning lies within the higher-timeframe structures. Weekly price remains loitering within the walls of a major supply drawn from 1.1533-1.1278 (that has capped upside since May 2015), and appears to be on course to print a strong-looking selling wick. In addition to this, we can also see daily action showing room to trade down to at least the support area coming in at 1.1327-1.1253.
For those who have been following recent reports on the EUR/USD you may recall that our desk is currently short from 1.1484. 50% of the position has already been liquidated around July’s opening level at 1.1417 and the stop-loss order is now located at breakeven.
Our suggestions: The final take-profit level for our trade is set at the H4 Quasimodo support pegged from 1.1336, positioned just nine pips above the top edge of the aforementioned daily support area.
Although we feel the current H4 support area is vulnerable, trying to join the sellers at current price is still considered risky since we can never really know how many active buyers reside here. Therefore, other than the short trade currently in play, we do not see much else to hang our hat on at the moment.
Data points to consider: French banks will be closed in observance of National Day. US Inflation and Retail sales figures scheduled to be released at 1.30pm. FOMC member Kaplan speaks at 2.30pm GMT+1.
Levels to watch/live orders:
- Buys: Flat (stop loss: N/A).
- Sells: 1.1484 (stop loss: breakeven).
GBP/USD
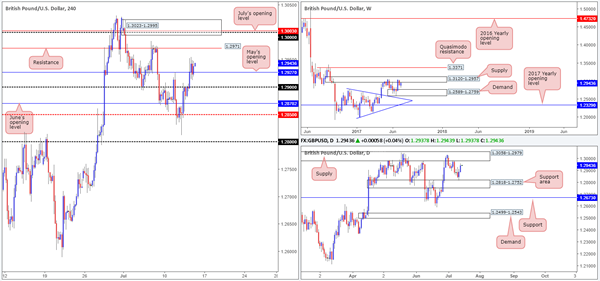
Pound sterling advanced north for a second consecutive day on Thursday, reaching a high of 1.2954. As a result of this, the weekly timeframe shows price to be revisiting the underside of supply at 1.3120-1.2957. What’s also notable is that daily action is seen trading within touching distance of supply coming in at 1.3058-1.2979, which happens to be positioned within the said weekly supply.
Sweeping across to the H4 candles, the major is currently seen bid above May’s opening level at 1.2927. Should the bulls remain dominant, the next upside target from here is a H4 resistance at 1.2971, followed closely by the large psychological line at 1.30, July’s opening level at 1.3003 and a H4 supply at 1.3023-1.2995.
Our suggestions: The only area our desk has expressed interest in this morning is the H4 supply mentioned above at 1.3023-1.2995. Not only because of its surrounding H4 confluence, but also due to it being positioned within both of the above said weekly and daily supply areas!
As we are currently short the EUR/USD, we will probably pass on this setup. However, if we had no active positions, this would be an area we’d sell using a pending order at 1.30, with a stop placed above at 1.3025.
Data points to consider: US Inflation and Retail sales figures scheduled to be released at 1.30pm. FOMC member Kaplan speaks at 2.30pm GMT+1.
Levels to watch/live orders:
- Buys: Flat (stop loss: N/A).
- Sells: 1.3023-1.2995 (sells from here do not require additional confirmation).
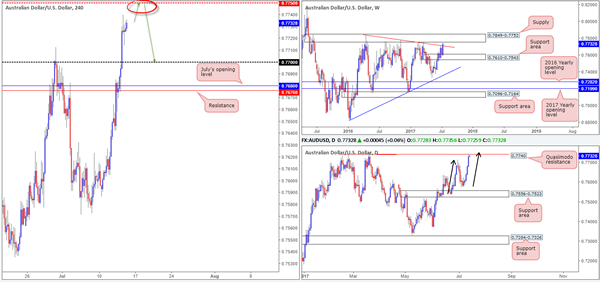
AUD/USD
Coming in from the top this morning, we can see that weekly price is trading marginally above the trendline resistance drawn from the high 0.7835, and is now positioned within striking distance of a supply area at 0.7849-0.7752. Daily price on the other hand, is seen responding to a Quasimodo resistance marked at 0.7740. The interesting thing here is that not only is this Quasimodo level planted 12 pips below the said weekly supply, it also converges extremely close with an AB=CD formation (black arrows).
A closer look at price action on the H4 chart shows the commodity currency to be on course to challenge 0.7750. By itself, this number has extraordinary historical significance as a resistance, thus likely being a level traders are going to be watching this morning.
Our suggestions: Put simply, the team believes that 0.7750 will hold the Aussie lower. In regard to stop-loss placement, we would likely position it above the high formed back on the 8th Nov 2016 at 0.7778. The first take-profit level would, for us at least, be the 0.77 vicinity.
Data points to consider: US Inflation and Retail sales figures scheduled to be released at 1.30pm. FOMC member Kaplan speaks at 2.30pm GMT+1.
Levels to watch/live orders:
- Buys: Flat (stop loss: N/A).
- Sells: 0.7750 region (stop loss: 0.7780).
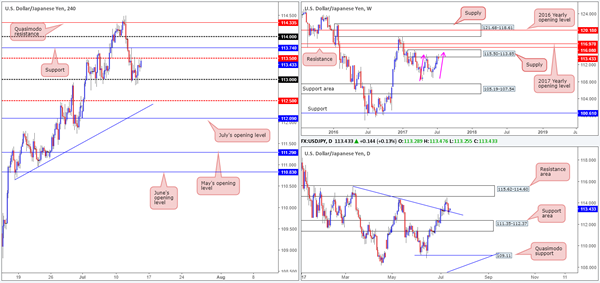
USD/JPY
The USD/JPY, as you can see, is currently underpinned by a psychological level at 113. Alongside this, however, we can also see the overhead H4 mid-level resistance at 113.50 is putting up a good fight!
As highlighted in Thursday’s report, this market is a tricky beast to trade at the moment. On the one hand, we have weekly action suggesting that further selling may be on the cards from the supply zone at 115.50-113.85, while on the other hand daily price is seen trading from a trendline support etched from the high 115.50.
While we do believe the weekly sellers will eventually force the unit lower, it is just too much of a risk to sell right now when daily price is challenging a trendline support.
Our suggestions: On account of the above, we’ll remain flat into the weekend.
Data points to consider: US Inflation and Retail sales figures scheduled to be released at 1.30pm. FOMC member Kaplan speaks at 2.30pm GMT+1.
Levels to watch/live orders:
- Buys: Flat (stop loss: N/A).
- Sells: Flat (stop loss: N/A).
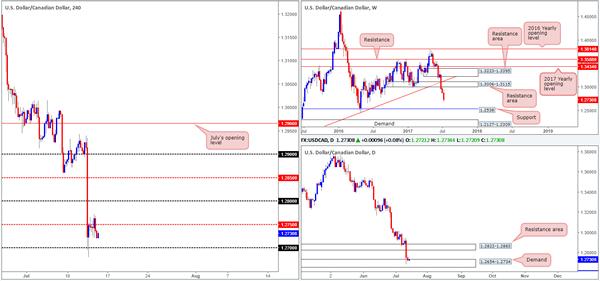
USD/CAD
The USD/CAD took on more of a sober approach yesterday in comparison to Wednesday’s aggressive move south. H4 price remains afloat above the 1.27 handle, but has failed to generate much follow through momentum beyond the nearby mid-level resistance line at 1.2750. Consequent to yesterday’s rather lackluster performance, much of the following report will echo thoughts put forward in Thursday’s analysis.
The weekly technicals show space to continue pressing south all the way down to support coming in at 1.2538. While this sounds great, it might be worth noting that weekly sellers have to contend with not only a daily demand base at 1.2654-1.2734, but also a daily Quasimodo support level seen just below it at 1.2592 (not seen on the screen).
Our suggestions: Watch for a decisive H4 close beyond the 1.27 handle. This would, in our view, signal seller strength on the weekly chart and buyer weakness within the current daily demand, and therefore potentially open up the possibility for a sell trade on any retest seen at 1.27.
Data points to consider: US Inflation and Retail sales figures scheduled to be released at 1.30pm. FOMC member Kaplan speaks at 2.30pm GMT+1.
Levels to watch/live orders:
- Buys: Flat (Stop loss: N/A).
- Sells: Watch for H4 price to engulf the 1.27 handle and then look to trade any retest seen thereafter ([waiting for a H4 bearish candle – preferably in the form of a full, or near-full-bodied candle – to form following the retest is advised] stop loss: ideally beyond the candle’s wick).
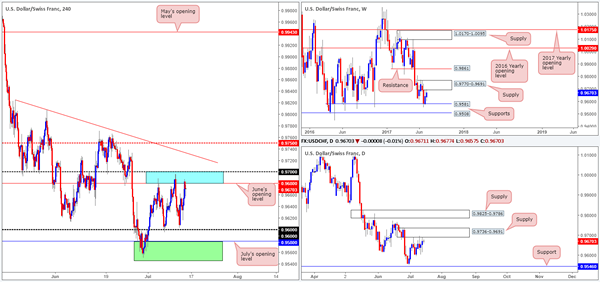
USD/CHF
As can be seen from the H4 chart this morning, price remains consolidating between 0.97/0.9680 (round number/June’s opening level – blue zone) and the 0.96 handle, and has been since the 5th May. In Thursday’s report, we noted that it’s difficult to judge which way this range will eventually break. This is because on the weekly chart, price is also seen loitering between a supply at 0.9770-0.9691 and a support formed at 0.9581.
With this in mind, we remain interested in the two following zones for potential trades:
The first is the blue resistance zone mentioned above at 0.97/0.9680, which is being retested as we write. We’ve selected this area since not only is this barrier lodged around the underside of the said weekly supply, but there’s also a partner supply seen on the daily timeframe at 0.9736-0.9691 that’s in play.
The second zone is a support area marked in green comprised of a daily support at 0.9546 and the weekly support at 0.9581, which also happens to converge closely with July’s opening level at 0.9580.
Our suggestions: To initiate a trade at either of the above noted zones, nevertheless, we would require H4 candle confirmation, preferably in the shape of a full, or near-full-bodied candle. This is just a way to confirm that there are other speculators interested in the same zone as we are!
Data points to consider: US Inflation and Retail sales figures scheduled to be released at 1.30pm. FOMC member Kaplan speaks at 2.30pm GMT+1.
Levels to watch/live orders:
- Buys: 0.9546/0.9581 ([waiting for a H4 bull candle – preferably a full, or near full-bodied candle – to form is advised] stop loss: ideally beyond the candle’s tail).
- Sells: 0.97/0.9680 ([waiting for a H4 bear candle – preferably a full, or near full-bodied candle – to form is advised] stop loss: ideally beyond the candle’s wick).
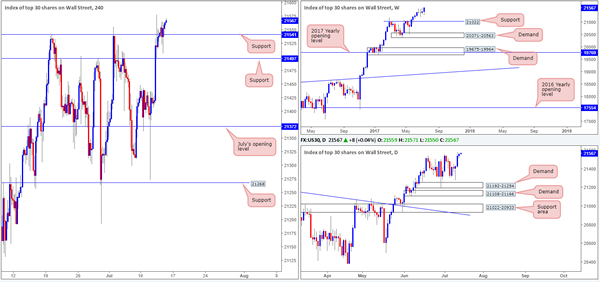
DOW 30
In recent trading, the H4 candles closed above resistance at 21541, and aggressively tested the line as support. This, for our team at least, signals further upside is likely on the cards today and possibly into next week.
Initially, we were looking to trade long on any retest seen at 21541, following a break higher. However, given that the retest of this level was so violent and deep, we refrained from buying this market.
Overhead, there is absolutely no resistance seen on either the H4, daily or weekly timeframes. To that end, should we see H4 price retest 21541 again today, and hold firm, we would have no hesitation in pulling the trigger this time.
Our suggestions: Should the above scenario come to fruition, our desk has noted that they would look to trail the position, in the hope of joining the rather steep uptrend the DOW is currently entrenched within right now (see weekly chart).
Data points to consider: US Inflation and Retail sales figures scheduled to be released at 1.30pm. FOMC member Kaplan speaks at 2.30pm GMT+1.
Levels to watch/live orders:
- Buys: 21541 ([waiting for a H4 bull candle – preferably a full, or near full-bodied candle – to form is advised] stop loss: ideally beyond the candle’s tail).
- Sells: Flat (stop loss: N/A).
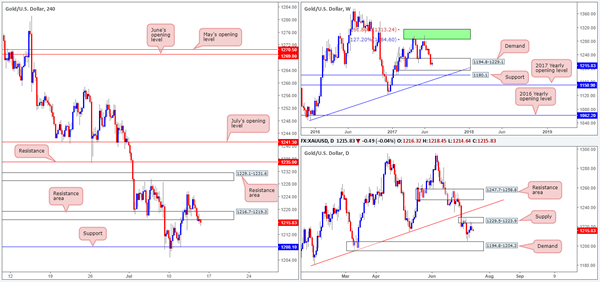
GOLD
Despite seeing weekly price trading within demand at 1194.8-1229.1 right now, the daily supply area at 1229.5-1223.9 is doing a superb job in holding the candles lower. In conjunction with this daily zone, we can also see that H4 price is trading back below the support area drawn from 1216.7-1219.3.
With both daily and H4 structure signaling potential weakness within the current weekly demand, our desk is reluctant to take any long positions in this market. With that being the case, we feel there’s a strong possibility that H4 flow may drive lower and reconnect with support at 1208.1 again.
Our suggestions: Given current structure, we are not keen to get involved with this market today. Therefore, we’re going to remain flat and reassess structure going into Monday’s session.
Levels to watch/live orders:
- Buys: Flat (stop loss: N/A).
- Sells: Flat (stop loss: N/A).
European Open Briefing: Markets Remained Relatively Quiet Ahead Of Today’s US CPI Release
Global Markets:
- Asian stock markets: Nikkei up 0.10%, Shanghai Composite lost 0.10%, Hang Seng gained 0.15%, ASX 200 rose 0.30%
- Commodities: WTI Oil at $46 (0.20%), Brent Oil at $48.35 (0.20%), Gold at $1216 (-0.20%), Gold at $1216 (-0.10%), Silver at $15.60 (-0.40%)
- Rates: US 10 year yield at 2.36, UK 10 year yield at 1.30, German 10 year yield at 0.60
News & Data:
- Japan Capacity Utilization (M/M) May: -4.10% (Prev 4.30%)
- Japan Industrial Production (M/M) May F: -3.60% (Prev -3.30%)
- Japan Industrial Production (Y/Y) May F: 6.50% (Prev 6.80%)
- New Zealand Business Manufacturing PMI: 56.2 (Rev Prev 58.2)
- PBoC Fixes USDCNY Reference Rate At 6.7774 (Prev 6.7802)
Markets Update:
Markets remained relatively quiet ahead of today's US CPI release. Recent US inflation data has been rather weak, so today's numbers will be important and could determine the short-term direction of the US Dollar.
Commodity currencies are performing well. The Australian Dollar broke above a major resistance level at 0.7730, which signals that it could test 0.7850 soon. The New Zealand Dollar also caught a bid and rallied back above 0.73. Meanwhile, a rise in oil prices is giving the Canadian Dollar additional support. USDCAD is moving back towards 1.27. The charts suggest the pair could test 1.25 in the near-term.
EURUSD retraced a bit yesterday, but demand below 1.14 proved to be strong. Further gains are likely. Should US data disappoint today, the Euro should have no difficulties clearing the resistance at 1.15.
Upcoming Events:
- 10:00 BST – Euro Zone Trade Balance
- 13:30 BST – US CPI
- 13:30 BST – US Retail Sales
- 14:15 BST – US Industrial Production
- 15:00 BST – US Michigan Consumer Sentiment
Daily Technical Analysis: EURUSD, GBPUSD, USDJPY, USDCHF
EURUSD
The EURUSD was indecisive yesterday. The bias is neutral in nearest term probably with a little bearish bias but overall I remain bullish and any downside pullback should be seen as a good opportunity to buy. We have an interesting fact as you can see on my H4 chart below, where the H4 EMA 200 provides a valid and strong support during the bullish run, a good place to buy this pair, located around 1.1285 area. Immediate resistance is seen around 1.1455. A clear break above that area could trigger further bullish pressure testing 1.1500 – 1.1530 or higher. On the downside, a clear break and daily/weekly close below 1.1285 would interrupt the bullish outlook.
GBPUSD
The GBPUSD had a bullish momentum yesterday broke above 1.2925 resistance after bounced-off the daily EMA 200 as you can see on my daily chart below. This fact cancels the bearish pin bar scenario. The bias is bullish in nearest term testing 1.3000 – 1.3050 resistance area which remains a good place to sell with a tight stop loss above 1.3050. Immediate support is seen around 1.2900. A clear break below that area could lead price to neutral zone in nearest term as direction would become unclear testing 1.2850/15 region. Overall I remain neutral.
USDJPY
The USDJPY attempted to push lower yesterday bottomed at 112.86 but closed higher at 113.28 and hit 113.57 earlier today in Asian session. We have a bullish pin bar near 112.75 support area as you can see on my daily chart below suggests that price is probably ready to continue its bullish run after corrected lower from 114.50 on Tuesday. The bias is bullish in nearest term testing 114.00 – 114.50 region. On the downside, a clear break and daily/weekly close below 112.75 would activate my neutral mode with a short-term bearish bias.
USDCHF
The USDCHF was indecisive yesterday. The bias remains neutral in nearest term. Price has been moving sideways without clear direction this week and now struggling around 0.9675 resistance area as you can see on my daily chart below. Immediate resistance is seen around 0.9696. A clear break above that area would expose 0.9765 resistance area. Immediate support is seen around 0.9600 but key support remains between 0.9550 – 0.9450 region which remains a good place to buy with a tight stop loss below 0.9450.
Aussie Trading A Tad Higher In The Asian Session
For the 24 hours to 23:00 GMT, the AUD rose 0.72% against the USD and closed at 0.7732.
LME Copper prices rose 0.3% or $19.5/MT to $5902.0/MT. Aluminium prices rose 1.8% or $34.0/MT to $1911.0/MT.
In the Asian session, at GMT0300, the pair is trading at 0.7736, with the AUD trading marginally higher against the USD from yesterday's close.
The pair is expected to find support at 0.7694, and a fall through could take it to the next support level of 0.7652. The pair is expected to find its first resistance at 0.7762, and a rise through could take it to the next resistance level of 0.7788.
Next week, market participants will focus on the Reserve Bank of Australia's July meeting minutes accompanied with Australia's labour market report.
The currency pair is showing convergence with its 20 Hr moving average and trading above its 50 Hr moving average.

German Annual Inflation Advanced As Initially Estimated In June
For the 24 hours to 23:00 GMT, the EUR declined 0.16% against the USD and closed at 1.1397.
In economic news, Germany's final consumer price index (CPI) rose 1.6% on an annual basis in June, confirming the flash estimate. The CPI had advanced 1.5% in the previous month.
In the US, data showed that the number of Americans filing for fresh jobless claims eased to a level of 247.0K in the week ended 08 July, dropping for the first time in a month, suggesting that the nation's labour market remains buoyant. In the previous week, initial jobless claims had registered a revised reading of 250.0K, while markets were anticipating for a fall to a level of 245.0K. Additionally, the nation's producer price index (PPI) advanced 2.0% on an annual basis in June, surpassing market consensus for a rise of 1.9%. The PPI had registered a rise of 2.4% in the prior month.
On the other hand, the nation's budget deficit widened more-than-expected to a level of $90.2 billion in June, compared to market expectations of a deficit of $38.0 billion. In the previous month, the nation had registered a budget deficit of $6.3 billion.
In the Asian session, at GMT0300, the pair is trading at 1.1408, with the EUR trading 0.1% higher against the USD from yesterday's close.
The pair is expected to find support at 1.1367, and a fall through could take it to the next support level of 1.1327. The pair is expected to find its first resistance at 1.1452, and a rise through could take it to the next resistance level of 1.1497.
Going ahead, investors will look forward to the Euro-zone's trade balance figures for May, slated to release in a few hours. Moreover, traders would closely monitor a slew of crucial economic releases in the US, consisting of the consumer price index, advance retail sales, industrial and manufacturing production, all for June followed by the flash Michigan consumer confidence index for July, all scheduled to release later today.
The currency pair is showing convergence with its 20 Hr moving average and trading below its 50 Hr moving average
