Sample Category Title
USDJPY: Remains Bearish With Eyes On More Downside Pressure
USDJPY: The pair continues to retain its downside pressure on correction. On the downside, support comes in at the 113.00 level where a break if seen will aim at the 112.50 level. A cut through here will turn focus to the 112.00 level and possibly lower towards the 111.50 level. Its daily RSI bearish and pointing lower supporting this view. On the upside, resistance resides at the 113.50 level. Further out, we envisage a possible move towards the 114.00 level. Further out, resistance resides at the 114.50 level with a turn above here aiming at the 115.00 level. On the whole, USDJPY looks to pullback on price rejection.
Markets Bracing for Second Round of Yellen’s Testimony
Equity bulls received a shot in the arm while the Dollar was under pressure after Janet Yellen caught markets unaware by striking a dovish tone in her congressional testimony on Wednesday. Although Yellen reiterated the Federal Reserve's game plan to continue gradually tightening monetary policy, the lack of commitment to a hiking timeline and tone of caution, prompted investors to offload the Greenback. A key take away from the first round of the testimony was concerns raised over softening inflation, which may encourage market participants to re-evaluate the pace of monetary tightening this year.
With no fresh clues offered on the timings and magnitude of the balance sheet reduction on Wednesday, markets will closely scrutinize Yellen's second appearance today for clarity. If doves make an appearance once again and nothing new is brought to the table, the Dollar is likely to find itself under renewed selling pressure, as traders reduce their bets on an additional interest rate hike this year.
Sterling rescued by a BoE hawk
Sterling bulls were offered a helping hand during Thursday's trading session, as hawkish comments from BoE policy maker Ian McCafferty supported bets for higher UK interest rates. McCafferty was one of the hawks who voted for an interest rate increase last month and suggested that the central bank should consider unwinding its £435billion Quantitative Easing programme earlier than planned. Although the weak Dollar played a part in the GBPUSD's impressive appreciation on Thursday, price action suggests that Sterling is becoming increasingly sensitive to monetary policy expectations.
While speculations of the Bank of England tightening monetary policy may support prices in the short term, the fundamentals pressuring Sterling still remain intact. With Brexit uncertainty deteriorating economic fundamentals and political risk all weighing heavily on the British Pound, further downside may be on the cards. From a technical standpoint, the GBPUSD remains in a wide range on the daily charts. Bears still have some level of control below the tough 1.3000 resistance.
Commodity spotlight - Gold
Gold prices edged higher on Wednesday after Fed Chair Janet Yellen adopted a dovish stance in testimony before Congress. A vulnerable Dollar complimented the metals upside with prices hovering around $1220 at the time of writing. With Yellen's tone of caution prompting investors to trim their bets on another US rate increase this year, Gold, which is zero-yielding, was offered a lifeline. Although the metal remains heavily pressured on the daily charts, bulls could be given an opportunity to shine if Yellen doubles down on Wednesday's dovish remarks when she appears before Congress this afternoon. From a technical standpoint, repeated weakness below the $1240 resistance is likely to encourage a further decline back towards $1200.
CAC Slightly Higher, French Inflation Remains Listless
The CAC index has posted small gains in the Thursday session. Currently, the index is currently trading at 5247.30 and is up 0.49% on the day. In economic news, it's a quiet day. French Final CPI came in at a flat 0.0%, unchanged from the previous reading. Federal Reserve Chair Janet Yellen will testify before the Senate Banking Committee. On Friday, the eurozone releases Trade Balance, which is expected to show a surplus of EUR 20.3 billion. The US will publish CPI and retail sales reports.
Donald Trump is back in Europe, this time to visit France and take in Bastille Day with French President Emmanuel Macron. The new French President has started off his relationship with the unpredictable Trump on a solid footing, and Macron is eager to make France an important player on the global stage. The French government is also eager to take advantage of Britain's departure from the European Union. With large companies such as Deutsche Bank relocating their operations from London, France is making efforts to lure lucrative financial sector jobs which are leaving London. Earlier in the week, Prime Minister Edouard Philippe told a banking conference in Paris that he wants the city to become Europe's main financial hub after Brexit. This will be a tall order, as Frankfurt will likely be the most attractive choice for many large companies. Still, Philippe's comments underscore that France is looking for a bigger role on the international scene, and Brexit represents a unique political and economic opportunity for the French.
The Trump show is again on center stage in Washington, with more revelations about alleged secret ties between Russia and the Trump administration during the US election. This week's breaking news is that Donald Trump Jr. admitted that a Russian official contacted him and offered to provide him with evidence incriminating Hillary Clinton. Trump and the White House are trying to lower the flames and put a positive spin on the meeting, but the media and lawmakers (including Republicans) aren't about to let Trump off the hook. This crisis is just the latest miscue for the Trump administration, which hasn't been able to pass any significant laws through Congress, even though Republicans control both the House of Representatives and the Senate. The latest dark cloud over the White House has dampened investor confidence in the US economy, and European stock markets could take advantage of the latest political scandal in the US.
DAX Ticks Upwards As German CPI Matches Forecast
The DAX index has posted small gains in the Thursday session, as the index is up 0.26% on the day. Currently, the DAX is at 12,654.00. On the release front, German Final CPI improved to 0.2%, matching the estimate. In the US, it's a second day of testimony from Fed Chair Janet Yellen, who will speak before the Senate Banking Committee. On Friday, the eurozone releases Trade Balance, which is expected to show a surplus of EUR 20.3 billion. The US will publish CPI and retail sales reports.
The eurozone continues to struggle with low inflation, and although Germany's economy is in good shape, it has not been immune to chronically weak inflation levels. German Final CPI, a key gauge of consumer spending, improved to 0.2% in June, compared to -0.2% in May. CPI has managed just one reading above 0.2% in 2017, and earlier in the week, WPI came in at 0.0%, rebounding from a decline of 0.7% a month earlier. The ECB has set an inflation target of 2%, but German and eurozone inflation numbers remain well below that threshold. Although the eurozone economy has shown some improvement, there is no indication that inflation levels will move higher anytime soon, so we're unlikely to see the cautious ECB taper its aggressive stimulus package in the coming months.
Janet Yellen's testimony in front of a congressional committee was largely a non-event, as Yellen opted to repeat what we've been hearing from other Fed policy makers. Yellen reiterated that the Fed planned to raise rates “gradually”, and added that the Fed would begin trimming its balance sheet before the end of the year. The Fed chair was careful not to provide any timelines, but many analysts are circling September for a balance sheet reduction, with a rate hike to follow in December. However, despite Yellen's assurances, the markets remain lukewarm about a rate hike before the end of the year. Investors are concerned that the US economy has slowed down in 2017 and that inflation levels have not improved, despite the Fed arguing that the factors weighing on inflation are temporary. The CME Group has pegged a December rate increase at just 47%, while other forecasts are pointing to odds as low as 40%. Hints from the Fed will not suffice to bring investors on board – unless growth and inflation numbers move higher, the markets are likely to remain lukewarm about the likelihood of a third rate hike in 2017.
As if the markets don't have enough to worry about, the Trump administration's alleged ties with Russia are once again front-page news. This week, Washington is abuzz that Donald Trump Jr. admitted that a Russian official contacted him and offered to provide him with evidence incriminating Hillary Clinton. Predictably, the White House has attacked the media and is trying to distance itself from Trump Jr.'s meeting, but the miscue is one more example of the White House having to shift to damage control mode, rather than focus on its agenda. Trump hasn't been able to pass health care or other legislation through Congress, even though Republicans control both the House of Representatives and the Senate. The latest dark cloud over the White House has dampened investor confidence, and it's a safe bet that this latest crisis is not the last.
Rate Differentials Pack A High Yielding Punch
Thursday July 13: Five things the markets are talking about
As expected, Central Bank action and rhetoric is keeping capital markets on their toes.
In her testimony to Congress yesterday, Fed chair Yellen said that there is no rush to tighten monetary policy as inflation remains consistently 'below' target.
The Fed expects the U.S economy to continue to develop in the current direction, which will grant policy makers' room for 'gradual' rate hikes and that reduction in the balance sheet is likely to begin this year.
The market interpreted her comments as ‘less hawkish' - this has allowed U.S Treasuries to rally, the dollar to underperform vs. G10, and U.S equities to print fresh record highs.
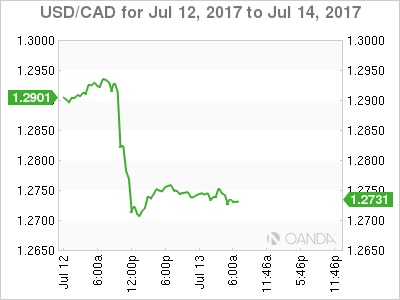
Her counterpart at the Bank of Canada (BoC), Governor Poloz raised interest rates by +0.25% to +0.75% as widely expected, the loonie, however, gained +1.5% outright to record a new yearly high (C$1.2695) as his statement and comments were perceived as being more ‘hawkish.'
The Governor cited 'robust' economic activity that's led to a 'significant amount' of economic slack disappearing. It now expects the output gap to fully close before the end of 2017, versus a previous forecast of during H1 2018.
As for future rate moves, BoC said adjustments to be guided by data-which has been strong of late-although adding it will keep in mind continued uncertainty posed by the Trump administration's trade policy, and issues related to record levels of household debt and frothy real estate.
1. Stocks get a boost from dovish comments
U.S stocks took heart from Ms. Yellen's speech indicating a slower rate of hikes, as stocks across the board rallied with the Dow reaching a new all-time high and close.
In Japan, equities ended flat overnight, as gains in tech shares offset weakness in financial stocks after U.S yields slipped. The Nikkei closed +0.01% higher, while the broader Topix ended down -0.01%.
In Hong Kong, the Hang Seng Index climbed +1.1% to its highest level in two-years.
In China, stocks also firmed, with the blue-chip index closing at an 18-month high, supported by solid trade data. The blue-chip CSI300 index rose +0.8%, while the Shanghai Composite Index gained +0.6%.
Note: China exports rose +11.3% in June y/y, while imports expanded +17.2%, which suggests their economy is holding up, supported by global demand.
Elsewhere, Australia's S&P/ASX 200 Index strengthened +1.1% on the back of China's data, while in South Korea the Kospi rallied +0.7% when the Bank of Korea (BoK) held steady its benchmark rate, as expected.
In Europe, indices opened flat, but have moved higher ahead of the U.S open. Ms. Yellen is to continue speaking today and attention is also turning to the first reports of earning season.
U.S stocks are set to open in the black (+0.2%).
Indices: Stoxx50 +0.5% at 3,539, FTSE +0.1% at 7,424, DAX +0.4% at 12,678, CAC-40 +0.7% at 5,259, IBEX-35 +1.0% at 10,671, FTSE MIB +0.4% at 21,524, SMI +0.4% at 9,049, S&P futures +0.2%
2. OPEC compliance with oil cuts falls to 6-month low, gold stable
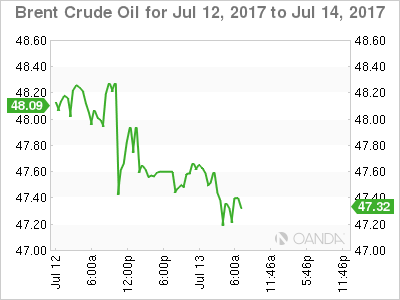
Oil prices are again under pressure on worries about oversupply as the IEA this morning warned that a long-awaited market rebalancing could be delayed due to weak compliance with production cuts among OPEC members.
In its monthly report the IEA has issued a stronger outlook for global oil demand, however, with consumption in Germany and the United States increasing in recent months.
The report also noted a dramatic recovery in oil production from Libya and Nigeria and a lower rate of compliance by OPEC with its own output agreement.
Brent crude fell -34c to +$47.40 a barrel, while U.S light crude (WTI) is down -32c at +$45.17.
Note: Oil prices have dropped recently to levels not seen in 18-months as the market loses faith in a deal between OPEC and non-OPEC producers to reduce output, while U.S. shale oil production rises.
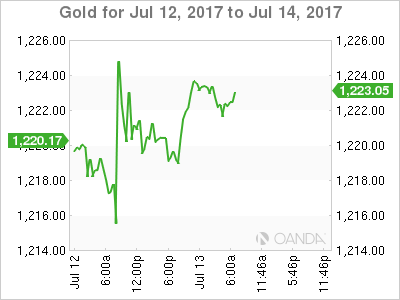
Gold prices (+0.2% to +$1,222.99 an ounce, a fourth day of gains) are holding steady ahead of the U.S open, as the Fed seems set to only gradually tighten monetary policy, curbing speculation that interest rates would rise more than once this year.
3. Yields fall on Yellen's comments
Similar to equities, bond prices have got a lift as the Fed's Yellen sounded caution on inflation.
Prior to Yellen's comments yesterday, global yields had been backing up, spooked by what seemed a collusion effort by top central banks about tightening monetary policy.
Fed fund futures are now only pricing a 50-50 chance of a rise by December.
U.S Treasuries have rallied in reaction, clawing back a third of their selloff with yields on two-year notes falling to three-week lows, while U.S 10's is down another -1 bps overnight at +2.32%.
Germany's benchmark 10-year Bund yield is flat, trading atop of its psychological +0.5% and has now given back a quarter of the rise triggered by last month's hint from ECB's Draghi that it was readying to scale back stimulus.
Elsewhere, the yield on Aussie 10-year notes has dropped -3 bps to +2.69%.
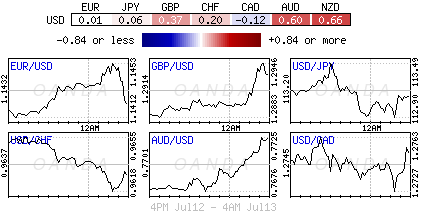
4. Dollar underperforms across the board
The ‘mighty' dollar has fallen broadly after Ms. Yellen's comments were perceived as 'dovish' and potentially dampening the outlook for future interest rate rises.
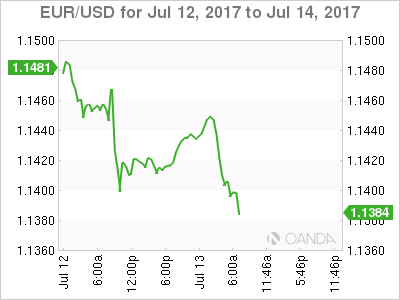
Currently, the EUR trades up +0.2% at €1.1423, while sterling is up +0.3% at £1.2928 and the loonie is holding steady at C$1.2732 after gaining +1.5% intraday yesterday. There was a lot of interest from Europe to own CAD on the crosses, especially against EUR (€1.4516) and GBP (£1.6446).
Higher-yielding currencies have been the strongest performers, as carry traders return to take advantage of the rate differential however, with the AUD rising +0.6% to a 16-week peak of A$0.7728 and the NZD up +0.75% at NZ$0.7340. Also supporting the antipodeans is the stronger than expected Chinese trade data showing strong imports.
5. Germany's June inflation numbers
Data this morning from Germany's statistics office confirmed last month's inflation figures - prices grew by +0.2% m/m and +1.6% on the year.
Note: In harmonized European terms, the price gain was +0.2% and +1.5% respectively.
Digging deeper, the data showed that energy prices were stable year-to-date in national terms, while food prices were up +2.8%. Ex-food and energy, prices grew by +1.6% on the year.
Among key categories, package holidays saw the sharpest annual gain, growing by +5.6%, while on the flip side, gas and vegetables both declined by -3.2% on the year.
Yields And USD Fall Ahead Of Yellen’s Second Testimony
- Yellen's dovish admission on rates weighs on USD and yields;
- Fed speakers and US data also on the agenda today.
US equity markets are expected to open higher again on Thursday as we await Federal Reserve Chair Janet Yellen's second day of testimony, this time in front of the Senate Banking Committee.
As is often the case with these hearings, the vast majority of what was said had very little impact on the broader markets, with lawmakers drifting repeatedly onto more political topics and Yellen giving very little away on the Fed's monetary policy position that isn't already known. Yellen's admission that rate increases will be gradual though – not a new revelation in itself – while highlighting persistent subdued inflation and low neutral rate, suggested that the pace of tightening next year and beyond may well be slower, with focus likely shifting to balance sheet reduction.
While many may have expected this to be the case prior to this, Yellen's acknowledgement of this potentially signals a slight shift in the Fed's rate outlook later this year, once the central bank unveils its plans to begin the process of reducing its bond purchases. In this moderate growth and low inflation environment, this comes as a relief to investors and therefore provided a temporary boost for equities. The question now is whether Yellen reiterates the point in today's testimony, adds further colour to it or possibly backtracks on it.
Following Yellen's slightly dovish testimony, the dollar has come off a little to trade near nine month lows as bond yields have also ticked a little lower. With central banks elsewhere only likely to pick up the pace, the US dollar may remain under some pressure for the foreseeable future. The Bank of Canada this week raised interest rates and the ECB could signal its intentions to continue to reduce its bond buying next week while the Bank of England may not be far behind on tightening.
Fed policy makers Charles Evans and Lael Brainard will also be appearing on Thursday, which could also grab some attention, with both being voters on the FOMC this year. We'll also get some economic data from the US, including jobless claims and PPI inflation figures, although tomorrow's retail sales and CPI inflation data is what traders will be primarily focus on, on that fro
Market Update – European Session: European Indices Extend Gains As Bond Yields Drop, Daimler Drops On Excess Emissions Report
Notes/Observations
European Equities continuing to rise following strong gains yesterday, as European Bond Yields retreat
OPEC compliance with oil cuts falls to 6 month low
Daimler shares fall after on report it cheated on Diesel emissions tests
Overnight
Asia:
Korea';s Kospi rose nearly 1% after BOK left rates on hold but did raise its outlook for 2017 GDP
China H1 trade balance in yuan terms fall 17.7% y/y to CNY1.28T; in dollar terms June trade was $42.8B, in line with expectations. Trade with the US in dollar terms was at its highest level since October 2015 at $25.4B
(JP) Bank of Japan (BOJ) reportedly intends to raise growth outlook for FY17-18 by 0.1-0.2% at policy meeting next week
Europe:
BOE's McCafferty (hawkish dissenter): BOE should consider unwinding £435B QE program earlier than planned, plans to vote for a 25bp hike again in August
UK to publish the Repeal Bill a key Brexit law, which is central to the government's plan to exit the EU in 2019
Germany, France and Spain confirm final CPI readings, whilst Sweden reported slightly stronger CPI for June
BOE Credit conditions survey saw availability of mortgage lending falling this Quarter
Americas
Fed's George (hawk, non-voter): favors starting balance sheet reduction in the near future, current asset valuations, low volatility may signal financial market complacency
Oil
IEA Monthly report: Expects 2017 Global demand to grow 1.5% to 98M b/d
Global oil supply increased by 720K b/d in June to 97.46M b/d
OPEC Compliance with cuts slips from 95% in May to 78% in June, lowest in 6 months
Economic Data
(SE) SWEDEN JUN CPI M/M: 0.1% V 0.0%E; Y/Y: 1.7% V 1.6%E
(DE) GERMANY JUN FINAL CPI M/M: 0.2% V 0.2%E; Y/Y: 1.6% V 1.6%E
(FR) FRANCE JUN FINAL CPI M/M: 0.0% V 0.0%E; Y/Y: 0.7% V 0.7%E
(ES) SPAIN JUN FINAL CPI M/M: 0.0% V 0.0%E; Y/Y: 1.5% V 1.5%E
(TR) Turkey May Current Account: -$5.2B v -$5.0Be
Fixed Income Issuance:
(IT) ITALY DEBT AGENCY (TESORO) SELLS TOTAL €2.0B VS. €1.5-2.0B INDICATED RANGE IN 2033 AND 2037 BTP BONDS
(IE) IRELAND DEBT AGENCY (NTMA) SELLS TOTAL €0.75B VS. €0.75B INDICATED IN 2022 AND 2045 IGB BONDS
SPEAKERS/FIXED INCOME/FX/COMMODITIES/ERRATUM
Equities
Indices [Stoxx50 +0.5% at 3,539, FTSE +0.1% at 7,424, DAX +0.4% at 12,678, CAC-40 +0.7% at 5,259, IBEX-35 +1.0% at 10,671, FTSE MIB +0.4% at 21,524, SMI +0.4% at 9,049, S&P futures +0.2%]
Market Focal Points/Key Themes: European indices opened flat or slightly down, but moved higher as the session progressed; trend following comments from Fed Chair Yellen seen not in a rush to raise rates; oil helped performance among energy stocks Metro's spinoffs debuted in trading; French press revived speculation that Alstrom was considering buying Siemens' train business; Yellen to continue speaking today; attention now turning to the first reports of earning season; upcoming US earnings include Delta Airlines and Emmis Communications
Equities
Consumer discretionary [Casino CO.FR +3.9% (earnings), Asos ASC.UK -2.4% (earnings), Game Digital GMD.UK +9.3% (SD takes stake), N Brown BWNG.UK -8.1% (cost evaluation)]
Consumer staples [Koninklijke Wessanen KWZ2.DE -3.1% (analyst action)]
Energy [Premier Oil PMO.UK -2.4% (production update)]
Financials [Partners Group PGHN.CH +3.4% (results)]
Healthcare [Astrazeneca AZN.UK -4.5% (CEO approached by Teva), Oxford Biomedica OXB.UK +6.9% (receives approval)]
Industrials [Alstom ALO.FR +2.7% (earnings), Daimler DAI.DE -0.5% (under investigation), Kvaerner KVAR.NO +3.7% (results)]
Speakers
(UK) Trade Sec Fox: UK will look at bridging mechanism if needed for Brexit
(RU) Russia Central Bank (CBR) Gov Nabiullina: Russia must stick to free-floating rouble policy
Currencies
GBPUSD continues to grind higher bouncing off yesterday morning lows, dealers note resistance stands at 1.2980. The bounce in Sterling has also helped EURGBP ease, dropping below yesterday low, with next support seen at 0.8815.
EURSEK trades sharply lower after strong Swedish inflation readings with the cross dropping below 9.55 from ~9.61 prior to the release. The pair trades at a 10 week low with near term support seen at 9.505
Fixed Income
Bund futures trade at 161.62 up 22 ticks as volume rises and stops are taken out. Resistance lies near the 162.10 level followed by 162.75. A break of the 160.00 support level could see lows target 159.25 followed by 157.50.
Gilt futures trade at 125.87 higher by 23 ticks and back towards the July 4th highs. Price finds key support at the 124.42 support level. An acceleration lower could test the 122.88 region. Resistance remains the noted 126.00 region, followed by 126.72.
Thursday';s liquidity report showed Wednesday';s excess liquidity fell to €1.667T a drop of €3B from €1.670T prior. Use of the marginal lending facility fell to €214M from €258M prior.
Corporate issuance saw $2B come to market via 3 issuers headlines by Cencosud $1B unsecured senior offering and PTT Exploration and Production $0.5B notes offering
Looking Ahead
05:30 (ZA) South Africa May Total Mining Production M/M: 1.0%e v -1.6% prior; Y/Y: 2.2%e v 1.7% prior
08:00 (BR) Brazil May IBGE Services Sector Volume Y/Y: -1.8%e v -5.6% prior
08:15 (UK) Baltic Dry Index
08:30 (US) Jun Final Demand PPI M/M: 0.0%e v 0.0% prior; Y/Y: 1.9%e v 2.4% prior
08:30 (US) Initial Jobless Claims: 245Ke v 248K prior; Continuing Claims: 1.950 v 1.956M prior
08:30 (US) Weekly USDA Net Export Sales
08:30 (CA) Canada May New Housing Price Index M/M: 0.3%e v 0.8% prior; Y/Y: 3.5%e v 3.8% prior
09:00 (RU) Russia Gold and Forex Reserve w/e July 7th : No est v $412.2B prior
10:30 (US) Weekly EIA Natural Gas Inventories
14:00 (US) Jun Monthly Budget Statement: -$35.0Be v -$88.4B prior
XAU/USD Analysis: Touches 1,226 Level
As Janet Yellen began giving her testimony on Wednesday, the yellow metal’s price jumped. During the move the commodity price broke out of the ascending channel pattern. However, as the chairwoman ended the speech, the metal had retreated back to the 1,220 level. Moreover, something unordinary was happening on Thursday morning. Although theoretically the pattern is broken, the upper trend line of the ascending channel was still providing resistance to the commodity. Meanwhile, the 200-hour SMA and the monthly S1 were providing support to the metal. Due to that reason it can be expected that additional gains will be scored by the end of the week.
USD/JPY Analysis: Pressured By Bears
The US Dollar was trading slightly above a support cluster formed by the weekly PP and the 200-hour SMA at 113.40 on Wednesday morning. Nevertheless, fundamentals put strong downward pressure on the pair mid-session that resulted in the Greenback plunging as low as 113.00. The rate has not since recovered, despite various attempts to edge above the 113.30 mark. Thus, the Greenback has remained below the weekly PP since the massive fall and may fail to overcome it once again. It is therefore likely that the rate persists within the bounds of this level and the weekly S1 at 112.64 in case no solid upside risks manage to prevail in this session.
GBP/USD Analysis: Tests Channel
On Wednesday morning, GBP/USD plunged and subsequently surged in response to fundamentals. It was pushed through the 55-hour SMA and the monthly PP circa 1.2880. The 100-hour SMA managed to halt the pair for some hours; however, this level was likewise conquered in the evening. The Sterling surged once again on Thursday morning, pushing through the 200-hour SMA and the weekly PP and thus breaching the channel. Technical indicators remain bullish; however, oscillators signal that the pair may soon be overbought, thus pressuring traders to sell the Pound. Thus, it is expected that the rate fails to sustain the current upward momentum and returns in the 1.2900/20 area by Friday morning.