Sample Category Title
EUR/USD Analysis: Falls Back Below 1.14
The forecast of a surge of the Euro against the US Dollar has not fulfilled itself, as the currency exchange rate traded even below the 1.14 mark on Thursday morning. The main reason for the initial decline and passing of the support levels during the second half of Wednesday’s trading session was the testimony given by the chairwoman of the Federal Reserve Janet Yellen. The testimony signalled that there are more than one changes in US monetary policy upcoming, which will strengthen the US Dollar. Due to that reason the currency pair traded below the 1.14 mark. It was facing a strong support cluster, as the levels just below the 1.14 are full of various supports. These support levels are highly likely going to force the pair into a continuation of the surge.
Daily Technical Analysis: USD/CAD Further Bearish Pressure Is Expected
Following reports from OPEC that supply shall exceed demand in the oncoming year or so, we have a consolidating Crude Oil price around USD44-45/bbl. BoC have increased their rate overnight following signs of inflation. Given this, the USD/CAD could be further sold on on rallies. My previous analysis showed a drop in the pair and I expect this to continue. At this point the pair is just above W H5, and above D L3. According to my CAMMACD method, we could see another drop below D L3. The drop could happen with or without retracement. If we see a retracement, pay attention to POC 1.2790-1.2810 (50.0, W L4, D H3, ATR pivot) where the price could reject. A move below 1.2675 suggests bearish continuation towards 1.2606 all the way down to 1.2485.
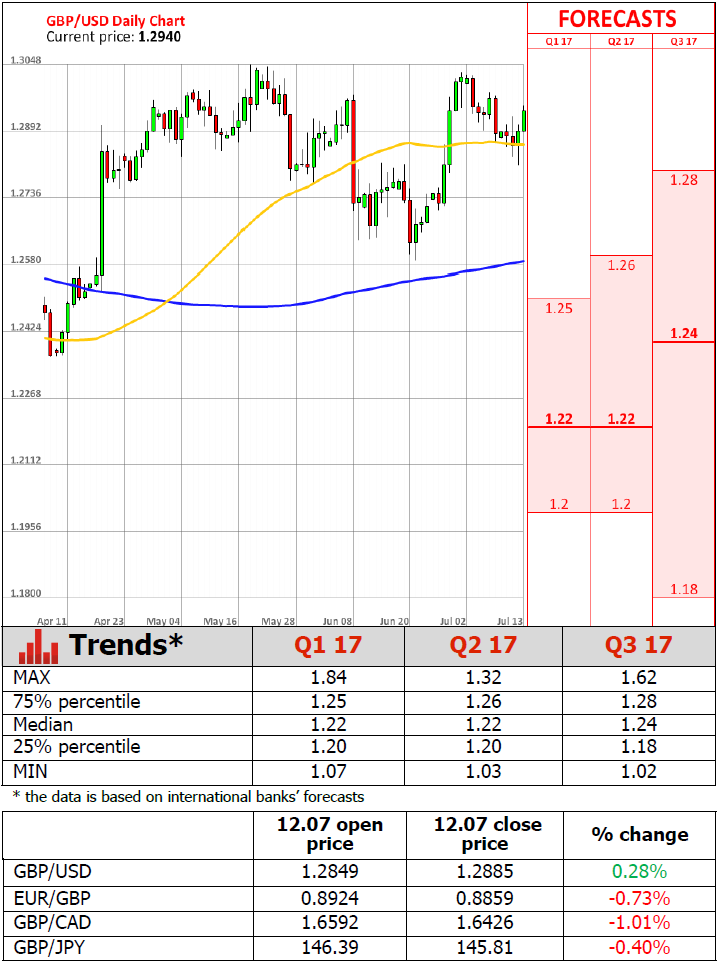
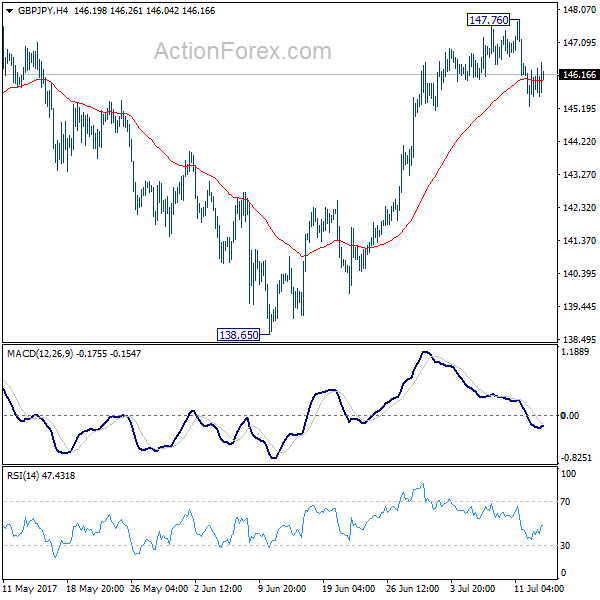
GBP/JPY Daily Outlook
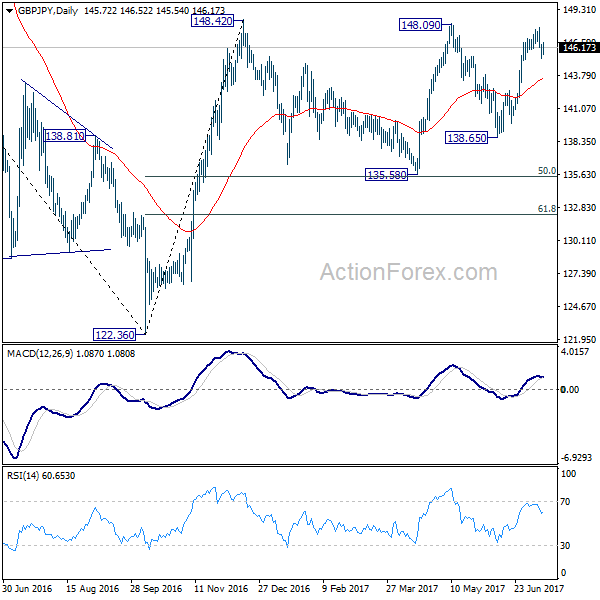
Daily Pivots: (S1) 145.24; (P) 145.82; (R1) 146.40; More
Intraday bias in GBP/USD stays mildly on the downside as fall from 147.76 would extend to 55 day EMA (now at 143.48). Break there will target 135.58 key support level again. On the upside, though, decisive break of 148.09/42 will pave the way to long term fibonacci level at 150.43.
In the bigger picture, rise from medium term bottom at 122.36 is expected to continue to 38.2% retracement of 196.85 to 122.36 at 150.43. Decisive break there will carry long term bullish implications and pave the way to 61.8% retracement at 167.78. In case the sideway pattern from 148.42 extends, we'd be looking for strong support from 135.58 and 50% retracement of 122.36 to 148.42 at 135.39 to contain downside.
EUR/JPY Daily Outlook
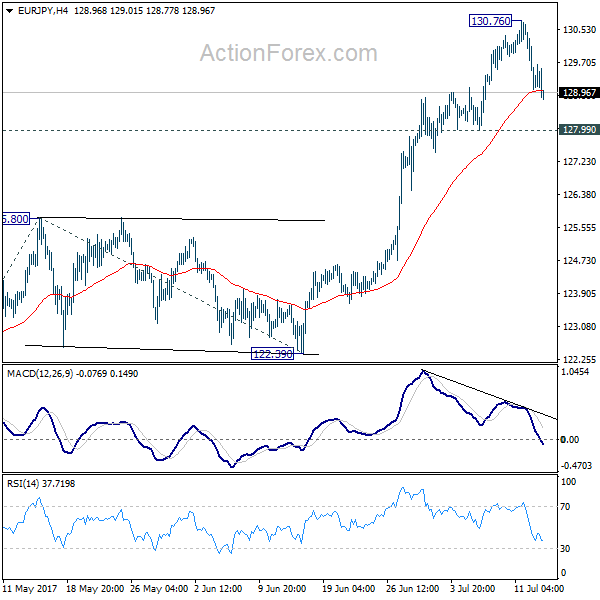
Daily Pivots: (S1) 128.56; (P) 129.61; (R1) 130.19; More...
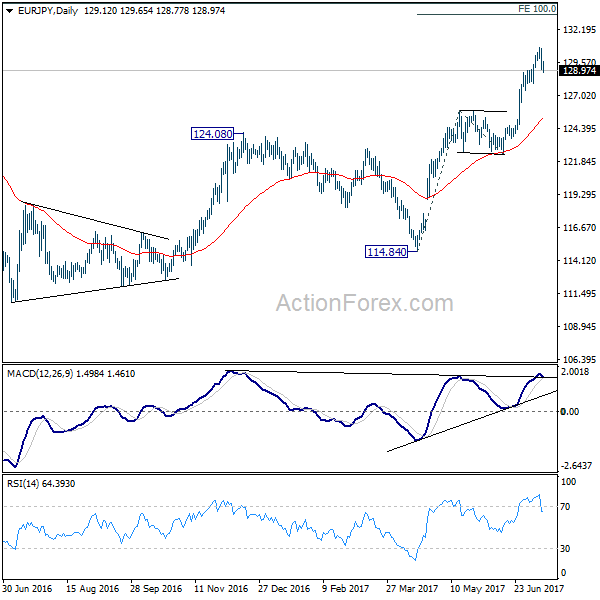
Intraday bias in EUR/JPY remains neutral for consolidation below 130.76 temporary top. Near term outlook remains bullish as long as 127.99 support holds. Above 130.76 will target 100% projection of 114.84 to 125.80 from 122.39 at 133.35 next. However, considering bearish divergence condition in 4 hour MACD, break of 127.99 will bring deeper pull back 55 day EMA (now at 125.13).
In the bigger picture, the break of 126.09 support turned resistance should have confirmed completion of down trend form 149.76 (2014 high), at 109.03 (2016 low). Current rise from 109.03 would now target 61.8% retracement of 149.76 to 109.03 at 134.20 and above. Medium term outlook will remain bullish as long as 122.39 support holds.
EUR/JPY Back Below 130.00, EUR/GBP Bearish Consolidation, EUR/CHF Profit-Taking.
EUR/JPY Back below 130.00.
EUR/JPY is consolidating above 130 for the first time in a year and half. Hourly support can be found at 127.10 (30/06/2017). Next support is given at 122.56 (18/05/2017 low). Further upside is favored.
In the longer term, the technical structure validates a medium-term succession of lower highs and lower lows. As a result, the resistance at 149.78 (08/12/2014 high) has likely marked the end of the rise that started in July 2012. Strong support at 94.12 (24/07/2012 low) looks nonetheless far away.
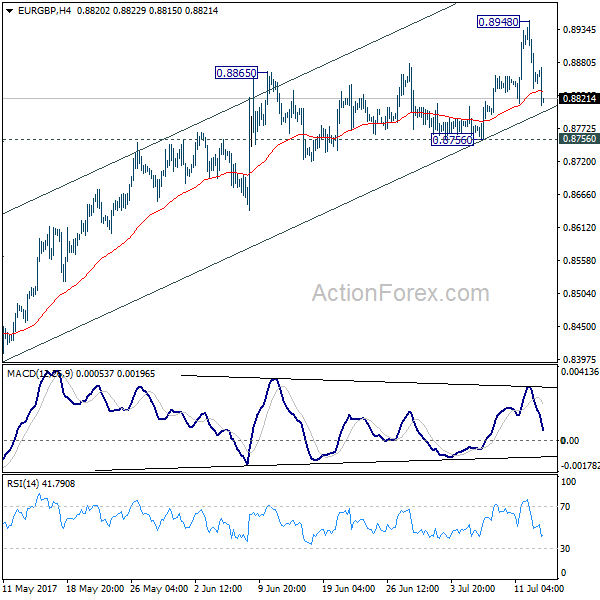
EUR/GBP Bearish consolidation.
EUR/GBP hgas failed to testi for the third time resistance area around 0.8900. Hourly support is given at 0.8719 (16/06/2017 low). Expected to show further buying pressures.
In the long-term, the pair has largely recovered from recent lows in 2015. The technical structure suggests a growing upside momentum. The pair is trading above from its 200 DMA. Strong resistance can be found at 0.9500 psychological level.
EUR/CHF Profit-taking.
EUR/CHF is still trading above psychological level at 1.1000. Selling pressures will definitely be important at this point. Hourly support is located at a distance at 1.0922 (30/06/2017 low). Expected to inch higher.
In the longer term, the technical structure is mixed. Resistance can be found at 1.1200 (04/02/2015 high). Yet,the ECB's QE programme is likely to cause persistent selling pressures on the euro, which should weigh on EUR/CHF. Supports can be found at 1.0184 (28/01/2015 low) and 1.0082 (27/01/2015 low).
GOLD Short-Term Bullish Bounce, SILVER Short-Squeeze, CRUDE OIL Sideways Price Action.
GOLD Short-term bullish bounce.
Gold's is trading higher after the precious metal reached the $1200 level. Hourly support is now given at $1204 (10/07/2017 high). Hourly resistance can be found at 1229 (06/07/2017 high). Expected to show renewed bearish pressures in case the resistance level at 1229 holds.
In the long-term, the technical structure suggests that there is a growing upside momentum. A break of 1392 (17/03/2014) is necessary ton confirm it, A major support can be found at 1045 (05/02/2010 low).
SILVER Short-squeeze.
Silver is bouncing higher from hourly support at 15.18 (10/07/2017 low). Key resistance is given at a distance at 17.75 (06/06/2017 high). The road seems wide open for further decline.
In the long-term, the death cross indicates that further downsides are very likely. Resistance is located at 25.11 (28/08/2013 high). Strong support can be found at 11.75 (20/04/2009).
CRUDE OIL Sideways price action.
Crude oil is trading above $44. The volatility is declining. Hourly support is given at 43.65 (10/07/2017 low). Expected to show continued short-term bullish improvement.
In the long-term, crude oil has recovered after its sharp decline last year. However, we consider that further weakness are very likely. Strong support lies at 35.24 (05/04/2016) while resistance can now be found at 55.24 (03/01/2017 high).
USD/CHF Sideways Price Action, USD/CAD Collapsing, AUD/USD Strongly Strengthening.
USD/CHF Sideways price action.
USD/CHF is trading mixed in a slight shortterm bullish trend. Hourly resistance can be found at 0.9696 (09/06/2017 high). Strong resistance is given at 1.0107 (10/04/2017 high). Hourly support is given at 0.9553 (30/06/2017 low).
In the long-term, the pair is still trading in range since 2011 despite some turmoil when the SNB unpegged the CHF. Key support can be found 0.8986 (30/01/2015 low). The technical structure favours nonetheless a long term bullish bias since the unpeg in January 2015.
USD/CAD Collapsing.
USD/CAD has strongly declined. Support given at 1.2913 (04/07/2017 low) has been broken. Resistance is located at 1.3014 (02/15/2017). Expected to show continued bearish pressures.
In the longer term, the pair lies in a bullish channel since a year. Strong resistance is given at 1.4690 (22/01/2016 high). Long-term support can be found at 1.2461 (16/03/2015 low).
AUD/USD Strongly strengthening.
AUD/USD's technical structure is bullish since early May despite some consolidation move. The pair should further head back towards resistance at 0.7712 (30/06/2017 high). However, a break of support at 0.7520 (09/06/2017 low) would nonetheless indicate a renewed bearish trend.
In the long-term, we are waiting for further signs that the current downtrend is ending. Key supports stand at 0.6009 (31/10/2008 low) . A break of the key resistance at 0.8295 (15/01/2015 high) is needed to invalidate our long-term bearish view.
EUR/USD Ready For Another Leg Higher, GBP/USD Surging, USD/JPY Profit-Taking.
EUR/USD Ready for another leg higher.
EUR/USD bearish pressures are definitely weak and the pair is still lying in a bullish momentum. Hourly resistance is given at broken resistance at 1.1489 (12/07/2017 high). Hourly support can be found at 1.1292 (28/06/2017 low). Stronger support lies at 1.1076 (18/05/2017 low).
In the longer term, the momentum is clearly negative. We favour a continued bearish bias towards parity. Key resistance holds at 1.1714 (24/08/2015 high) while strong support lies at 1.0341 (03/01/2017 low).
GBP/USD Surging.
GBP/USD is back below 1.3000. Strong resistance can be found at 1.3046 (18/05/2017 high). Expected to inch higher.
The long-term technical pattern is even more negative since the Brexit vote has paved the way for further decline. Long-term support given at 1.0520 (01/03/85) represents a decent target. Long-term resistance is given at 1.5018 (24/06/2015) and would indicate a long-term reversal in the negative trend. Yet, it is very unlikely at the moment.
USD/JPY Profit-taking.
USD/JPY has exited symmetrical triangle. yet, ongoing move seems that profits are currently taken. Hourly support can be found at 112.83 (05/07/2017 low). Stronger support is located at 108.13 (17/04/2017 low). Expected to show renewed bullish pressures.
We favor a long-term bearish bias. Support is now given at 96.57 (10/08/2013 low). A gradual rise towards the major resistance at 135.15 (01/02/2002 high) seems absolutely unlikely. Expected to decline further support at 93.79 (13/06/2013 low).
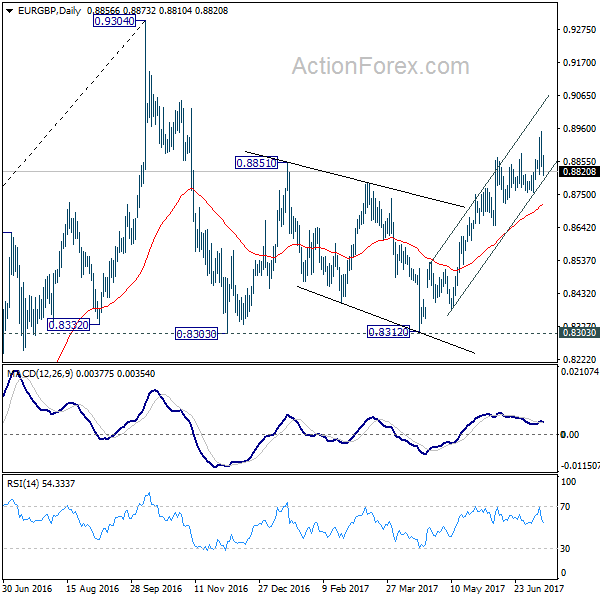
EUR/GBP Daily Outlook
Daily Pivots: (S1) 0.8813; (P) 0.8881; (R1) 0.8924; More
Intraday bias in EUR/GBP is turned neutral with the sharp pull back from 0.8948. Some consolidations would be seen but another rise is expected as long as 0.8756 support holds. Above 0.8948 will extend the rise from 0.9312 to retest 0.9304 high. However, firm break of 0.8756 will indicate near term reversal and turn bias to the downside.
In the bigger picture, price actions from 0.9304 are viewed as a medium term corrective pattern. It's uncertain whether it is finished yet. But in case of another fall, we'd expect strong support from 0.8116 cluster support (50% retracement of 0.6935 to 0.9304 at 0.8120) to contain downside and bring rebound. Whole up trend from 0.6935 is expected to resume after consolidation from 0.9304 completes.
UK Unemployment Claims Add 6K, Weekly Earnings Match Forecasts
'Despite the strong jobs picture, however, there has been another real-terms fall in total earnings, with the growth in weekly wages low and inflation still rising.' — Matt Hughes, ONS
The unemployment rate in Britain declined unexpectedly, while the jobless claimant count was little changed, missing analysts' expectations. The official report by the Office for National Statistics published on Wednesday showed that claims for unemployment aid rose just 6K in May, following the prior month's upwardly revised 7.5K, while economists anticipated a gain of 10K. The UK unemployment rate declined to 4.5% in the May quarter, reaching its lowest level since 1975. Meanwhile, the ONS stated that the Average Earnings Index remained flat at 1.8% year-over-year in May, matching market forecasts and following previous month's 2.1% rise. Excluding bonuses, earnings advanced more than expected to 2% in March-May period, up from 1.7% registered in April. However, real earnings dropped 0.5%, as consumer prices rose at a faster pace than Britons' pay. Inflation was at 2.9% in the reported month, showing the fastest pace of growth in about four years. Experts suggest that the Brexit impact on the economy is set to be even more explicit in the coming years.