
Sample Category Title
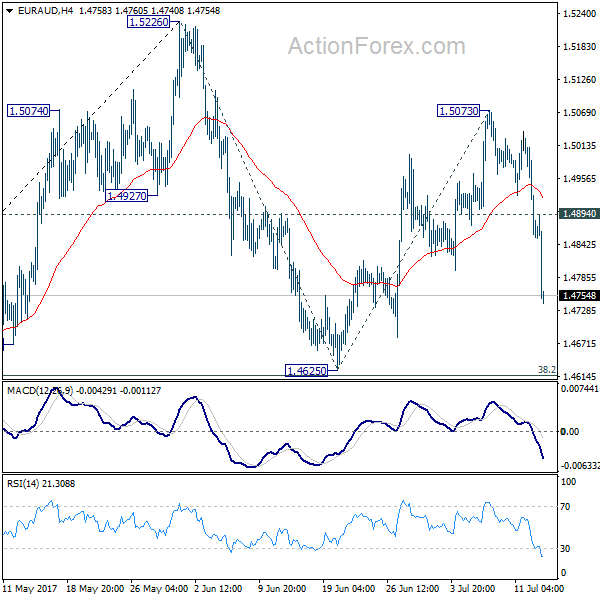
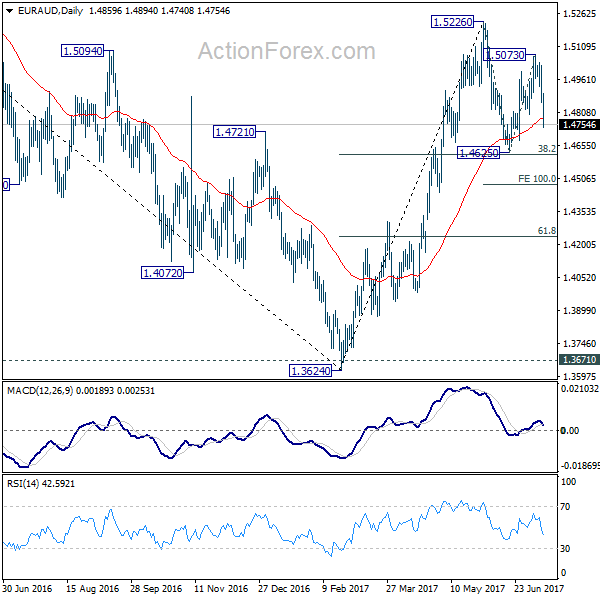
EUR/AUD Daily Outlook
Daily Pivots: (S1) 1.4948; (P) 1.4992; (R1) 1.5057; More...
EUR/AUD's sharp decline and break of 1.4796 support suggests that corrective rebound from 1.4625 has completed at 1.5073 already. Intraday bias is turned back to the downside for 1.4625 support next. Break there will extend the whole corrective decline from 1.5526 and target 100% projection of 1.5226 to 1.4625 from 1.4472. On the upside, above 1.4894 minor resistance will turn intraday bias neutral again.
In the bigger picture, price actions from 1.6587 medium term top are viewed as a corrective pattern. Such correction should be completed at 1.3624 after defending 1.3671 key support. Rise from 1.3642 would extend to 61.8% retracement of 1.6587 to 1.3624 at 1.5455. Sustained break there will pave the way to retest 1.6587. However, sustained break of 1.4625 support will dampen this bullish view. In that case, we'll assess the outlook later after looking at the structure and depth of the pull back.
Bank Of Canada Increases Overnight Rate To 0.75%
'One key indicator of progress will continue to be wage inflation, which has shown signs of pickup recently.' — Stephen Poloz, Bank of Canada
At the latest policy meeting, the Bank of Canada decided to raise its overnight rate target by 0.25% to 0.75% for the first time since 2010, satisfying economists' expectations. In light of a shift in rhetoric from the central bank, which turned to be a lot more hawkish over the prior month, and generally more optimistic economic data, policymakers judged that a rate increase was appropriate at this point in time. The BoC's statement revealed that a substantial amount of economic slack 'has been absorbed', while the output gap is set to narrow significantly by the end of the year, as opposed to the previous estimates for the output gap to close in the H1 of 2018. Moreover, the GDP outlook for 2018 has brightened up, as the BoC revised upwards its growth forecast to 2.0% from 1.9%, with exports set to make a larger contribution to the GDP over the observed period. Apart from that, despite inflation still remaining below the target, the BoC said it could be caused by temporary factors, which makes the central bank sure inflation rate is capable of meeting the target by the end of H1 of 2018.
Janet Yellen Testifies Before House Financial Services Committee In Washington DC
'The Fed continues to expect that the evolution of the economy will warrant gradual increases in the federal funds rate over time.' - Janet Yellen, US Federal Reserve
On Wednesday, the Chair of the US Federal Reserve Janet Yellen testified on the Semi-annual Monetary Policy Report before the House Financial Services Committee in Washington DC. In the prepared testimony, Yellen said that the country's economy was strong enough for the central bank to continue to increase interest rates and start winding down its massive balance sheet as soon as this year. Furthermore, in what might appear to be her last public appearance before the Congress, the Fed Chair highlighted the fact that despite the economy expanding at a slowly (but steady) pace, it continued to add jobs and benefit from stable household consumption and business investment, while more favourable conditions overseas continued to support the domestic economy. Ms. Yellen also noted that in the wake of the current estimates, the federal funds rate might not even need to increase all that much further in order to reach the neutral level that would neither encourage nor discourage the economic activity at home.
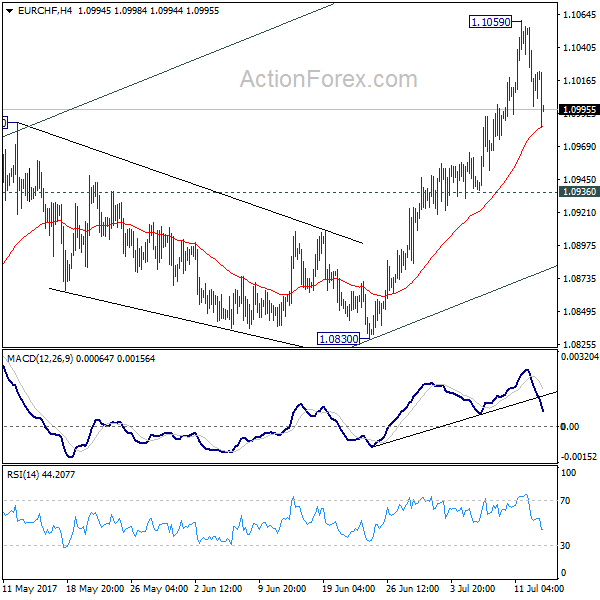
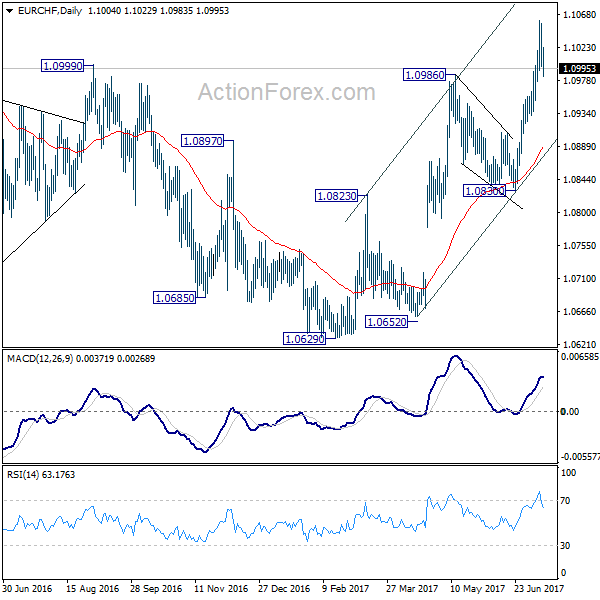
EUR/CHF Daily Outlook
Daily Pivots: (S1) 1.0990; (P) 1.1023; (R1) 1.1048; More...
EUR/CHF's sharp decline indicates temporary topping at 1.1059. Intraday bias is turned neutral for consolidations. Downside of retreat should be contained above 1.0936 support to bring another rally. Above 1.1059 will target 1.1127 resistance next.
In the bigger picture, the price actions from 1.1198 are seen as a corrective move. Such correction could have completed after defending 38.2% retracement of 0.9771 to 1.1198 at 1.0653. Decisive break of 1.0999 resistance should target a test on 1.1198 high. For now, this will be the preferred case as long as 1.0830 support holds.
Yellen’s Dovish Comment Sent USD Lower
US dollar fades on Fed comment, but consolidates at 1.14 Euros and below
The US dollar extended losses yesterday after the Fed Chair expressed uncertainty about the effects of tightening on inflation. After retreating as much 0.80% during the day, EUR/USD bounced back to 1.1450 during the Asian session as investors recalibrated their expectations for a slower pace of tightening in the US, while across the Atlantic the ECB is expected to move slowly toward tightening.
This convergence of monetary policy between the two biggest central banks could lead to a sharp appreciation of the single currency and could potentially bring back the currency pair toward levels last seen three years ago. However, even though it looks like a live possibility, the ECB won't let that happen as it would put the final nail in the coffin of already faltering inflation pressures.
All in all, Yellen didn't bring new information to the table as all of this was already known and priced in by market participants. Therefore, investors will have to wait next week's ECB meeting to get further clarity on EUR/USD outlook.
On Thursday, EUR/USD continued to trade below the key resistance that lies at between 1.1450-1.15 and consolidated at around 1.1440. We think it is unlikely for the euro to break the latter resistance before the ECB meeting next week. A retracement in the short-term is therefore likely.
Renmimbi upside looks good, as China trade beats expectations
At the 6.75 range, the USD/CNY has hit its lowest level so far in 2017, and our outlook is that it will keep falling. China's export surplus balance is holding strong at +$42.4 billion, and its surplus to the USA grew $3 billion in June alone.
China has rebounded smartly since its 2015 ‘meltdown', which saw stocks and currency values plunge. Imports are booming, climbing in June by 17.2% year on year, driven especially by commodities and iron ore that ends up in construction. Exports are also robust, rising 11.3% in annualized terms in June.
The economy has repowered from the slump, but it is different than was. Double-digit growth is now over. Service businesses are playing an ever stronger role alongside the ‘factory of the world'. And debt is increasing at a very strong pace.
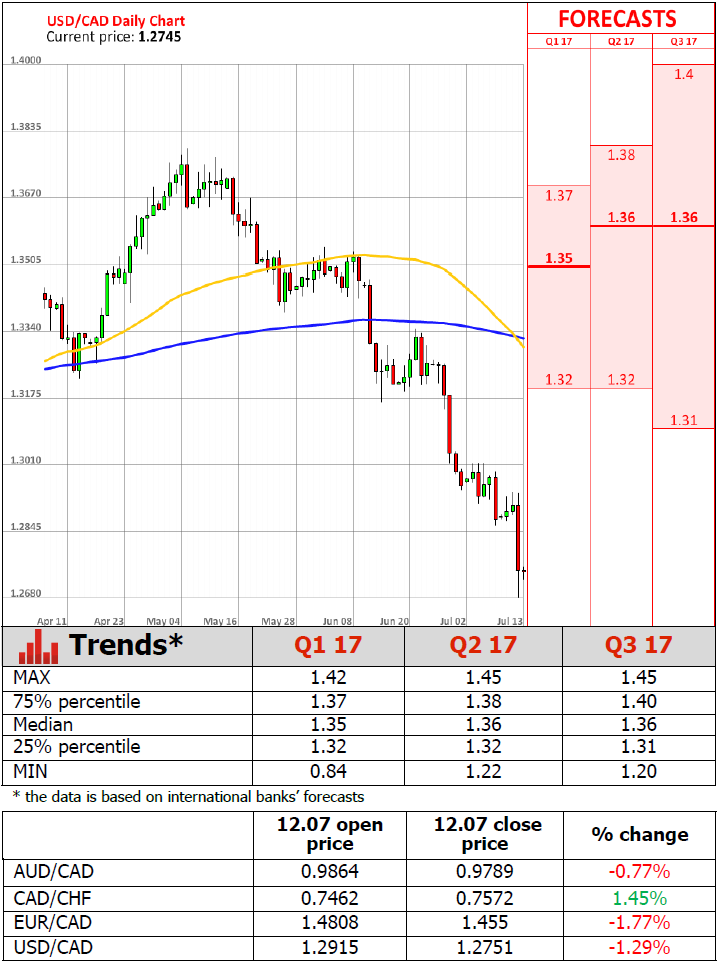
Bank Of Canada Hikes Rates, Loonie Surges
The Bank of Canada raised its benchmark interest rate by 25bps yesterday, in line with market expectations. The tone of the statement accompanying the decision was hawkish overall, with the Bank dismissing the recent softness in inflation as being temporary. In addition, policymakers kept the prospect of further near-term hikes on the table by noting that future interest rate adjustments will be guided by incoming data related to the outlook for inflation.
The key takeaway for us was that the BoC is raising rates preemptively because it expects inflation to pick up in the near future, and that further hikes in coming months are a distinct possibility. As a result of these hawkish signals, the Canadian dollar surged on the news, even though a 25bps rate hike was fully priced in ahead of the meeting. In addition, the implied market probability for further rates hikes this year rose in the aftermath, according to Canada's Overnight Index Swaps. Moving forward, we think CAD could remain under buying pressure for a few days, perhaps until next Friday, when we get CPI data for June.
USD/CAD collapsed yesterday after the BoC hiked interest rates and hinted that there may be more to come soon. The pair fell below the support (now turned into resistance) barrier of 1.2860 (R2), to eventually stop at 1.2680 (S1). The fact that the rate is still trading below the downtrend line taken from the peak of the 11th of May, and also below the psychological zone of 1.3000, which acted as the lower bound of the sideways range that contained the price action since September, keeps the bias to the downside, in our view. Therefore, we expect a clear dip below 1.2680 (S1) to open the way for our next support level of 1.2600 (S2). Nevertheless, given that yesterday's tumble appears overextended, we stay mindful that a corrective rebound may be on the cards before the bears decide to take charge again. A move above 1.2770 (R1) could confirm the case for a corrective bounce, perhaps to test the 1.2860 (R2) area as a resistance this time.
In her semi-annual testimony before the House Financial Services Committee yesterday, Fed Chair Yellen was seen as being cautious, offering no direct signals that another rate hike this year is on the cards. Perhaps as a result of the lack of clarity on the timing of the Bank's next move, the dollar moved lower at the release of her prepared remarks.
The Fed chief will testify today as well, this time before the Senate Banking Committee. Given that she will deliver the same testimony as yesterday, we expect market participants to focus primarily on the Q&A session. Any signals suggesting that she is within the Fed camp of those who are concerned that the recent weakness in inflation may persist could hit the dollar again. Having said that, the nation's CPI data for June tomorrow may prove the biggest determinant of the dollar's forthcoming direction, as they could shed some light on whether the latest softness in inflation is indeed transitory and thereby, whether another hike is in the works for this year.
EUR/USD traded lower overall yesterday, despite the spike up on Yellen's remarks. The pair found support near the short-term uptrend line taken from the low of the 22nd of June and during the Asian morning today, the rate rebounded. In our view, the rebound confirms the validity of the aforementioned trend line and keeps the door open for further advances. We would expect the bulls to aim for the 1.1485 (R1) resistance soon, where a decisive break would confirm a forthcoming higher high and perhaps set the stage for our next resistance obstacle of 1.1530 (R2), marked by the peak of the 4th of May 2016.
As for the rest of today's highlights:
During the European session, we get Sweden's CPIs for June. The forecast is for both the headline and the underlying inflation rates to have moved lower, which could curb some speculation that the Riksbank is due to remove its interest rate easing bias soon. Something like that could weigh on SEK. From Germany, we get the final CPI print for June, but considering that the final figure is expected to confirm the preliminary estimate, any reaction in EUR is unlikely. Later in the day, we get the US PPI for June and expectations are for a slowdown.
Besides Chair Yellen, we have two more Fed speakers on the agenda: Fed Board Governor Lael Brainard and Chicago Fed President Charles Evans.
USD/CAD
Support: 1.2680 (S1), 1.2600 (S2), 1.2500 (S3)
Resistance: 1.2770 (R1), 1.2860 (R2), 1.2940 (R3)
EUR/USD
Support: 1.1380 (S1), 1.1300 (S2), 1.1220 (S3)
Resistance: 1.1485 (R1), 1.1530 (R2), 1.1615 (R3)
Dead Cat Bounces For Gold And Oil Overnight
GOLD
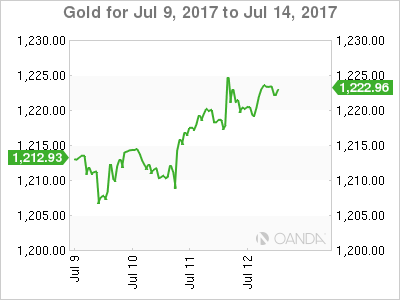
Gold briefly rallied to the 1226.00 regions overnight as Yellen's semi-annual testimony on the Hill was unexpectedly dovish and the U.S. Dollar fell. Gold was unable to sustain its gains though and dropped to finish unchanged on the session at around 1221.00, disappointing bulls hoping for a continuation of the week's recovery rally.
Today's 2nd day of testimony will now be very carefully watched by traders looking to see if the Fed's dovish theme has continued and whether they have “blinked” on their transitory inflation rhetoric. Gold's fate in the short term will undoubtedly be decided on Friday now by the U.S. CPI data which is indeed shaping up to be a major driver for the big Dollar, equities and bonds as well. A 4th undershoot in a row could see the U.S. Dollar coming under pressure which could be supportive of gold in the absence of other factors.
For now, the street is completely ignoring any political risk around the globe.
Gold traded at 1222.00 in early Asia with initial resistance at the overnight highs of 1226.00. It faces much more formidable resistance at the 1230/1231 area, the July 5th high and home to the 200-day moving average. Short term support lies at 1217.00 and 1213.25.
OIL
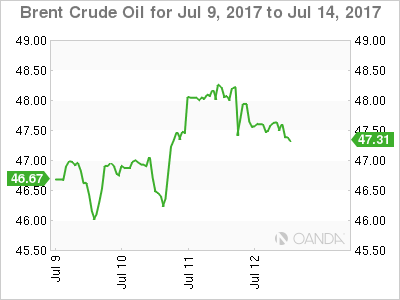
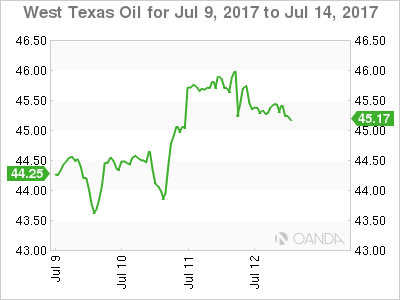
Both Brent and WTI jumped by over two percent at one stage overnight following a larger than forecast fall in official U.S. Crude Inventories of 7.6 million barrels. It followed the massive drawdown in the API Inventories the night before. The rally was short lived though as a dig through the figures revealed still tepid gasoline demand.
OPEC then delivered the nail in the coffin by forecasting lower than expected global oil demand next year and a continuing surplus. As the dust settled on the session, both contracts finished some 50 cents lower than their opening prices in what can only be described as disappointing price action. Traders may well have chosen to book short term profits after the decent rally from the start of the week.
Attention will now turn to Friday's U.S. CPI after a dovish Yellen testimony overnight, with price action to be choppy in the short term and subject to the nuances of the U.S. Dollar rather than developments in the oil market itself. The rally from Monday may well have run its course for now.
Brent spot trades at 47.50 this morning with resistance at 48.60 and 49.00 with support at 47.00 and then a more distant 46.00.
WTI spot is trading at 45.30 with solid resistance at the 46.40 double top and then 47.15. Support lies nearby at 45.00 followed by a lot of clear air down to the chart double bottom at 43.50.
Euro Edges Higher As German CPI Improves
The euro has posted slight gains in the Wednesday session. Currently, EUR/USD is trading at 1.1430. On the release front, German Final CPI posted a gain of 0.2%, matching the forecast. Later in the day, the US releases PPI, which is expected to remain at 0.0%. We’ll also get a look at Unemployment Claims, with an estimate of 245 thousand. Fed Chair Janet Yellen will testify before the Senate Banking Committee. On Friday, the US releases CPI and retail sales numbers, so traders should be prepared for some movement from EUR/USD.
Germany may be the locomotive of the eurozone economy, but the bloc’s largest economy has not been immune to low inflation. Final CPI improved to 0.2% in June, compared to -0.2% in May. CPI has managed just one reading above 0.2% in 2017, and earlier in the week, WPI came in at 0.0%. German and eurozone inflation levels remain well below the ECB’s target of 2%, and with no indication that inflation levels will move higher anytime soon, the cautious ECB is unlikely to taper its aggressive stimulus package.
After a short hiatus, Washington is again abuzz over allegations of secret ties between Russia and the Trump administration during the US election. This week’s breaking news is the revelation that Donald Trump Jr. admitted that a Russian official contacted him and offered to provide him with evidence incriminating Hillary Clinton. Trump and the White House are trying to lower the flames and put a positive spin on the meeting, but the media and lawmakers (including Republicans) aren’t about to let Trump off the hook. The crisis is just the latest miscue for the Trump administration, which hasn’t been able to pass any significant laws through Congress, even though Republicans control both the House of Representatives and the Senate. The latest dark cloud over the White House has dampened investor confidence, and the euro took advantage on Tuesday, climbing close to the 1.15 line.
Aussie Dollar Bullishness Under Threat
Key Points:
- Despite recent bullishness, the AUD could be about to tumble.
- Overarching chart pattern signals that the bears are on the verge of a comeback.
- Losses could extend to 0.7376.
The AUD has been on the offensive again this week, advancing almost 100 pips since Monday. As a result, hopes of the pair bursting through the long-term trendline are beginning to circulate and the bulls are gearing up for yet another push higher. However, this may all be a set up for a major slump that could erase the entirety of the rally seen over the prior two months.
More precisely, a messy double top/head and shoulders structure seems to be taking shape which indicates that the bears may be about to stage a comeback in a big way. Indeed, selling pressure could drag the pair as low as the 0.7376 handle by late August – even if a brief interruption is expected around the neckline as a result of the 100 day EMA. However, we will need to see some further confirmation in the form of a retreat below the 0.7634 mark before committing to this long-term view.
On that note, there is actually a fairly good technical argument for a confirmatory retreat. For one thing, despite the recent surge higher, the Parabolic SAR remains bearish and this will certainly be capping upsides to a significant degree. Additionally, the presence of the long-term trendline won’t have gone unnoticed and this could also provide an effective cap on upsides even in the event that the Parabolic SAR inverts. One final thing to consider is the movement of the stochastics into overbought territory as this is going to see selling pressure build as the week draws to an end.
Overall, the near-term outlook is rather bearish which should help the rest of the broader structure to form. Nevertheless, one important thing to remember is that the neckline is likely to be somewhat asymmetrical as a result of the 100 day moving average. Moreover, the overall pattern is likely to be more of a head and shoulders rather than a simple double top due to a potential reversal around the 38.2% Fibonacci level. However, once the pair has broken through that 100 day EMA, the plunge could be rather rapid so keep a close eye on the AUD moving forward.
Did The Fed’s Janet Yellen Just Turn Dovish?
Key Points:
- Fed Chair Yellen takes a dovish tone before congress.
- Central bank likely to rely mainly upon QE taper rather than multiple rate hikes.
- Equity and bond markets likely to be strongly impacted by any QE taper.
The markets have been relatively consigned to the fact of a cycle of interest rate tightening from the U.S. Federal Reserve in the coming year given the historic expectation setting that has occurred of late. However, the venerable Fed Chair, Janet Yellen, has tendered some testimony to congress which appears to take a significantly more dovish tone and has caused sentiment to swing sharply away from the greenback. Subsequently, markets have been left wondering just which direction the central bank will head in the coming months.
However, it wasn't really a surprise that there are many within the FOMC that are now backing away from an ever delayed cycle of significant tightening. The central bank's main problem is the abject lack of price inflation within the U.S. economy despite a strengthening labour market. Subsequently, given that inflation is running at around 1.4% (if you believe the official measure), it isn't a surprise that Yellen's comments indicate that the Fed is near to a neutral interest rate. Presently, the FFR sits at around 0.75% with a target rate of between 1.00% and 1.25%. So the central bank's contention is that an additional hike would take interest rates to a neutral level for the economy.
However, the real reason that the Fed is moving away from the rhetoric of a multiple rate hike tightening cycle is their balance sheet. The central bank has signalled their intention to start a balance sheet taper sometime in 2017 and this is likely to have a relatively strong impact on equity and bond markets. The current view is that the Fed will be looking to gradually offload around $4.5 trillion in bonds from their balance sheet and this is likely to have the same impact as further tightening in interest rates. Subsequently, equity markets could be in for a fairly rough ride once the QE removal process starts and some fairly rapid capital flows occur.
Additionally, if there are any further ripples in the global economy the Fed also faces the prospect of little in the way of macroeconomic tools to respond to recessionary pressures. Interest rates have a limited distance from the zero lower bound and the Fed is likely to still be carrying significant amounts on their balance sheet as any taper will likely not be rapid.
Regardless, the central bank has a job to do and they might have finally realised that the low inflation recovery has largely hampered their ability to respond to any form of crisis and, as such, are now looking at ways to normalise within relying upon strong rate hike cycles. Subsequently, we are left with the view that the Fed will likely hike 25bps in the remaining part of 2017 whilst slowly unwinding some of the bonds on their balance sheet. Ultimately, this means we are not likely to see the rampantly bullish U.S. Dollar that was largely expected with the planned multiple hikes.