
Sample Category Title
BoC Raised Interest Rates For The First Time Since 2010
For the 24 hours to 23:00 GMT, the USD declined 1.21% against the CAD and closed at 1.2758.
The Canadian Dollar gained ground, after the Bank of Canada (BoC), at its latest monetary policy meeting, raised its key interest rate for the first time in seven years.
The BoC raised the target for its overnight lending rate to 0.75% from 0.50%. In a statement accompanying the rate decision, the BoC Governor, Stephen Poloz, sounded upbeat on the Canadian economy, stating that recent data has bolstered the bank's confidence in its growth outlook.
In the Asian session, at GMT0300, the pair is trading at 1.2737, with the USD trading 0.16% lower against the CAD from yesterday's close.
The pair is expected to find support at 1.2632, and a fall through could take it to the next support level of 1.2528. The pair is expected to find its first resistance at 1.289, and a rise through could take it to the next resistance level of 1.3044.
The currency pair is trading below its 20 Hr and 50 Hr moving averages.

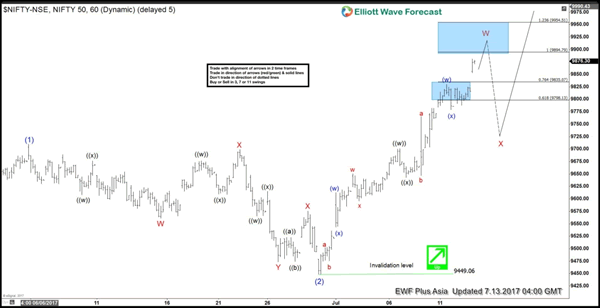
Elliott Wave View: NIFTY Resuming Higher
Short term NIFTY Elliott Wave view suggests the rally to 9709.3 ended Intermediate wave (1), and the pullback to 9449.06 low ended Intermediate wave (2). Intermediate wave (3) is unfolding as an Elliott wave double three structure where Minor wave W of (3) is currently in progress towards 9894.8 – 9954.5.
Up from 6/30 low at 9449.06, Minor wave W of (3) is unfolding as an Elliott Wave double three structure where Minute wave ((w)) ended at 9700.7 and Minute wave ((x)) ended at 9642.65. Wave ((y)) is in progress also as a double three structure where Minutte wave (w) ended at 9830.05, and Minutte wave (x) pullback is proposed complete at 9778.85.
Near term focus is on 9894.8 – 9954.5 to complete Minor wave W and end cycle from 6/30 low. Afterwards, Index should pullback in Minor wave X in 3, 7, or 11 swing to correct cycle from 6/30 low before the rally resumes. We don’t like selling the Index and expect buyers to appear once wave X is complete provided pivot at 9449.06 stays intact.
NIFTY 1 Hour Elliott Wave Chart
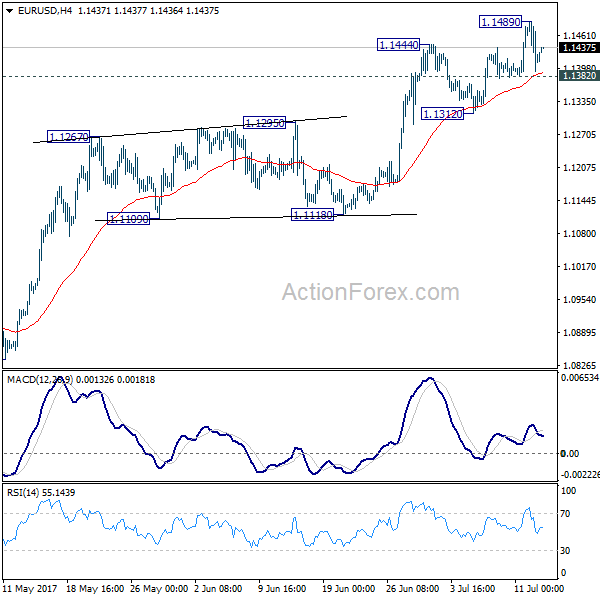
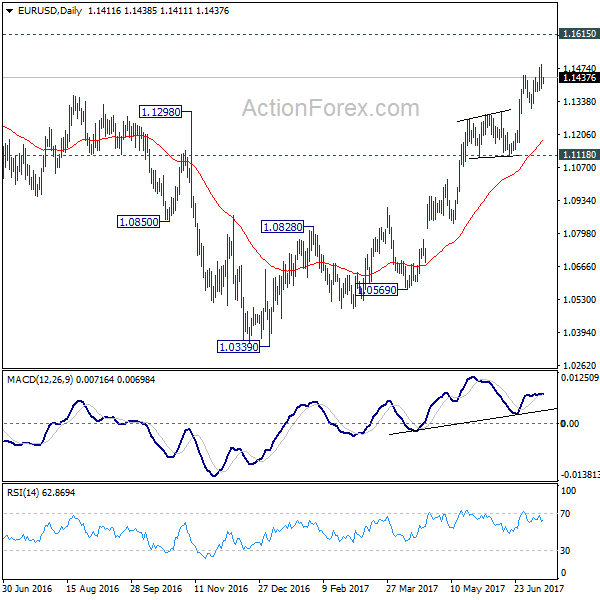
EUR/USD Daily Outlook
Daily Pivots: (S1) 1.1372; (P) 1.1430 (R1) 1.1470; More.....
Intraday bias in EUR/USD remains neutral for the moment. With 1.1382 minor support intact, further rise is expected. Break of 1.1489 will extend recent rally from 1.0339 to 1.1615 key resistance next. On the downside, break of 1.1382 will suggest short term topping, possibly on bearish divergence condition in 4 hour MACD. In such case, lengthier consolidation would be seen before another rally.
In the bigger picture, the firm break of 1.1298 resistance further affirm medium term reversal. That is an important bottom was formed at 1.0339 on bullish convergence condition in weekly MACD. Further rise would be seen to 55 month EMA (now at 1.1763). Sustained break there will pave the way to 38.2% retracement of 1.6039 (2008 high) to 1.0339 (2017 low) at 1.2516 next. This will now remain the favored case as long as 1.1118 support holds.
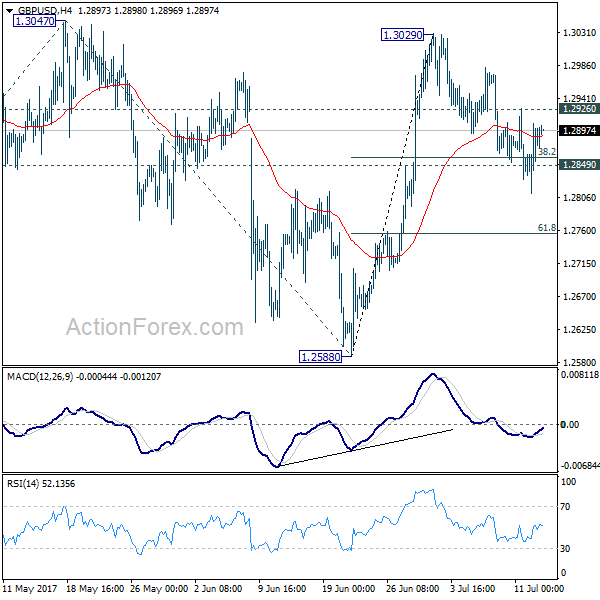
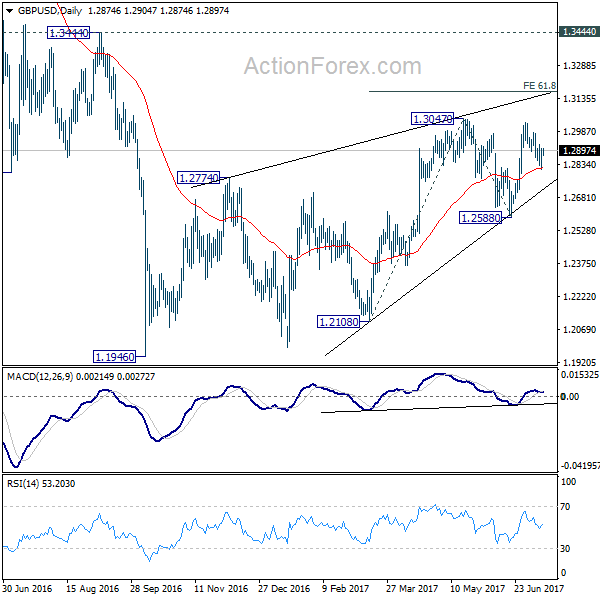
GBP/USD Daily Outlook
Daily Pivots: (S1) 1.2827; (P) 1.2867; (R1) 1.2922; More...
Intraday bias in GBP/USD remains neutral first. On the upside, break of 1.2926 minor resistance will indicate completion of pull back from 1.3029. Intraday bias would then be turned back to the upside for 1.3047 resistance. Break will target 61.8% projection of 1.2108 to 1.3047 from 1.2588 at 1.3168 next. However, sustained break of 1.2849 will dampen our near term bullish view and turn focus back to 1.2588 support.
In the bigger picture, overall, price actions from 1.1946 medium term low are seen as a corrective pattern that is still in progress. While further upside is now in favor, overall outlook remains bearish as long as 1.3444 key resistance holds. Larger down trend from 1.7190 is expected to resume later after the correction completes. And break of 1.2588 will indicate that such down trend is resuming.
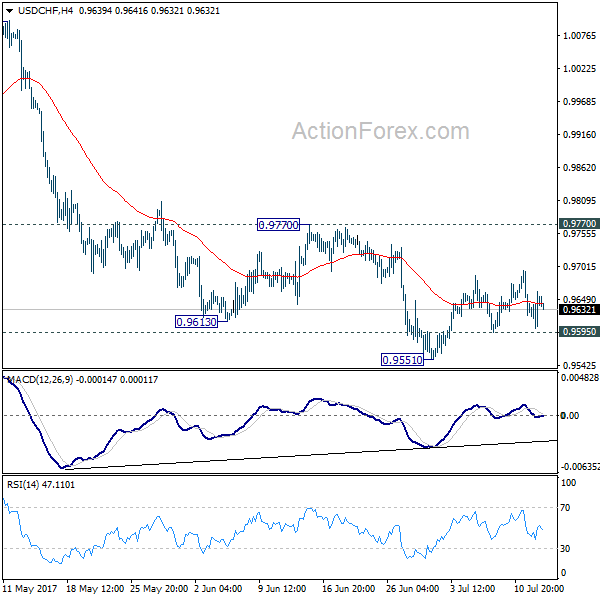
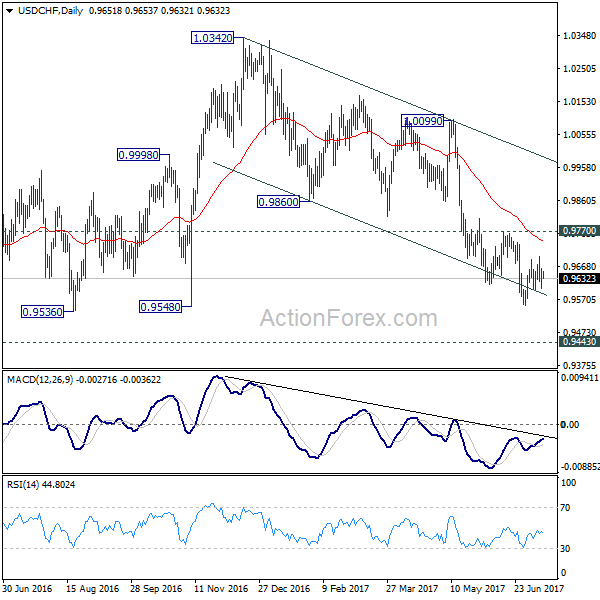
USD/CHF Daily Outlook
Daily Pivots: (S1) 0.9616; (P) 0.9639; (R1) 0.9676; More......
Intraday bias in USD/CHF remains neutral for the moment. Consolidation from 0.9551 is still in progress. In case of another rise, upside is expected to be limited by 0.9770 resistance and bring fall resumption. Below 0.9595 minor support will turn intraday bias back to the downside. In such case, USD/CHF should fall through 0.9551 support resume the whole fall from 1.0342 and target 0.9443 key support level next. We'd expect strong support from there to bring rebound. Meanwhile, firm break of 0.9770 will indicate near term reversal, on bullish convergence condition in 4 hour MACD.
In the bigger picture, USD/CHF is still bounded in medium term range of 0.9443/1.0342 for the moment. Consolidative trading would likely continue and medium term outlook remains neutral. Break of 1.0342 key resistance is needed to confirm underlying bullish momentum in the pair. Meanwhile, downside attempts should be contained by 0.9443 key support level. However, sustained break of 0.9443 will carry larger bearish implication and target 0.9 handle.
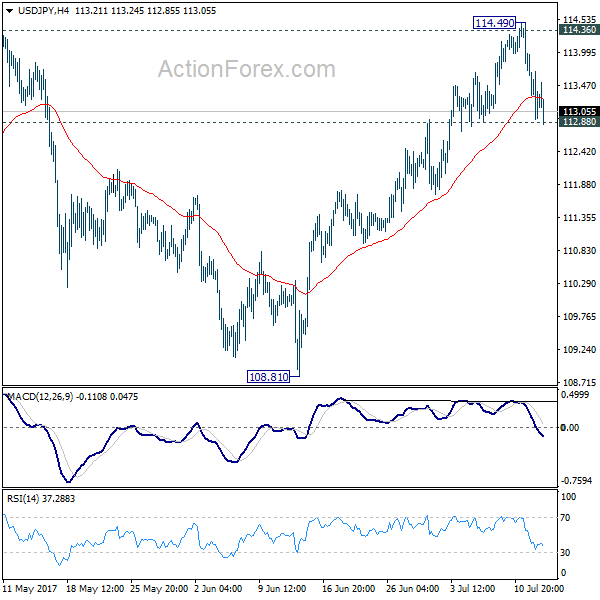
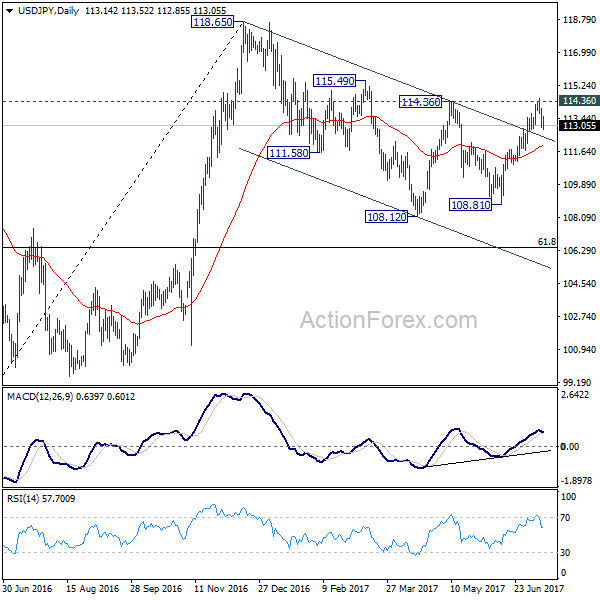
USD/JPY Daily Outlook
Daily Pivots: (S1) 112.73; (P) 113.35; (R1) 113.77; More...
USD/JPY is still holding on to 112.88 support so far and intraday bias remains neutral first. Firm break of 112.88 will argue that rebound from 108.81 has completed at 114.49 after being rejected by 114.36 key near term resistance. That would also argue that the correction from 118.65 is still in progress. In such case, intraday bias will be turned back to the downside for 55 day EMA (now at 111.98). On the upside, decisive break of 114.36 resistance will confirm that corrective pull back from 118.65 has completed at 108.12. In that case, further rally would be seen to retest 118.65.
In the bigger picture, the corrective structure of the fall from 118.65 suggests that rise from 98.97 is not completed yet. Break of 118.65 will target a test on 125.85 high. At this point, it's uncertain whether rise from 98.97 is resuming the long term up trend from 75.56, or it's a leg in the consolidation from 125.85. Hence, we'll be cautious on topping as it approaches 125.85.
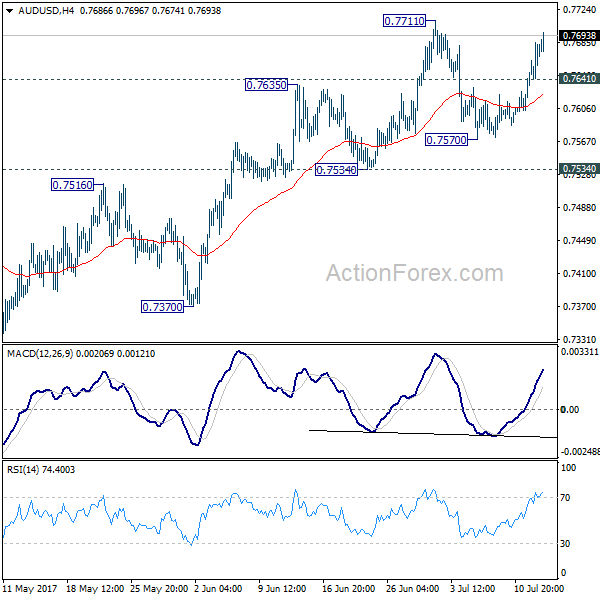
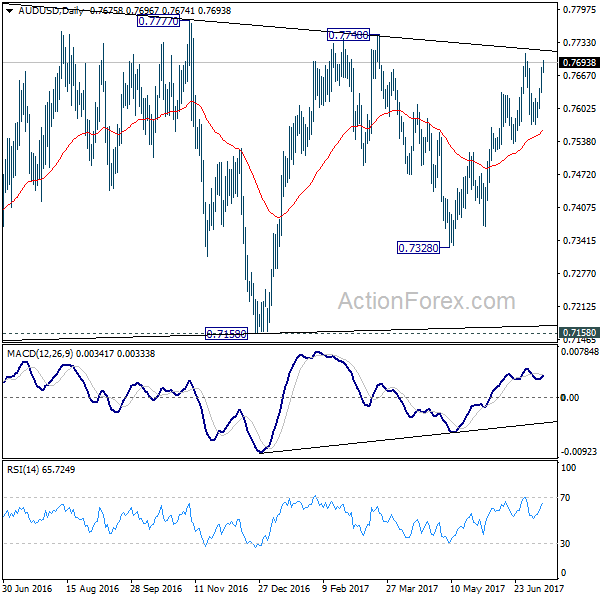
AUD/USD Daily Outlook
Daily Pivots: (S1) 0.7645; (P) 0.7664; (R1) 0.7696; More...
Intraday bias in AUD/USD remains on the upside for 0.7711. Break there will extend the rise from 0.7328 through 0.7748, possibly to 0.7833. Still, there is no clear sign of range breakout yet. Hence, we'd be cautious on topping again as it approaches medium term fibonacci level at 0.7849. On the downside, below 0.7641 minor support will extend the consolidation pattern from 0.7711 with another fall. But outlook will remains mildly bullish as long as 0.7534 support holds.
In the bigger picture, we're still treating price actions from 0.6826 low as a corrective pattern. And, as long as 38.2% retracement of 0.9504 to 0.6826 at 0.7849 holds, long term down trend from 1.1079 is expected to resume sooner or later. Break of 0.6826 low will target 0.6008 key support level. However, firm break of 0.7849 will indicate that rise from 0.6826 is developing into a medium term rebound, rather than a sideway pattern. In such case, stronger rise should be seen to 55 month EMA (now at 0.8082) and above.
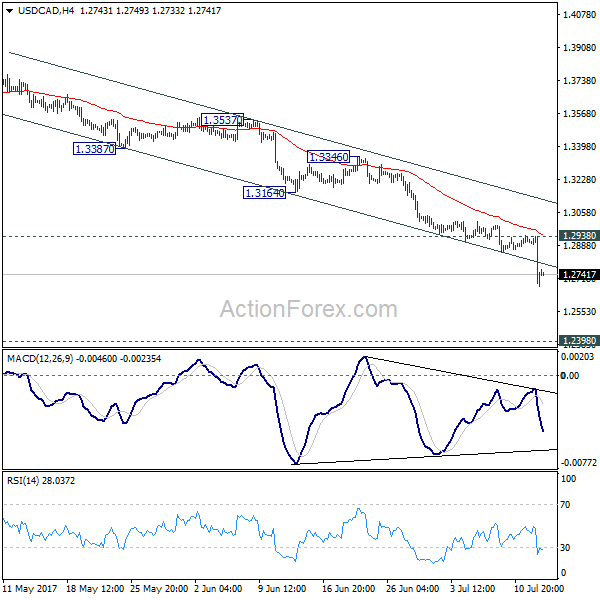
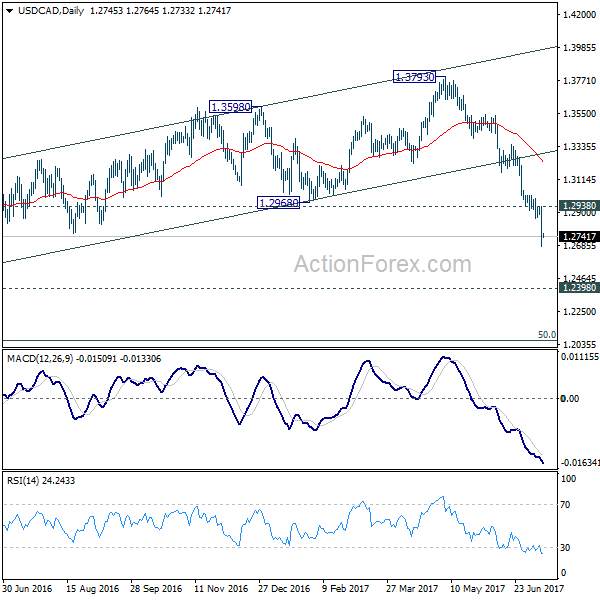
USD/CAD Daily Outlook
Daily Pivots: (S1) 1.2884; (P) 1.2914; (R1) 1.2943; More....
USD/CAD's fall from 1.3793 is still in progress and extends to as low as 1.2679 so far. The break of near term channel support indicates downside acceleration. Intraday bias stays on the downside. Current decline should target a test on 1.2460 low. On the upside, break of 1.2938 resistance is needed to indicate short term bottoming. Otherwise, outlook will remain bearish in case of recovery.
In the bigger picture, price actions from 1.4689 medium term top are seen as a correction pattern. The second leg should have finished at 1.3793. Break of 1.2460 will extend such correction to 50% retracement of 0.9406 to 1.4869 at 1.2048. At this point, we'd look for strong support from there to contain downside and bring rebound. However, firm break there will target 100% projection of 1.4689 to 1.2460 from 1.3793 at 1.1564.
Dovish Yellen Sent Stocks Higher and Pressured Dollar, Canadian Marches On Post- BoC
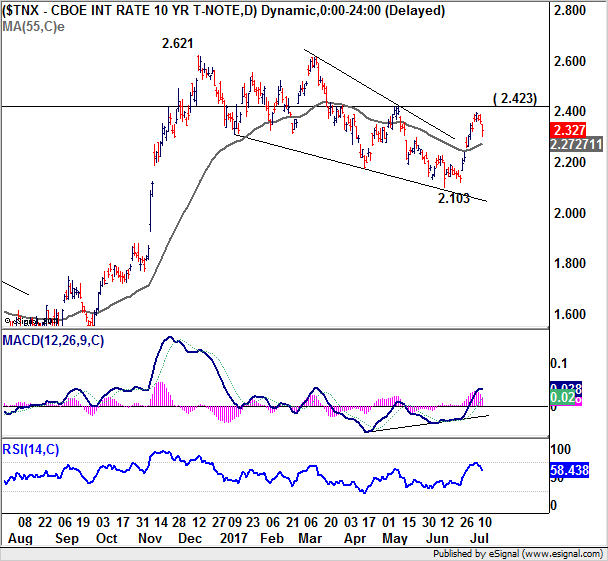
Dollar trades broadly lower as markets generally percevied Fed chair Janet Yellen's testimony as a dovish one. DOW ended up 123.07 pts, or 0.57% at record high of 21532.14. Meanwhile, 10 year yield closed sharply lower by -0.035 at 2.327. A focus today is on 112.88 in USD/JPY which could trigger further selling of the greenback on breaking. EUR/USD retreated quite sharply overnight but is holding on to 1.1382 minor support, and thus maintains near term bullishness. And of course, USD/CAD is set to extend it's near term down trend towards 1.2460 low as the Loonie is boosted by BoC's neutral rate hike and rebound in oil price.
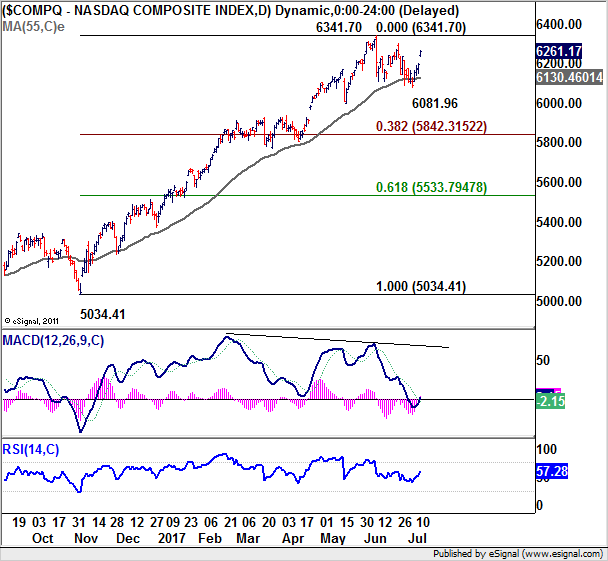
A key development in US was the strong 1.1%, 67.87 pts, rise in NASDAQ which closed at 6261.17. Such rebound argues that the consolidation from 6341.70 has possibly completed at 6081.96. Strong support was seen from 55 day EMA. The structure from 6341.71 also looks corrective. Hence, while bearish divergence condition is seen in daily MACD, the larger up trend isn't over yet and break of 6341.70 could be seen soon.
10 year yield seemed to have faced strong resistance below 2.423 and risks being rejected from there. Focus is turned back to 55 day EMA (now at 2.272). Sustained break there will likely extend the corrective pattern from 2.621 with another fall through 2.103 support. And, falling yield plus rising stocks will argue that markets are expecting Fed's monetary policy to stay loose for longer.
Fed Yellen: Rates no need to rise much futher to reach neutrality
Judging from the reactions from the markets, Fed chair Janet Yellen's testimony was seen as dovish. The key takeaway is that in her view, the federal funds rate "would not have to rise all that much further" to reach a neutral level. And, she also warned that "considerable uncertainty always attends the economic outlook," and "there is, for example, uncertainty about when -- and how much -- inflation will respond to tightening resource utilization." Overall, the Fed "continues to expect that the evolution of the economy will warrant gradual increases in the federal funds rate over time". And the unwinding of the USD 4T balance sheet is likely to start this year.
Separately, Kansas City Fed President Esther George echoed that Fed will start trimming the balance sheet in the "near future". She warned that "holding long-term rates below the level that they might otherwise move to naturally, amidst improving economic fundamentals, risks creating financial imbalances." And, "the failure of longer-term rates to move up with short-term rates during this normalization cycle illustrates the risk for a disruptive repricing of assets as markets adjust to a more normal policy stance,"
BoC hike could be start of a tightening cycle
BoC raised overnight rate target by 25bps to 0.75% as widely expected. That's the first rate hike in 7 years. The Bank Rate and the deposit rate rose to 1% and 0.5% respectively. More importantly, BoC concluded in the statement that "future adjustments to the target for the overnight rate will be guided by incoming data as they inform the Bank's inflation outlook. That is, the central bank is open to further rate hikes depending on data. We expect today's rate hike marks the beginning of BOC's monetary normalization path, though any further increase would be gradual and data-dependent. More in BOC Hikes Rate to 0.75%, First in Seven Years.
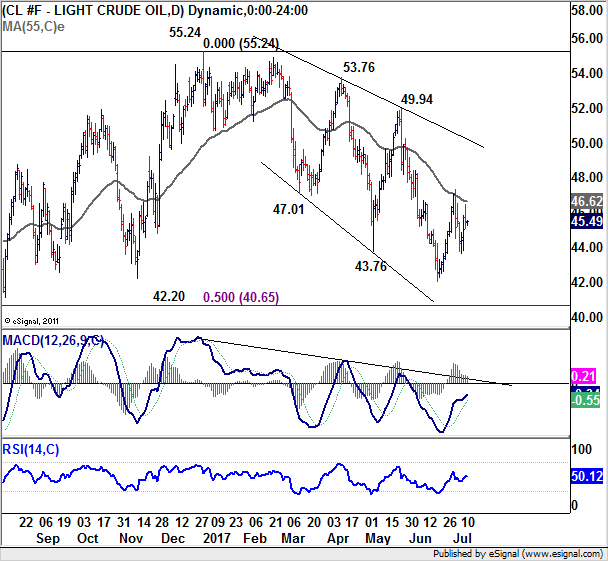
Canadian Dollar is additionally boosted by the rebound in oil price. EIA reported that domestic crude supplies dropped -7.6b barrels for the week ended July 7. That's more nearly trip of the expected of -2.6b barrels decline. WTI crude oil jumped to as high as 46.48. Technically, it's still bounded below falling 55 day EMA. And the corrective fall from 55.24 is in favor to extend lower to 50% retracement of 26.05 to 55.24 at 40.65.
BoE hawk McCafferty pushed for balance sheet unwinding
BoE hawk Ian McCafferty said in an interview that the central bank should start considering to unwind its GBP 435b assets from the quantitative easing program. While there has been talks about rate hikes, this is so far the first voice regarding unwinding. Meanwhile, McCafferty maintained his views that interest rates should be raised and would continue to vote for a hike in August meeting. He cited the solid job data released earlier this week as the support for his view. Regarding inflation, he expects it to peak at around 3% while consumer growth will slow.
French President Macron urged deeper integration
In Eurozone, French President Emmanuel Macron urged deeper integration in the Eurozone. He pointed out that "a part of German competitiveness is due to the dysfunctionalities of the euro zone, and the weakness of other economies." While Germany has a strong economy, Macron said that it has "demographic weaknesses, economic and trade imbalances with its neighbors and shared responsibilities to give the euro area the future it deserves." It's believed that Finance ministers of Germany and France would present a roadmap for harmonization of their corporate taxes at a joint cabinet meeting on Thursday.
On the data front
Australian consumer inflation expectation rose 4.4% in July. China trade surplus widened to USD 42.8b, CNY 294b in June. UK RICS house price balance dropped to 7 in June. Inflation data will be the key focus today. Germany will release June CPI final. Swiss will release PPI. Canada will release new housing price index. US will feature PPI and jobless claims.
USD/CAD Daily Outlook
Daily Pivots: (S1) 1.2884; (P) 1.2914; (R1) 1.2943; More....
USD/CAD's fall from 1.3793 is still in progress and extends to as low as 1.2679 so far. The break of near term channel support indicates downside acceleration. Intraday bias stays on the downside. Current decline should target a test on 1.2460 low. On the upside, break of 1.2938 resistance is needed to indicate short term bottoming. Otherwise, outlook will remain bearish in case of recovery.
In the bigger picture, price actions from 1.4689 medium term top are seen as a correction pattern. The second leg should have finished at 1.3793. Break of 1.2460 will extend such correction to 50% retracement of 0.9406 to 1.4869 at 1.2048. At this point, we'd look for strong support from there to contain downside and bring rebound. However, firm break there will target 100% projection of 1.4689 to 1.2460 from 1.3793 at 1.1564.
Economic Indicators Update
| GMT | Ccy | Events | Actual | Forecast | Previous | Revised |
|---|---|---|---|---|---|---|
| 23:01 | GBP | RICS House Price Balance Jun | 7% | 15% | 17% | |
| 01:00 | AUD | Consumer Inflation Expectation Jul | 4.40% | 3.60% | ||
| 03:22 | CNY | Trade Balance (USD) Jun | 42.8B | 43.2B | 40.8B | |
| 03:22 | CNY | Trade Balance (CNY) Jun | 294B | 273B | 282B | |
| 06:00 | EUR | German CPI M/M Jun F | 0.20% | 0.20% | ||
| 06:00 | EUR | German CPI Y/Y Jun F | 1.60% | 1.60% | ||
| 07:15 | CHF | Producer & Import Prices M/M Jun | 0.00% | -0.30% | ||
| 07:15 | CHF | Producer & Import Prices Y/Y Jun | 0.00% | 0.10% | ||
| 12:30 | CAD | New Housing Price Index M/M May | 0.20% | 0.80% | ||
| 12:30 | USD | PPI M/M Jun | 0.00% | 0.00% | ||
| 12:30 | USD | PPI Y/Y Jun | 1.90% | 2.40% | ||
| 12:30 | USD | PPI Core M/M Jun | 0.20% | 0.30% | ||
| 12:30 | USD | PPI Core Y/Y Jun | 2.00% | 2.10% | ||
| 12:30 | USD | Initial Jobless Claims (JUL 08) | 245k | 248k | ||
| 14:00 | USD | Fed Chair Yellen Testifies Before Senate Banking Panel | ||||
| 14:30 | USD | Natural Gas Storage | 72 | |||
| 18:00 | USD | Monthly Budget Statement Jun | -16.2B | -88.4B |
Market Morning Briefing: A Hint Of Profit Taking Has Been Seen In Euro As It Is Trading Below 1.1460...
STOCKS
Dow (21532.14, +0.57%) has been re-testing the crucial 21500-21550 levels since the last few weeks but has failed to see any sharp rejection that could push it below 21300. While the conflict between the bulls and bears go on, we may wait for price confirmation for more clarity on further direction. Only on a sustained break above 21550-21600 can we shift our focus on higher levels ; else a fall back towards 21300 and lower is possible.
Dax (12626.58, +1.52%) finally broke above 12500 and rallied to close above 12600. Initial levels of 12750-12800 could be tested in the next few sessions.
Shanghai (3200.90,+0.10%) continues to remain in the up channel and could target. 3220-3240 possibly next week. Overall trend remains up.
Nikkei (20128.88, +0.15%) is stuck within 20270-20000 levels and the price action seems to be in a contraction mode. A break above 20200 to target 20400 is possible in the coming sessions. Overall there is enough room on the upside just now which keeps the bullish possibility intact.
Nifty (9816.10, +0.31%) inched up yesterday to close at higher levels above 9800. We keep our bullish view towards 9850-9900 intact for the near term.
COMMODITIES
Gold (1221) and Silver (15.92) are trading marginally higher to keep the upside possibilities open. The recent trading range could be 1188-1231 for Gold and 15.20-16.10 for Silver. Both of them are in a neutral trading zone thus we will be assured of strength in Gols and Silver only when a firm and sustainable closing above 1231 and 16.50 are made by both of them. Otherwise a failure to close above those levels may push them towards 1200 and 15.20 levels respectively.
Muted price action had been seen in Copper (2.68), trading within the same range of 2.66-2.78. Only above 2.78 higher resistances of 2.85 can come into consideration. In the medium term 2.55-57 are going to be a strong support and we will remain bullish while it is trading above those levels.
Brent (47.65) and WTI (45.41) are hovering around their pivots of 47.76 and 45.60 of their trading range of 44-50 and 42-48 respectively. There is a decent chance that these pivots might hold, producing a fresh decline towards 44 (Brent) and 42 (WTI) regions.
In the bigger picture, market is continuously ignoring the shortage (-7.3, -3.2 and -6.3 M B) in U.S weekly crude inventories for last three weeks. This could be resulted in consolidation at lower levels with a fresh upside rally starting from the 45/46 (Brent) and 43/44 (WTI) regions that might have potential to break above 48 and 47 in the medium term.
FOREX
A hint of profit taking has been seen in Euro (1.1438) as it is trading below 1.1460 regions.We had mentioned yesterday that EURO could faces crucial long-term Resistance in the 1.1520-40 region now. Market sentiment is turning very bullish,therefore, it would be good to be cautious at these levels.
Dollar Index (95.16) had moved lower , as expected. The trend is strongly bearish, targeting 94.75 at least, possibly lower.
Euro-Yen (129.17) came off sharply yesterday and could come down towards 128.00-127.40 in the next 2-sessions before again moving higher towards 129-130. Corrective phase may continue for now.
Dollar-Yen (112.96) seems to have possibly completed a near term high at 114.50 and could be heading towards 112 soon. While below 113.30, the bears may continue to dominate price action.
Pound (1.2899) has bounced as expected and could move up towards 1.30 in the next few sessions. Immediate support is visible near 1.2800. Near term could be bullish.
The Aussie (0.769) has been rising for the past few sessions but is heading towards important resistance near 0.7700-0.7730 levels from where a short dip is possible. Only if the resistance fails to produce any immediate rejection can we look for a rise towards 0.78 or higher. Watch important resistance zone of 0.7700-0.7730.
Dollar Rupee (64.5375) made an intra-day high of 64.5750 before closing at slightly lower levels. A rise to 64.70/75 is still on the cards for the coming sessions.
INTEREST RATES
The US yields have come off sharply and are headed to lower levels. The 5YR (1.88%), 10YR (2.33%) and the 30Yr (2.88%) are all trading lower and could head towards 1.80%, 2.28% and 2.80% in the coming sessions. Near term is likely to see a fall in the yields.
The German-US 10Yr (-1.82%) and the German-US 2Yr (-1.97%) still show some scope of moving higher in the near term while the UK-US 10Yr (-1.07%), German-Japan 10YR (0.43%) and the US-Japan 10YR (2.24%) are looking weak and could see some fall in the near term.