
Sample Category Title
Yellen’s Testimony Fails To Revive The Greenback
Yellen's testimony went mostly as expected - with lukewarm optimism of the economy, a downplay of soft data and talk of gradual rises. Whilst the content was mostly a re-run of recent Fed statement, Yellen also added she expects the Fed rates would not have to rise much further and that balance sheet reduction would 'play out smoothly'.
It is the balance sheet commentary and her expectation that 'no financial crisis is likely to occur in our lifetimes' that make us question the due diligence and intentions here. It's plausible that one would tend to play down financial risks or present the US economy with a slight upwards bias if you suspected it may be your last testimony. And the uncharacteristically calm and dignified atmosphere at this hearing suggested Yellen's suspicions were widely felt.
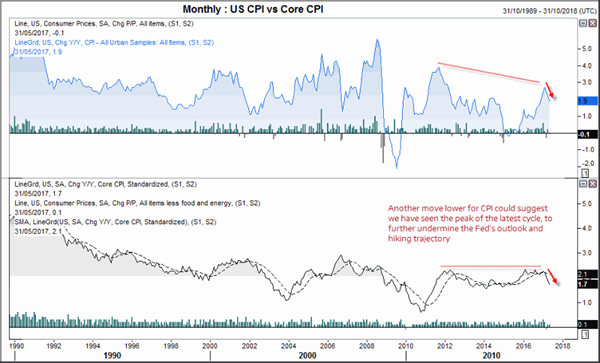
Inflation data on Friday will be closely watched by traders, as another disappointment could suggest we have seen the cycle peak and further downside is ahead. Or at least, this is how traders would likely react. With core CPI moving to 1.7% after getting tantalisingly close to, yet without hitting, 2%. That the Fed were speaking of allowing the economy to overshoot their 2% target last year sounded dubious at the time, yet now inflation moves lower seems almost laughable. Yet we continue to suspect that the real reason they want to raise rates is to allow them rom to cut to at least appear as though they are doing something, before reverting to QE4. The same could be sad for the balance sheet they want to trim, as this can always move higher if required in future.
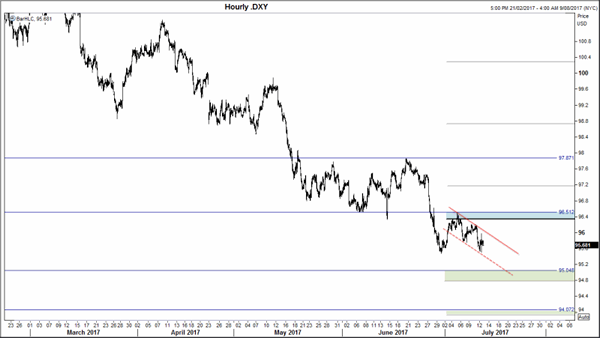
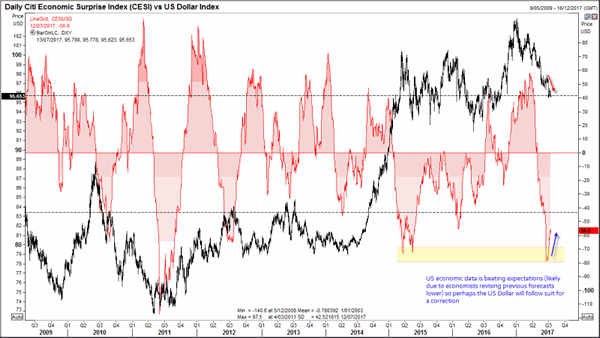
The US Dollar closed the session with a spinning top Doji, which essentially means we had a spike higher and lower, yet finished around the same level as the open. Considering this is when the Whitehouse dominated headlines again for non-policy reasons and Yellen delivered an ad-hoc speech, then this may prove to be a near-term sign of strength. Yet, as we remain below the monthly pivot and the dominant trend is firmly lower, a break of the 95.47 low is the favoured outcome over the coming sessions.
The intraday chart reveals a bearish channel which began at the monthly pivot which began at the monthly pivot. If this holds and helps DXY drift lower, then EURUSD and AUD are poised to push higher form here. The region around 95 houses a likely support level which comprises of the Sep '16 low and monthly S1. If we reach these levels it will likely coincide with EURUSD hitting 116 and AUD 78c.
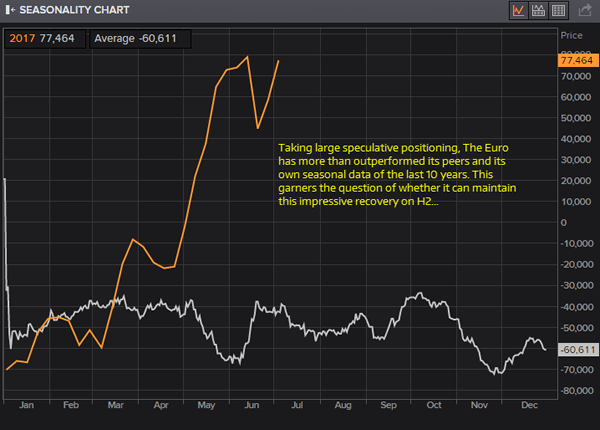
Much of the recent weakness of the US Dollar can be attributed to the strengthening of the Euro. TO further highlight how uncharacteristic this momentum is, we have plotted the large speculator positioning as a 10yr seasonal chart (white line) and plotted it next this year's net long positioning (orange). Whilst Jan to March tend to move higher anyway, it usually moves sideways in April and retraces in May. Yet instead it advances in March, end of April and all of May. The question we now raise is whether it can maintain this level of bullish repositioning for H2. Technically and fundamentally we think it can finish the year high than it is now, yet there is likely you be a large correction or two along the way. As we are yet to see one, then it is something to consider as we get further towards August.
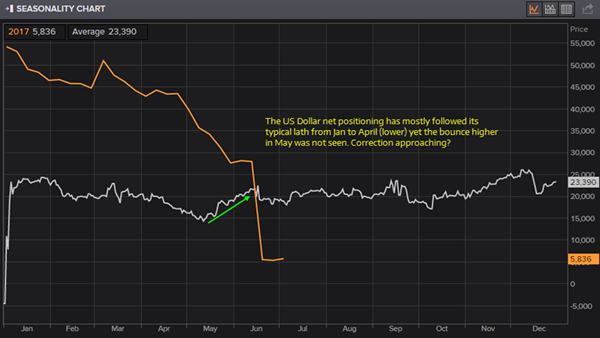
The US Dollar has mostly followed its 10-year path by moving lower this year, only we did not see a rebound in May. As shorting the Dollar is becoming a popular theme and DXY reaches the next round of support zones, then it is not impossible to believe a rebound could be on the cards.
BoC Treat Markets To A Hawkish Hike
The Canadian Dollar was where the action was at on the currency space overnight, when the Bank of Canada (BoC) threw another pleasant surprise to market with a hawkish hike.
Fears of a dovish hike when higher growth inflation expectations were expected, prompting traders to anticipate the next hike. At 0.75%, it was their first rise since September 2010 and followed on from its longest and least eventful easing cycle in history (2 cuts in 7 years).
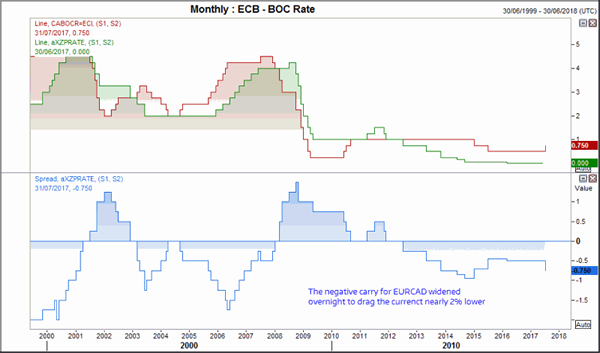
The Canadian Dollar jumped higher across the board but most surprisingly, enjoyed its best run against the mighty Euro. Plummeting -1.8% by the close, EURCAD experienced its most bearish session since Jan 2018. Technicals could partly explain the bearish move as many Euro crosses had stalled at technical resistance levels, making profit taking tempting for short-term traders. Yet with ECB's deposit rate remaining at -0.4%, the negative carry for Euro has now widened to -75 basis points.
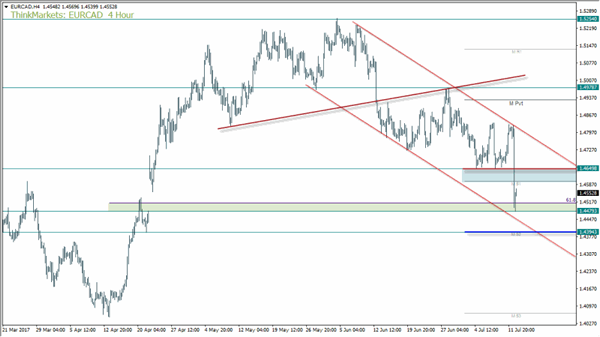
We'll admit to the moves on EURCAD catching us a little off guard. Whilst losses following the meeting were not rules out, it was the magnitude of them which came as the surprise. The clear and decisive break of 1.4650 took it from the top of the channel and almost to its lower boundary, where is found support around the 61.8% retracement and the close prior to the French election gap higher. Due to the bearish momentum of the preceding move, we prefer to fade into rallies below 1.4650 for near-term short trades. If data continuous to support CAD and / or if Euro data cools a little, this may help it move below 1.440. For now, 1.440 is the near-term target but we are not yet ready to write of EURCAD just yet as we think ECB are yet to catch up with the curve and begin tightening.
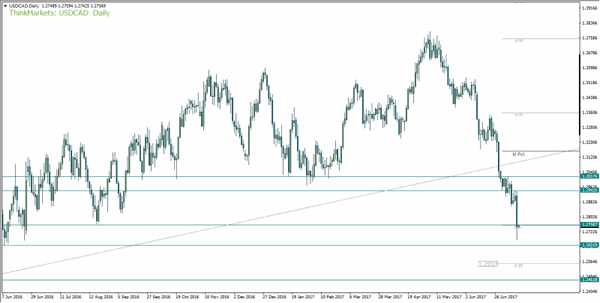
The -1.3% close was its worst since March '16, yet the intraday low found itself down by 1.8% at one point. With no meaningful signs of bullish divergences forming on H4 or H1, further downside is the more likely route from here. With US CPI data out tonight, this too serves as a potential weak spot for the Greenback and cold simply send USDCAD lower towards 1.6520 support. Of course, at some point we are to see a correction of some sort, but price action from the 2017 is clearly impulsive, which means we are to see it break below 1.2464 low and continue its decline. So perhaps a correction may take place at or above this key swing low, with the monthly S2 at 1.2552 making a likely interim support level. Due to the bearish momentum from the 2017 high, we could seek to short rallies all the way up to 1.30 to assume an eventual break below 1.2464 as the year progresses.

NZD teeters on the edge of the bullish trendline from the 2015 low. This may prove a tough level to crack upon first attempt, although also going against significant downside for NZDCAD is the 1% positive carry for the cross. Yes, it has narrowed by 25bps and the spread could shrink to 0.75% over the coming months, but if inflation stabilizes for NZ then expectations for a hike could quickly surface here too. For now, if we are to see a break of the trendline then the 50% and 0.908 low make a likely stalling point from a technical perspective.
View the full BoC statement here
- The recent softness in inflation is assumed to be temporary
- The economy has been robust, fuelled by household spending
- Significant amount of economic slack has been absorbed
- Growth is broadening across industries and regions
- Household spending will likely remain solid in the months ahead
- Exports should make an increasing contribution to GDP growth
- The Bank estimates real GDP growth will moderate further
- Output gap is now projected to close around the end of 2017
- The Bank's three measures of core inflation all remain below 2 per cent.
- Factors behind soft inflation appear to be mostly temporary
- The Bank expects inflation to return to close to 2 per cent by the middle of 2018
- The current outlook warrants today's withdrawal of some of the monetary policy stimulus in the economy
- Future adjustments to the target for the overnight rate will be guided by incoming data
AUD/USD Trading In The Green, NZD/USD Registered An Amazing Jump, GOLD Still In Range
AUD/USD – trading in the green
The currency pair increased significantly on Wednesday and reached an important static resistance, maintains a bullish perspective and could approach fresh new highs if the USDX will decrease again. Price was strongly bullish and resumed the last day’s rebound, is approaching an important downtrend line, where could find a strong supply again.
The greenback remains under pressure on the short term as the USDX dropped below the 96.00 psychological level again, the index is trading near the 95.80 level and tries to make a consolidation movement in the upcoming days.
We may still have another leg higher on the USDX if the rate will make an accumulation move, could still happen as long as is trading above the 95.45 previous low.
Price reached the 0.7675 static resistance, should reach the black downtrend line as well as long as is trading within the minor ascending pitchfork’s body. Only a breakdown from this pitchfork will signal an exhaustion on the short term. Resistance can be found also at the 0.7755 static obstacle, but we’ll see how the Aussie will react after the Australian and the Chinese data will be released.
The Chinese Trade Balance could decrease from 282B to 273B in June, while the USD-Denominated Trade Balance could jump from 40.8B to 42.9B. Most likely we’ll have a high volatility in the United States trading session as the US is to release high impact data, the fundamental factors will take the lead and will move the price, so you should be careful not to suffer a heavy loss.
NZD/USD registered an amazing jump
Price increased sharply on Wednesday and recovered after the Tuesday’s impressive drop, but reached a very strong resistance level that has paused the bullish momentum. Has increased, but remains under pressure on the short term, could still reach new lows before will resume the upside movement again. Personally, I believe that is too overbought to increase more at this moment, is trapped below a strong dynamic resistance (support turned into resistance).
If you’ll take a look at the daily chart you’ll notice that has found support much above the warning line (wl2), right on the median line (ml) of the minor descending pitchfork. Right now is pressuring the downtrend line, which represents a strong dynamic obstacle, a further increase will be confirmed only after a valid breakout above the upper median line (uml) of the minor descending pitchfork and above the 0.7277 level.
GOLD still in range
Price increased and resumed the last days’s minor bounce back, climbed as much as 1225.75 level, where has found strong resistance again. Could resume the minor throwback if the USDX will fail to climb again above the 96.00 psychological level.
Price remains trapped between the 23.6% and the 50% retracement levels, surged after the false breakdown from this extended sideways movement, but the sliding line (SL) represents a strong dynamic resistance. An increase towards the upper median line (uml) of the descending pitchfork if favored after the failure to reach the median line (ml).
A Tale Of Two Central Banks: Perfunctory( FED) Vs. Actionable( BOC)
A Tale of Two Central Banks: Perfunctory( FED) vs. Actionable( BOC)
While nothing groundbreaking in Chair Yellen perfunctory testimony, she unambiguously drew attention to inflation as the critical determinant of Fed rate hikes. Given the market's tepid inflation expectations, traders quickly repriced an even more cautious rate hike cycle as Dec odds fell to 50% from ~70% on the view that her written testimony was dovish..Forex traders immediately reached for yield while equity markets took flight on the dovish Fed expectation. Nothing better for investment sentiment than Dr Yellen providing an upbeat economic assessment with a tepid inflation outlook. One of those days you can have your cake and eat it.
Equity markets were not all that took flight, the Loonie ( Canadian Dollar) soared after Bank of Canada Governor Poloz delivered an unexpectedly “ hawkish “ hike that increased the odds dramatically for a longer rate hike cycle.Traders will view this as very hawkish and should be more inclined to leg into long CAD while institutional investors might flock to CAD seizing the opportunity to catch a rare and actionable policy shift from a central bank.With a little help from WTI oil, I think the Loonie could test 1.2200 before year end.
The Carry Trade landscape had deteriorated of late on the back of the mini-bond market tantrums as a hawkish central bank narrative was unfolding last week. However, Tuesday's comments by Fed President Harker and Governor Brainard were broadly dovish (worrying about persistently soft inflation) saw US Treasury yields fall in response and continued to rally throughout Yellen's congressional testimony. So the chase for yield is back on as EMFX high-yielders like TRY and ZAR outperformed on a dovish Fed outlook.
Since inflation will drive the Fed mandate, Friday's CPI data remains exceptionally important as the USD remains particularly vulnerable to another inflationary wobble. With the Fed back in a wait-and-see mode, the enormity of Friday's CPI print can not be overstated. If the data produces a fourth consecutive miss, it brings into question the Fed's contention that inflation is transitory. US yields would unquestionably rally, and the bond rally extension could leave the dollar in world of hurt
EURO
I think it a safe to say that if the Feds are concerned about inflation ECB will err likewise. Keeping in mind that Eurozone inflation has edged further below the European Central Bank's target in June due to a sharp decrease in the rate of energy price inflation. And with sagging oil prices unlikely to rebound significantly higher anytime soon, traders took profits and drove the EURO below 1.1400 briefly before finding a happy medium above 1.1425 as dealers take pause for now. It's unlikely the Euro reverse course, but traders are now awaiting the next round of ECB rhetoric.But I also think it's safe to say the rates selloff (driven by long unwinds) is done for now.
Japanese Yen
While the short-term picture remains uncertain as markets whip around on the back of US yields, BOJ accommodation and a high bounce in risk appetite should be supportive of USDJPY long term. But with US CPI looming I suspect dealer will be more inclined to book what every profit and extremely but reluctant to enter dollar longs so were unlikely to see too much of a bounce higher today.
Australian Dollar
The domestic calendar is very light, so the AUD is benefiting from the broader USD weakness, a bounce in risk sentiment and a jump in oil prices after a bigger than expected drop in US stockpiles are playing positively into the Aussie basket.
USD/CAD Canadian Dollar Rises After BoC Hikes Interest Rate
The Canadian dollar traded higher on Wednesday after the Bank of Canada (BoC) raised the benchmark interest rate by 25 basis points to 0.75 percent. The loonie rose to an 11 month high versus the USD after the rate decision announcement. This is the first rate hike in 7 years for the BoC and while markets had priced in a rate hike in July after several hawkish comments from senior policymakers the central bank surprised by the hawkish outlook. GDP estimates for 2017 and 2018 were upgraded and inflation was forecasted to return to close to the 2 percent target in mid 2018.
The Bank of Canada joins the U.S. Federal Reserve as the only two central banks in the G7 to hike rates but also in dismissing the lack of inflation as temporary. The BoC is also moving to a more data dependant rhetoric but markets still price in another rate hike before the end of the year. The loonie also got support from oil prices who had modest gains after the weekly inventories released by the Energy Information Administration (EIA) showed a larger drawdown than expected. US crude stocks fell by 7.6 million barrels helping crude prices improve by 0.88 percent.
The hawkish BoC was a surprise, but the neutral tone delivered by Fed Chair Janet Yellen during her testimony to the US Congress also depreciated the USD versus the CAD. The Fed Chair did not deviate from the previous comments from FOMC members who stressed a balance sheet reduction would be started this year, at a gradual pace and that interest rate decisions could not be scheduled but rather dictated by the data. Chair Yellen said that she will serve out her term when questioned about a potential nomination to extend her term by the Trump Administration. Yellen’s term expires on February 2018, with President Trump not a fan of her while he was running for President and Gary Cohn a favourite to replace hear at the head of the Federal Reserve.
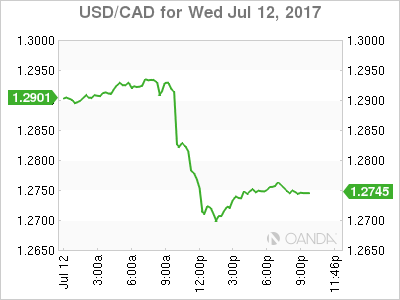
The USD/CAD lost 1.432 percent on Wednesday. The currency pair is trading at 1.2735 after the Bank of Canada (BoC) raised interest rates by 25 basis points as expected. The benchmark rate in Canada is now 0.75 percent and is expected to be 1.00 percent by the end of the year if economic data confirms the current path of growth. The market had already priced in a rate hike in July after the commitment from BoC speakers about the two rate cuts in 2015 having served their purpose of shielding the economy from falling oil prices. The government was equally hawkish that its fiscal stimulus package released in 2016 had boosted growth.
The lack of momentum of the USD dollar from mostly self inflected political wounds opens the way for the loonie to appreciate in the coming months. A big obstacle before the end of the year will be the NAFTA renegotiations slated to begin in late August. The Trump administration would rather tear the agreement and forge a new one, but at the moment its willing to go ahead at the request of Canada and Mexico. If the hard ball tactics of tariffs are any indication it will be a tough negotiation. Mexico has already said that it could walk out if tariffs are part of the new agreement. Regarding timing Mexican officials have said that they expect the negotiations to be done by before the end of 2017 and not drag on for a long time.
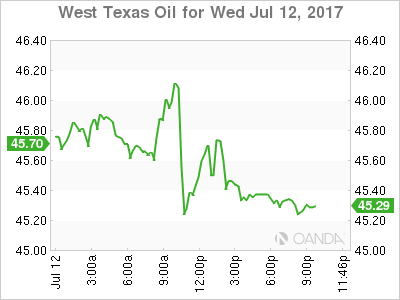
Oil prices rose 0.888 percent in the last 24 hours. The West Texas Intermediate is trading at $45.45 after the release of weekly crude inventories in the US showed a larger than expected drawdown. The API inventories already hinted at a huge drawdown with a 8.1 million barrel drop. The numbers from the Energy Information Administration (EIA) this time were inline with a 7.6 million fall, the biggest decline in 10 months. Ironically this time it was concerns with growing Organization of the Petroleum Exporting Countries (OPEC) production that have limited oil prices form gaining further.
Libya and Nigeria have increased production after several disruptions as they are exempt from the production cut agreement signed between the OPEC and other major producers, but are now likely to be asked to comply. The meeting in Russia on July 24 will not deliver any major changes as its just a compliance meeting not intended to be a summit but Libya and Nigeria have been invited.
Market events to watch this week:
Thursday, July 13
8:30am USD PPI m/m
8:30am USD Unemployment Claims
10:00am USD Fed Chair Yellen Testifies
Friday, July 14
8:30am USD CPI m/m
8:30am USD Core CPI m/m
8:30am USD Core Retail Sales m/m
8:30am USD Retail Sales m/m
Riding The Janet Yellen Wave In USD
In the wake of Janet Yellen's testimony, we've seen the US Dollar sell off this morning.
Yellen basically said that interest rates don't need to move much higher and that the Fed is almost at a neutral point…
Hmm.
The dovish tone seems a bit of a back flip from the last time we decided to listen to what Yellen had to say, raising doubts around the US economy being able to return to the Fed's 2% inflation target.
The promise of more 'cheap money' as interest rate normalisation will likely be delayed further, did however give equities yet another boost (like they needed it). I'll leave it to you to take a look at the SP500 chart that obviously wants to make yet another high.
You can't buy the dip if there isn't a dip to buy!
The cryptosphere's new social media darling indeed. I wonder how much money he will make when they find him and 'donate' to his cause.
Anyway, the other overnight forex market highlight was the Bank of Canada decision to hike rates. The BoC hiked rates by 0.25% to 0.75% as expected, but were openly optimistic about the path forward which threw a spanner in the works of market expectations.
Even thought this was largely expected, USD/CAD still took a hit:
USD/CAD Daily:
But as the technical analysis purist in us once again can see, the drop was caught by a pretty obvious support zone that I've marked on the daily chart above.
Sticking with the Janet Yellen inspired USD theme, yesterday's blog highlighted a potential double top in USD/JPY and we spoke about the opportunities that this level might give for intraday shorters:
USD/JPY 15 Minute:
…and you can see that price is putting in the familiar stepping down pattern that we like to see intraday.
Well take a look at what we actually got:
USD/JPY 15 Minute:
Step, after step, after step of intraday levels to short off! All in the direction of the higher time frame resistance level after it held.
If you took something off that, it's definitely going to be a good end to the week. To the rest…
Best of probabilities to you.
All Aboard The Hike Train, Except One
A Bank of Canada rate hike wasn't even on the radar a month ago but on Wednesday the BOC joined the Fed and is the second major central bank to hike rates. What's more, as we anticipated, it was a hawkish hike and it sent the Canadian dollar much higher. We look at the major global shift ongoing in central banks.
The Bank of Canada hiked rates and didn't give any indication it was a one-and-done or two-and-done scenario. Poloz was more optimistic about the outlook for the economy and inflation than at any time in his tenure.
USD/CAD fell 40 pips on the decision, which was largely expected, and another 200 pips on the outlook. The pair hit the lowest in 13 months and the market is now pricing in a 35% chance of a second hike in September with another hike 71% priced in before year end.
There is an increasing believe in central banking circles that growth is picking up. At the start of the year, the US was supposed to lead the charge but Europe, Japan and others have outperformed while the US could give global growth a second wind of tax reform ever happens.
The market is skeptical to buy into what central banks are touting because they've been wrong before. This time though, the consensus is so broad and it's back by so many different central banks that it's tough to ignore.
Even with lone inflation, central banks are increasingly pointing to growth prospects, financial risks and forecasts for future inflation as reasons to hike. That newfound determination is likely to last, at least through year-end.
The lone holdout is the BOJ, which Nikkei reports is considering downgrading 2017 and 2018 CPI forecasts, likely on energy prices.
What that sets up is a divergence where the yen underperforms nearly everything. One chart worth a close look is CAD/JPY. It broke a major double top Wednesday and has traced out an inverted head and shoulders pattern.
Managing Greed in Forex Trading
If you want to be a successful forex trader, greed is probably the biggest obstacle you'll have to overcome. If you try to get rich on every trade, you'll more than likely end up blowing your account - slow and steady wins the race. It's the great paradox that all traders face - if you want to get rich quickly, you have to do it slowly.
Imagine you're risking your entire balance on a trade. Sure you might win the first two, or three trades and triple your balance a few times, but eventually you'll lose one (and lose everything!). Now what if you were still aiming to make double your risk when you trade, but only risking 1% per trade? Say you place 10 trades in a week and get half of them right - 5 winners/5 losers:
1. -1%
2. +2%
3. -1%
4. -1%
5. +2%
6. -1%
7. +2%
8. +2%
9. -1%
10. +2 %
Total = +5%
Okay, so with your modest $5000 balance that might not be life changing ($250 a week)… but what happens when you compound that return over a year?
5000 x 1.0552 = $63 214
That's a return of over 1260% without ever risking more than 1%. Now work out the return for the following year!
You can get rich relatively quickly through trading Forex, but it doesn't happen overnight. It happens over hundreds, if not thousands, of systematic, high probability and low risk trades. In order to 'get rich quick', you have to be patient - If you truly want to satisfy your greed, keep it in check.
Accepting Losses and Learning to Trade Forex Systematically
Even the best forex traders in the world have losing trades - losing is a part of trading - but how do you react when you lose? How do you feel? If you're angry or sad; chances are you were risking too much, or taking a trade you knew you shouldn't - or both.
Whether looking at a successful breakout trader, trend follower or scalper; there is always a common theme: they all have a trading system and they stick to it. These traders don't get emotional when they take a loss; they were trading according to their rules and the trade didn't work out. They lost a pre-determined amount they were comfortable with and accept it as an unavoidable part of trading. They move on to the next trade, knowing their system is profitable over the long term.
trad
An inexperienced forex trader might open a long position in an uptrend thinking the market is continuing to move up. They didn't put a stop loss on the trade, as they were confident about the overall direction and worried about getting needlessly stopped out. They think "I'll exit if it moves against me" … Bearish news breaks and the market quickly move 100 pips against them. They are now looking at a 100 pip loss when it could have been limited to a fraction of that.
Now what? The market snaps back 50 pips. The inexperienced trader is relieved "maybe it's going back up?!". BAM! classic 50% retrace before continuation: the market falls another 100 pips. This is too much for our trader; he finally cuts the trade at the lows, losing 150 pips. Over the next few sessions the pair recovers to his original entry and beyond, in line with the trend. Did they do the right thing, cutting at -150? Maybe - it well could have continued to fall.
The fact is, our trader should have never been in this position in the first place and was forced to make a less than optimal decision. If they'd had a clear exit strategy in place, there would have been no question about what to do. Their stop loss would have been hit or they would have exited manually, (yet systematically) for a much smaller loss.
Whether your entries are discretionary or systematic, you should always have a clear exit plan for each and every trade. Don't be left saying "What do I do?"
Plan your exit and react accordingly.
Bank of Canada Raises Rates for the First Time Since 2010
Highlights:
- The Bank of Canada raised their trend-setting overnight rate to 0.75% from 0.50%. Rates were previously lowered by 50 basis points in 2015 in response to the oil price shock.
- The bank's 2017 GDP growth forecast was revised up to 2.8% thanks to a larger increase in consumer spending. Growth is seen slowing to 2.0% next year as a more moderate add from consumers is only partially offset by stronger business investment and another solid increase in exports.
- Excess capacity in the economy is expected to be fully absorbed around the end of this year. That is earlier than April's assumption that the economy would reach potential in the first half of 2018.
- Slower inflation was mostly attributed to temporary factors including food price competition and electricity rebates in Ontario. The bank also noted a lag between monetary policy actions and future inflation.
Our Take:
The Bank of Canada announced their first rate hike in nearly seven years, a move that seemed a long shot just a few months ago given the central bank's dovish rhetoric. But the potential for an increase was clearly telegraphed by members of the Governing Council over the last month in what is surely their most concerted effort at forward guidance under Governor Poloz's tenure. Today's rate statement and Monetary Policy Report reflect many of the themes policymakers have touched on in their recent, more hawkish comments. The bank sees growth broadening across industries and regions and thinks the energy sector's adjustment to lower oil prices is largely complete. With above-trend growth looking more sustainable and excess capacity being absorbed, the economy needs less help from ultra-low interest rates.
The statement provided little guidance on when we might expect another rate hike, but it is worth noting that today's move was not necessarily framed as simply walking back some of the stimulus provided in 2015. Rather, we think the bank's projection that economic slack will be fully absorbed by the end of 2017 raises the risk that policymakers do more than withdraw those 50 basis points of 'insurance cuts' over the next year. But to do so, we think the Governing Council will want to see at least some evidence of tighter economic conditions putting upward pressure on inflation. Our expectation is the bank will raise rates again in October before hitting pause on their tightening cycle until they have greater confidence that inflation is heading to their 2% target on a sustained basis. Also arguing for such a pause is Governor Poloz's comment that the economy may be more sensitive to higher interest rates than in the past and thus policymakers will have to carefully gauge the effect of rate hikes on the economy.