
Sample Category Title
Market Update – Asian Session: China Skips Reverse Repo Operations Again
Asia Summary
Asian markets were generally higher as Fed's Yellen comments were in line with expectations and Bank of Canada raised rates at expected. Korea's Kospi rose nearly 1% after BOK left rates on hold but did raise its outlook for 2017 GDP (not taking into account impact of an extra budget). China markets were more reserved as the PBOC skipped reverse repo operations, after 2 injections. China didconduct CNY360B 1-yr 3.2% v 3.2% prior in medium term lending facility (MLF) operations, the last time the PBOC used the MLF was in early June.The dollar remained weaker for another session against the majors.Australia consumer inflation expectations rose sharply for July to 4.4% from 3.6% in June; NAB analysts see this as a return to long run average.
China in the overnight session released the first round of economic data, with money supply M2 coming in at a record low and new yuan loans beat expectations at CNY1.54T. During the session we saw China H1 trade balance in yuan terms fall 17.7% y/y to CNY1.28T; in dollar terms June trade was $42.8B, in line with expectations. Trade with the US in dollar terms was at its highest level since October 2015 at $25.4B. China customs noted that Q3 outlook is still upbeat but H2 higher base effect will poses challenges to trade data.
Key economic data
(KR) BANK OF KOREA (BOK) LEAVES REPO RATE UNCHANGED AT 1.25%; AS EXPECTED (12TH CONSECUTIVE HOLD)
(CN) CHINA H1 TRADE BALANCE CNY1.28T, -17.7% y/y
(CN) CHINA JUN TRADE BALANCE: $42.8B V $42.7BE
(NZ) New Zealand REINZ June House Sales Y/Y: -24.7% v -18.4% prior
(UK) JUN RICS HOUSE PRICE BALANCE: 7% V 15%E
(AU) AUSTRALIA JUL CONSUMER INFLATION EXPECTATION: 4.4% V 3.6% PRIOR
(NZ) NEW ZEALAND JUL ANZ CONSUMER CONFIDENCE INDEX: 125.4 V 127.8 PRIOR; M/M: -1.9% V +3.1% PRIOR
(CN) CHINA JUN FOREIGN DIRECT INVESTMENT YUAN TERMS Y/Y: +2.3% V -3.7% PRIOR
Speakers and Press
China
(CN) PBOC Adviser Yiping: China should consider forming a govt backed fund to deal with employment-related issues arising from the clean-up of zombie firms - Chinese press
(CN) Financial press notes the divergence between Chinese bonds and Treasuries with the 10-yr spread shrinking by 20%/~30bp since early June
(CN) According to American Chamber of Commerce in Shanghai survey ~20% of US firms in Shanghai redirecting investments away from China - SCMP
Japan
(JP) Bank of Japan (BOJ) reportedly intends to raise growth outlook for FY17-18 by 0.1-0.2% at policy meeting next week – Nikkei
(JP) According to Japan Business Federation (Keidanren), Japan large firms raise wages by 2.34% this year, +0.07ppt y/y - Sankei
Korea
(KR) US Trade Rep Lighthizer calls for August meeting with South Korea to fix US goods trade deficit with South Korea
Other
(UK) BOE's McCafferty (hawkish dissenter): BOE should consider unwinding £435B QE program earlier than planned
Asian Equity Indices/Futures (00:30ET)
Nikkei -0.1%, Hang Seng +1.1%, Shanghai Composite +0.4%, ASX200 +1.1%, Kospi +1.2%
Equity Futures: S&P500 +0.1%; Nasdaq +0.2%, Dax +0.1%, FTSE100 +0.1%
FX ranges/Commodities/Fixed Income (00:30ET)
EUR 1.1439-1.1411; JPY 113.53-112.86; AUD 0.7697-0.7675; NZD 0.7298-0.7247
Aug Gold +0.3% at 1,222/oz; Aug Crude Oil 0.0% at $45.48/brl; Sept Copper 0.0% at $2.69/lb
USD/CNY (CN) PBOC SETS YUAN REFERENCE RATE AT 6.7802 V 6.7868 PRIOR
(CN) PBoC skips OMO operations v injects CNY70B prior in 7-day and 14-day reverse repos
(CN) PBOC conducts CNY360B 1-yr 3.2% v 3.2% prior in medium term lending facility (MLF) operations
(NZ) New Zealand sells NZ$100M in 2.5% Sept 2040 Bonds at 2.3284%
(JP) Japan MoF sells ¥0.81T v ¥1.0T indicated in 0.60% 20-year JGB bonds, avg yield 0.606% v 0.583% prior; bid-to-cover: 4.19x v 3.98x prior
Asia equities notable movers
Australia
iCar Asia, ICQ.AU Reports Q2 cash collections +35%y/y on a FOREX neutral basis, +6.0%
Anteo Diagnostics,ADO.AU Announces revised payment arrangement with Diasource Vendors; -5.3%
Hong Kong/China
China Everbright, 257.HK Guides H1 Net +40% y/y; Rev +60% y/y; +7.7%
Weichai Power, 2338.HK Guides H1 Net +125-150% y/y; +6.8%
Korea
Kolon Life Science, 102940.KR Receives approval to sell INVOSSA in South Korea; -6.7%
US Session Highlights
(US) Fed chair Yellen, says that there is no rush to tighten monetary policy as inflation remains consistently below target. The Fed expects the economy to continue to develop in the current direction, which will grant room for gradual rate hikes. Reductions in the balance sheet likely to begin this year. These vies were echoed by Fed official George (hawk non-voter) who favors starting balance sheet reductions in the near future. Stating that holding long-term rates below the level that they might otherwise move to naturally, as economic fundamentals improve, risks creating financial imbalances.
(US) After Yellen comments today read as less hawkish, Treasuries saw a sharp rally and the US dollar lost some ground against major currencies. The 10-year yield dropped 5bps reaching 2.30% at one point, before closing slightly higher, 10s/30s curve spread widened further today reaching 57bps.
CIE Announces Agreement to Expand the Anchor Unit; Entered into a definitive agreement with its co-owners in the Anchor development to unitize and include Cobalt's two leases immediately south of the current Anchor unit (Green Canyon blocks 850 and 851) into the existing Anchor unit ; +30.5% afterhours
US markets on close: Dow +0.6%, S&P500 +0.7%, Nasdaq +1.1%, Russell +0.8%
Best Sector in S&P500: Technology and Real Estate
Worst Sector in S&P500: Financial
Biggest gainers: NRG 29.4%; ATVI 5.2%; UAL 4.7%
Biggest losers: GWW -4.4%; DE -3.6%; CTL -3.2%
At the close: VIX 10.30 (-0.59pts); Treasuries: 2-yr 1.35% (-2.3%), 10-yr 2.32% (-1.8%), 30-yr 2.89% (-1.3%)
EURUSD Fell Slightly On The Testimony
Market Movers Today
Today focus will be on inflation with the Swedish print for June being a very uncertain story. There are several sources of uncertainty, which, in our view, basically are just a lot of noise. However, we have a forecast of 0.2 percentage points under the Riksbank's new CPIF (DB 1.5%, RB 1.7%) and CPIF excluding energy projections. Our forecasts are in the lower end of the range, with consensus being in line with the Riksbank. Hence, if we are right, rates could go a little lower and EUR/SEK bounce higher, maybe towards 9.70. Negative contributions from clothing and food, whereas recreation and transportation will add to inflation, we think.
The German, French and Spanish HICP inflation figures are the final versions and should all be unchanged from the flash estimates already released. In the US, PPI inflation is expected to be down by 0.6 percentage points, but PPI core inflation should only be 0.1 percentage points lower than in May.
Comments from Fed members will also remain in focus with Chair Janet Yellen's semiannual testimony continuing in the Senate followed by speeches from Evans and Brainard.
Selected Market News
USD/CAD fell sharply yesterday as Bank of Canada (BoC) hiked its key policy rate by 25bp despite the hike being priced fully in advance. Instead the focus of the market was likely that BoC disregarded recent headwinds towards its inflation target. Subsequently, CAD rates rose and the market is priced for another 25bp hike this year.
There were no significant news in Fed Chair Janet Yellen's testimony yesterday. The market's focus was likely on comments regarding recent low inflation numbers and on the timing of the start of quantitative tightening. On the former, she said it was due to a drop in a few certain price categories. On the latter, she repeated it may start this year and could start soon disregarding the importance of the timing. EUR/USD fell slightly on the testimony.
Oil prices dropped back on the weekly EIA inventory report despite the report confirming the large inventory draw reported by API on Tuesday. Instead the market likely focused on EIA estimating a further rise in US crude production, while the before mentioned rise in USD also weighed on oil prices.
China's exports in June rose supporting the notion from recent activity indicators that short-term downside risks to Chinese economy are abating. The numbers likely contributed to positive sentiment in Asian markets and the copper market this morning.
The monthly WASDE report from USDA put a damper on the recent sharp rally in US wheat prices. The market has grown concerned recently on a likely drop in US wheat output this which has been the main factor behind the price rise. However, dropped backed slightly on the report.
Daily Technical Outlook And Review: EUR/USD, GBP/USD, AUD/USD, USD/JPY, USD/CAD, USD/CHF, DOW 30, GOLD
A note on lower timeframe confirming price action...
Waiting for lower timeframe confirmation is our main tool to confirm strength within higher timeframe zones, and has really been the key to our trading success. It takes a little time to understand the subtle nuances, however, as each trade is never the same, but once you master the rhythm so to speak, you will be saved from countless unnecessary losing trades. The following is a list of what we look for:
- A break/retest of supply or demand dependent on which way you're trading.
- A trendline break/retest.
- Buying/selling tails ... essentially we look for a cluster of very obvious spikes off of lower timeframe support and resistance levels within the higher timeframe zone.
- Candlestick patterns. We tend to only stick with pin bars and engulfing bars as these have proven to be the most effective.
We typically search for lower-timeframe confirmation between the M15 and H1 timeframes, since most of our higher-timeframe areas begin with the H4. Stops are usually placed 1-3 pips beyond confirming structures.
EUR/USD
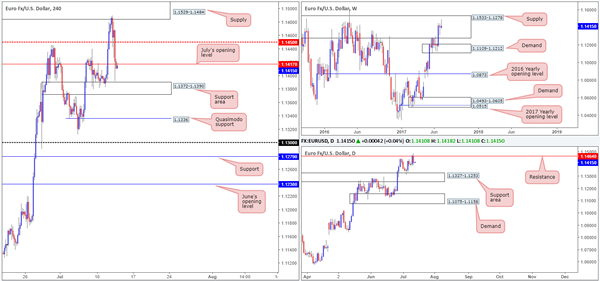
For those who read Wednesday's report you may recall that our desk placed a pending sell order around the lower edge of a fresh H4 supply at 1.1484. As can be seen from the H4 chart, the order filled beautifully during the early hours of yesterday's segment and has reached the first take-profit zone: July's opening level at 1.1417. We have taken 50% off the table here and reduced risk to breakeven.
Ultimately, we do believe the unit will continue to push lower going forward, since weekly price remains loitering within the walls of a major weekly supply drawn from 1.1533-1.1278 (that has capped upside since May 2015). Alongside this, we can also see daily action showing room to trade down to at least the support area coming in at 1.1327-1.1253.
Our suggestions: With the above notes in mind, our final take-profit level has been set at the H4 Quasimodo support pegged from 1.1336, just nine pips above the top edge of the aforementioned daily support area.
Other than our current trade, we do not see much else to hang our hat on right now. Trying to join the sellers at current price would be challenging given that we have a H4 support area at 1.1372-1.1390 lurking nearby!
Data points to consider: US PPI figures and US Weekly unemployment claims at 1.30pm, Fed Chair Yellen testifies at 3pm, FOMC member Evans speaks at 4.30pm, FOMC member Brainard speaks at 6pm GMT+1.
Levels to watch/live orders:
- Buys: Flat (stop loss: N/A).
- Sells: 1.1484 (stop loss: breakeven).
GBP/USD
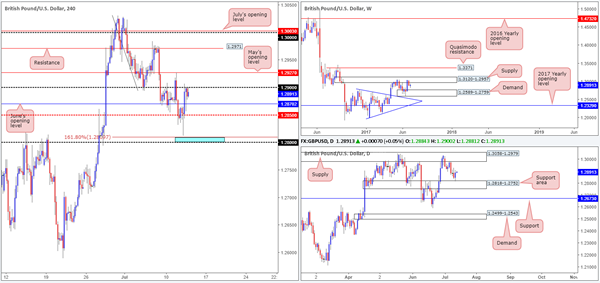
In recent trading, we can see that the GBP/USD came within a cat's whisker of clipping the H4 blue buy zone at 1.28/1.2809 (comprised of a round number and a 161.8% Fib ext. point at 1.2809 taken from the high 1.3030), before reversing to the upside. The pair gathered momentum following a stronger-than-expected UK job's report, consequently pushing H4 price above the mid-level resistance seen at 1.2850.
As you can see, the bulls continued to lift this market higher, eventually tagging the 1.29 handle going into the early hours of the US segment, which remained firm going into the closing bell.
Traders may have also noticed that daily price recently crossed swords with the support area formed at 1.2818-1.2752. While this is considered a bullish signal, let's not forget that weekly action remains trading from a supply at 1.3120-1.2957, with the next downside target being seen around demand pegged at 1.2589-1.2759.
Our suggestions: H4 structure looks incredibly restricted right now. A few pips above 1.29 is May's opening level at 1.2927, and directly below 1.29 we have June's opening level at 1.2870. In addition to this, we also have conflicting signals coming in from the weekly and daily charts (see above). Therefore, our team's position will remain flat going into today's sessions.
Data points to consider: US PPI figures and US Weekly unemployment claims at 1.30pm, Fed Chair Yellen testifies at 3pm, FOMC member Evans speaks at 4.30pm, FOMC member Brainard speaks at 6pm GMT+1.
Levels to watch/live orders:
- Buys: Flat (stop loss: N/A).
- Sells: Flat (stop loss: N/A).
AUD/USD
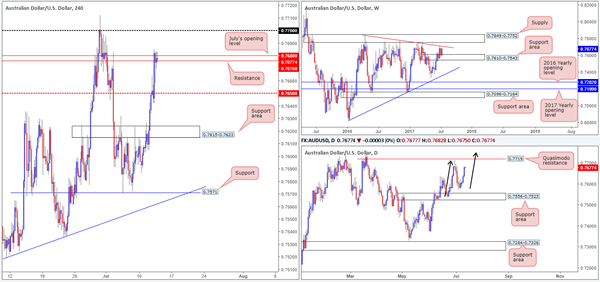
The commodity currency rallied for a fourth consecutive day on Wednesday, reaching a high of 0.7685. The move has brought the current weekly candle up to within striking distance of the weekly trendline resistance drawn from the high 0.7835. Should the unit breach this line, however, the bulls won't have far to go to find trouble since there's a nearby weekly supply sitting a few pips above at 0.7849-0.7752.
Looking down to the daily chart, the next upside target does not come into view until we reach 0.7719: a Quasimodo resistance line that's positioned just above the said weekly trendline. What's also interesting on this scale is the AB=CD formation currently setting up (black arrows) that terminates around the underside of the weekly supply mentioned above at 0.7752.
Across on the H4 candles, the buyers and sellers are currently seen battling it out around a H4 resistance level at 0.7676/July's opening level at 0.7680. The next port of call beyond these two barriers is the 0.77 handle, which is positioned a few pips below the aforementioned weekly trendline resistance.
Our suggestions: As of current price, we have no immediate trade recommendation. However, we really like the look of the daily AB=CD pattern given where it completes. To that end, we feel the bulls will continue to push this market higher today, with the likelihood of the 0.77 handle being consumed. We must be clear here though that we have no interest in trading this market UNTIL price has connected with the 0.7750 neighborhood (stops would likely be positioned above the high formed back on the 8th Nov 2016 at 0.7778).
Data points to consider: US PPI figures and US Weekly unemployment claims at 1.30pm, Fed Chair Yellen testifies at 3pm, FOMC member Evans speaks at 4.30pm, FOMC member Brainard speaks at 6pm GMT+1.
Levels to watch/live orders:
- Buys: Flat (stop loss: N/A).
- Sells: 0.7750 region (stop loss: 0.7780).
USD/JPY
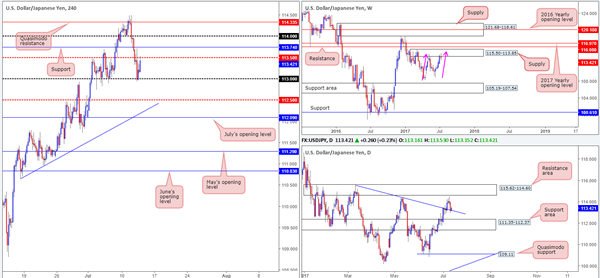
The USD/JPY, as you can see, continued to punch lower during Wednesday's sessions. It was only once price shook hands with the 113 handle did we see the bulls make an appearance. As we explained yesterday, shorting the market beyond 113.50 was just too restricted given that there was a nearby daily trendline support etched from the high 115.50.
Although we have seen a healthy bounce from 113 that has, in recent hours, brought the unit back up to 113.50, this market is still a tricky beast to trade right now. On the one hand, we have weekly action suggesting that further selling may be on the cards from the supply zone at 115.50-113.85, while on the other hand daily price is seen trading from the aforementioned trendline support.
Our suggestions: While we do believe that this market will eventually drive lower, it is just too chancy for us to sell into a daily trendline support. For that reason, we will not be initiating any trades today.
Data points to consider: US PPI figures and US Weekly unemployment claims at 1.30pm, Fed Chair Yellen testifies at 3pm, FOMC member Evans speaks at 4.30pm, FOMC member Brainard speaks at 6pm GMT+1.
Levels to watch/live orders:
- Buys: Flat (stop loss: N/A).
- Sells: Flat (stop loss: N/A).
USD/CAD
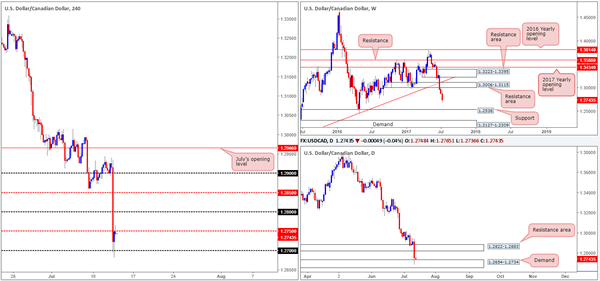
In response to the Bank of Canada increasing its key interest rate from 0.50% to 0.75% yesterday, the USD/CAD steamrolled its way south, and only found refuge once it struck the 1.27 handle (seen encased within a daily demand zone pegged at 1.2654-1.2734).
While yesterday's move was influenced by a fundamental driver, the weekly technicals, as we've been reporting, were in harmony with this move. In fact, the weekly timeframe shows space to continue pressing south all the way down to support coming in at 1.2538.
On the daily timeframe, however, weekly sellers have to contend with not only the current demand base mentioned above at 1.2654-1.2734, but also a daily Quasimodo support level seen below it at 1.2592.
Our suggestions: Watch for a decisive H4 close beyond the 1.27 handle. This would, in our view, signal seller strength on the weekly chart and buyer weakness within the current daily demand, and therefore potentially open up the possibility for a sell trade on any retest seen at 1.27.
Data points to consider: US PPI figures and US Weekly unemployment claims at 1.30pm, Fed Chair Yellen testifies at 3pm, FOMC member Evans speaks at 4.30pm, FOMC member Brainard speaks at 6pm GMT+1.
Levels to watch/live orders:
- Buys: Flat (Stop loss: N/A).
- Sells: Watch for H4 price to engulf the 1.27 handle and then look to trade any retest seen thereafter ([waiting for a H4 bearish candle – preferably in the form of a full, or near-full-bodied candle – to form following the retest is advised] stop loss: ideally beyond the candle's wick).
USD/CHF
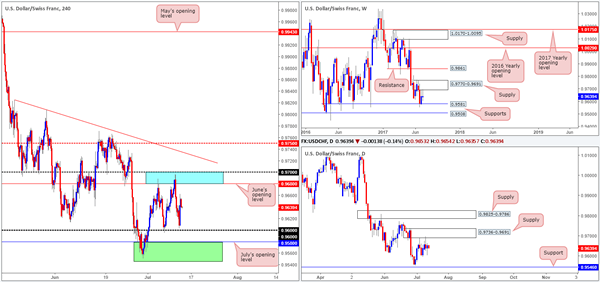
Since the 5th May, the H4 candles have been chiseling out a consolidation zone between 0.97/0.9680 (round number/June's opening level – blue zone) and the 0.96 handle. What way this range will eventually break is difficult to pin down. This is because on the weekly chart, price is also seen loitering between a supply at 0.9770-0.9691 and a support formed at 0.9581.
Given the above, we are going to keep things very simple today!
We have two zones of interest:
The first is the blue resistance zone mentioned above at 0.97/0.9680. We've selected this area since not only is this barrier lodged around the underside of the said weekly supply, there's also a partner supply seen on the daily timeframe at 0.9736-0.9691 that's in play.
The second zone is a support area marked in green comprised of a daily support at 0.9546 and the weekly support at 0.9581, which also happens to converge closely with July's opening level at 0.9580.
Our suggestions: Both zones have proved their worth already, in our opinion, so it is just a matter of which one will be tested first.
To initiate a trade at either of the above noted zones, nevertheless, we would require H4 candle confirmation, preferably in the shape of a full, or near-full-bodied candle. This is just a way to confirm that there are other speculators interested in the same zone as we are!
Data points to consider: US PPI figures and US Weekly unemployment claims at 1.30pm, Fed Chair Yellen testifies at 3pm, FOMC member Evans speaks at 4.30pm, FOMC member Brainard speaks at 6pm GMT+1.
Levels to watch/live orders:
- Buys: 0.9546/0.9581 ([waiting for a H4 bull candle – preferably a full, or near full-bodied candle – to form is advised] stop loss: ideally beyond the candle's tail).
- Sells: 0.97/0.9680 ([waiting for a H4 bear candle – preferably a full, or near full-bodied candle – to form is advised] stop loss: ideally beyond the candle's wick).
DOW 30
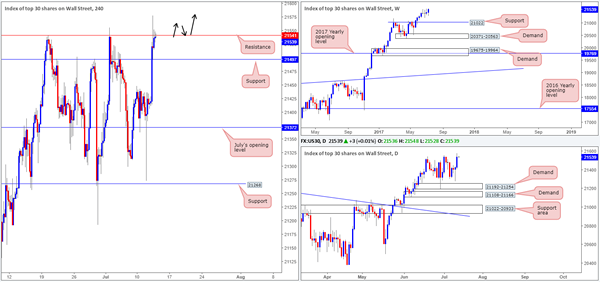
US equities rallied to a fresh all-time high of 21578 yesterday; after Fed Chair Janet Yellen indicated that the Fed will not rush to tighten monetary policy as inflation remains below target.
From a technical perspective, we're now watching for the H4 candles to print a decisive bull candle above the H4 resistance at 21541. This, to us, would signal further upside and potentially open up the opportunity for traders to long any retest seen thereafter (as per the black arrows).
Our suggestions: Should the above scenario come to fruition, our desk has noted that they would look to trail the position, in the hope of joining the rather steep uptrend the DOW is currently entrenched within right now (see weekly chart).
Data points to consider: US PPI figures and US Weekly unemployment claims at 1.30pm, Fed Chair Yellen testifies at 3pm, FOMC member Evans speaks at 4.30pm, FOMC member Brainard speaks at 6pm GMT+1.
Levels to watch/live orders:
- Buys: Watch for H4 price to close above the current H4 resistance and then look to trade any retest seen thereafter ([waiting for a H4 bull candle – preferably a full, or near full-bodied candle – to form following the retest is advised] stop loss: ideally beyond the candle's tail).
- Sells: Flat (stop loss: N/A).
GOLD
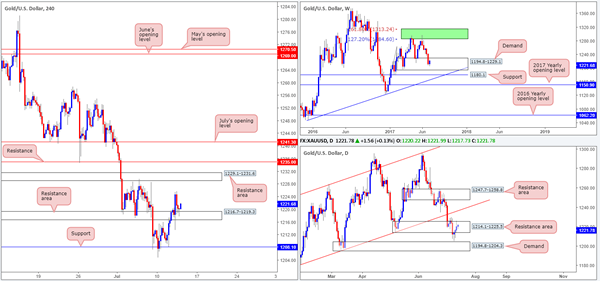
Just to remind ourselves of where we are in the bigger picture on gold at the moment, let's take a quick look at the weekly and daily chart. Weekly price, as you can probably see, remains loitering within the confines of a demand base coming in at 1194.8-1229.1. As far as the daily chart is concerned, the candles are seen currently trading within a resistance area drawn from 1214.1-1225.5.
As we highlighted in Tuesday's analysis, before our team can become buyers in this market we said that we would require a decisive H4 close above the H4 resistance area at 1216.7-1219.3. This occurred during yesterday's segment and has, in recent hours, printed a rather attractive H4 buying tail off this area on the retest. For us, this is enough evidence to suggest that the current daily resistance area is weakened and the H4 candles will likely reach the H4 resistance area at 1229.1-1231.6, followed closely by H4 resistance at 1235.0.
Our suggestions: Since we are currently short the EUR/USD pair, which typically correlates with the price of gold, we have opted not to take advantage of this setup, unfortunately. But for those who have no position in the EUR market, this could be an opportunity to enter long.
Levels to watch/live orders:
- Buys: @ current price is a valid long with stops planted below the H4 buying tail just printed at 1217.2.
- Sells: Flat (stop loss: N/A).
Daily Technical Analysis: EUR/USD Bearish Momentum At 1.15 Could Start Wave 4 Retracement
Currency pair EUR/USD
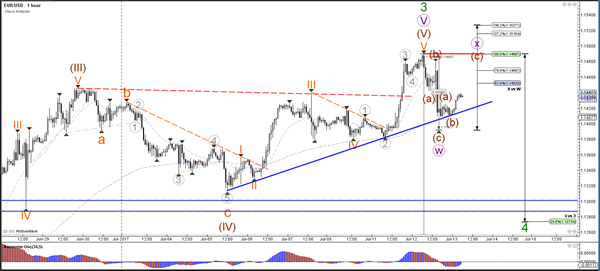
The EUR/USD bullish breakout reached the 1.15 target but then fell quickly down to 1.14. The bearish reaction could indicate that the waves 5 have been completed within wave 3 (green), which could indicate the start of a bearish retracement within wave 4 (green) towards the Fibonacci retracement levels of wave 4 vs 3. A break above 1.15, however, would indicate the revival of the uptrend and invalidate a larger correction within wave 4.
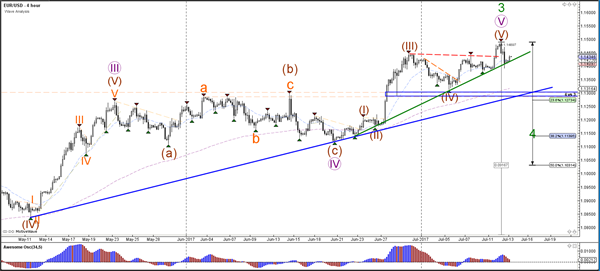
The EUR/USD could be building a bigger correction first before completing the wave 4 (green) retracement. Alternatively, price could be in an uptrend if the EUR/USD manages to break above the resistance (red), 1.15 round level, and 138.2% Fib at 1.1527.
Currency pair USD/JPY
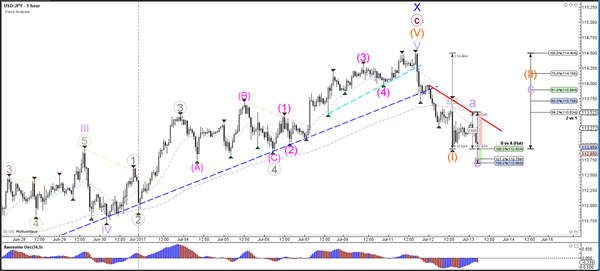
The USD/JPY made a bearish decline of about 150 pips after potentially completing wave X (blue). A new bearish trend could be in place if price respects the wave 2 (orange) Fibonacci levels. A break above the 100% level invalidates the wave 2 and downtrend.
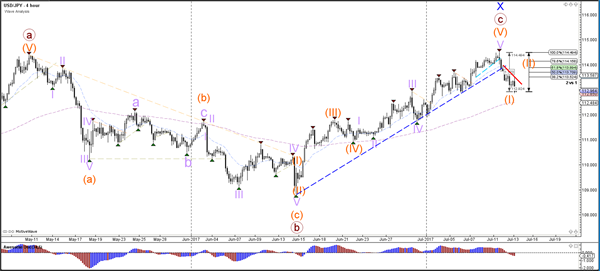
The USD/JPY could have completed a wave 1 (orange) and might be retracing for a wave 2 (orange) if price stays above the 138.2% Fibonacci and below the 100% Fib of wave 2 vs 1. A break below the 138.2% support Fib could indicate a downtrend continuation where a break above the 100% resistance Fib invalidates the potential downtrend.
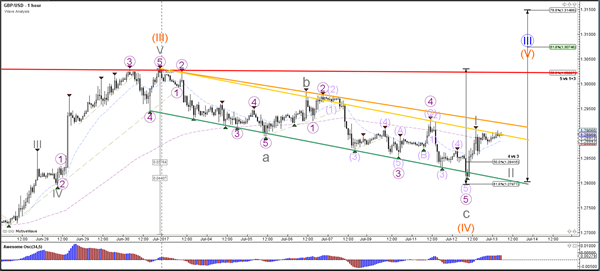
Currency pair GBP/USD
The GBP/USD made one more lower low but price did not break below the 61.8% Fibonacci level. The wave is therefore still valid and price is now approaching the resistance trend line (yellow) of the bearish channel. A bullish breakout could see a wave 5 (orange).
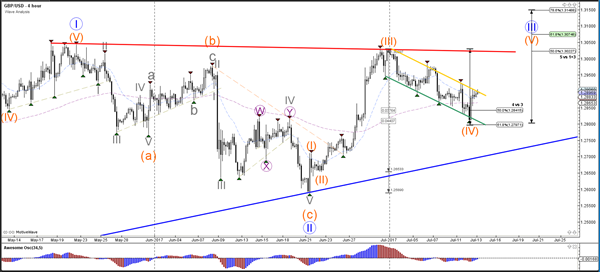
The GBP/USD could be in a wave 1-2 (grey) as long as price stays above 1.28.
European Open Briefing: The Canadian Dollar Has Been The Strongest Performing Currency In The Past 24 Hours
Global Markets:
- Asian stock markets: Nikkei down 0.20 %, Shanghai Composite gained 0.60 %, Hang Seng and ASX 200 both gained 1.10 %
- Commodities: Gold at $1223 (+0.30 %), Silver at $15.95 (0.30 %), WTI Oil at $45.50 (+0.05 %), Brent Oil at $47.80 (+0.05 %)
- Rates: US 10 year yield at 2.31, UK 10 year yield at 1.26, German 10 year yield at 0.58
News & Data:
- China Trade Balace 294.3 Bln Yuan Vs Est 275.1 Bln Yuan
- China Exports Rise 17.30% vs Est 14.60%
- China Imports Rise 23.10% vs Est 22.30%
- Australia Consumer Inflation Expectation (Jul): 4.40% (Prev 3.60%)
- New Zealand ANZ Consumer Confidence Index Jul: 125.40 (Prev 127.80)
- UK RICS House Price Balance Jun: 7% (Est 15%, Prev 17%)
- PBoC Fixes USDCNY Reference Rate At 6.7802 (Prev 6.7868)
Markets Update:
The Canadian Dollar has been the strongest performing currency in the past 24 hours. The Bank of Canada delivered a hawkish hike – a rate hike accompanied by an optimistic outlook for the economy. The BoC signalled that another rate hike might follow soon. While the market expected a move up in rates, the central bank was more hawkish than expected. USDCAD collapsed to 1.2670. While it has recovered a bit since then, the outlook remains negative and further losses are likely. The next important support level now lies at 1.25.
The US Dollar came under pressure following dovish comments from Fed Chair Yellen. She expressed concern about the soft inflation data in recent months. USDJPY fell back below 113 and a test of 112 support seems likely in the near-term.
Meanwhile, the Euro reversed some of its gains, but remains well bid overall. Key support is seen at 1.14 and 1.1380. GBPUSD rose to 1.29, but weak UK employment data prevented a larger rally.
Upcoming Events:
- 07:00 BST – German CPI
- 13:30 BST – US PPI
- 13:30 BST – US Initial Jobless Claims
- 15:00 BST – Fed Chair Yellen testifies
Australia’s Consumer Inflation Expectation Advanced In July
For the 24 hours to 23:00 GMT, the AUD rose 0.51% against the USD and closed at 0.7677.
LME Copper prices rose 1.5% or $87.5/MT to $5882.5/MT. Aluminium prices declined 0.1% or $2.0/MT to $1877.0/MT.
In the Asian session, at GMT0300, the pair is trading at 0.7688, with the AUD trading 0.14% higher against the USD from yesterday's close.
Earlier today, data showed that Australia's consumer inflation expectation climbed to 4.4% in July, compared to a reading of 3.6% in the previous month.
Elsewhere in China, Australia's largest trading partner, trade surplus surprisingly widened to a level of CNY294.3 billion in June, amid a surge in exports, confounding market consensus for the nation's surplus to narrow to a level of CNY275.1 billion and compared to a surplus of CNY281.6 billion in the preceding month.
The pair is expected to find support at 0.7657, and a fall through could take it to the next support level of 0.7627. The pair is expected to find its first resistance at 0.7704, and a rise through could take it to the next resistance level of 0.7721.
The currency pair is trading above its 20 Hr and 50 Hr moving averages.

Euro-Zone’s Industrial Output Surged To A 6-Month High In May
For the 24 hours to 23:00 GMT, the EUR declined 0.48% against the USD and closed at 1.1415.
Macroeconomic data indicated that the Euro-zone's seasonally adjusted industrial production rose by 1.3% on a monthly basis in May, posting its largest increase in six months, thus confirming that the region's economy remains on course for stronger growth in the second quarter. In the prior month, industrial production had recorded a revised rise of 0.3%, while markets anticipated for a gain of 1.0%.
Yesterday, the Federal Reserve (Fed) Chairwoman, Janet Yellen, in a testimony before the House Financial Services Committee, expressed optimism over the US economy and emphasised the central bank's gradual approach on monetary policy trajectory over next few years, noting that interest rates may not have to rise much further to meet the Fed's goals. Moreover, she added that the central bank would proceed with the unwind of its balance sheet this year, on the back of a healthy labour market.
Separately, the Fed's Beige Book report revealed that the US economy saw “slight to moderate” growth from late May through June. Further, it reported that companies are finding it difficult to fill open positions due to a shortage of qualified candidates and that labour markets tightened further, but price pressures were largely held in check.
On the data front, mortgage applications in the US dropped 7.4% in the week ended 07 July 2017, following a gain of 1.4% in the previous week.
In the Asian session, at GMT0300, the pair is trading at 1.1437, with the EUR trading 0.19% higher against the USD from yesterday's close.
The pair is expected to find support at 1.1390, and a fall through could take it to the next support level of 1.1342. The pair is expected to find its first resistance at 1.1487, and a rise through could take it to the next resistance level of 1.1536.
Moving ahead, investors will focus on Germany's final consumer price inflation data June, slated to release in a few hours. Moreover, a testimony by the Fed Chair, Janet Yellen and the US weekly jobless claims data, later in the day, will be on investors' radar.
The currency pair is showing convergence with its 20 Hr and 50 Hr moving averages.

Britain’s Unemployment Rate Declined To A 42-Year Low During The Three Months Ended May
For the 24 hours to 23:00 GMT, the GBP rose 0.29% against the USD and closed at 1.2891, after unemployment rate in the UK dipped to a 42-year low in the three months to May.
Britain's ILO unemployment rate unexpectedly dropped to 4.5% in the three months ended May, hitting its lowest level since 1975, pointing to a healthy labour market. Markets anticipated the nation's unemployment rate to remain steady at 4.6%. Meanwhile, the nation's average earnings including bonus advanced 1.8% in the March-May period, at par with market expectations, following a gain of 2.1% in the February-April period, suggesting anaemic wage growth.
In the Asian session, at GMT0300, the pair is trading at 1.2900, with the GBP trading 0.07% higher from yesterday's close.
The pair is expected to find support at 1.2839, and a fall through could take it to the next support level of 1.2778. The pair is expected to find its first resistance at 1.2934, and a rise through could take it to the next resistance level of 1.2968.
Going ahead, traders will look forward to the Bank of England's (BoE) credit conditions survey report, slated to release in a few hours.
The currency pair is trading above its 20 Hr and 50 Hr moving averages.

Japanese Yen Trading Higher This Morning
For the 24 hours to 23:00 GMT, the USD declined 0.47% against the JPY and closed at 113.31.
In the Asian session, at GMT0300, the pair is trading at 113.05, with the USD trading 0.23% lower against the JPY from yesterday's close.
The pair is expected to find support at 112.74, and a fall through could take it to the next support level of 112.44. The pair is expected to find its first resistance at 113.54, and a rise through could take it to the next resistance level of 114.04.
Looking forward, Japan's final industrial production for May, scheduled to release tomorrow, will garner market attention.
The currency pair is trading below its 20 Hr and 50 Hr moving averages.

Swiss Franc Trading On A Stronger Footing In The Morning Session
For the 24 hours to 23:00 GMT, the USD rose 0.17% against the CHF and closed at 0.9652.
In the Asian session, at GMT0300, the pair is trading at 0.9636, with the USD trading 0.17% lower against the CHF from yesterday’s close.
The pair is expected to find support at 0.9605, and a fall through could take it to the next support level of 0.9575. The pair is expected to find its first resistance at 0.9664, and a rise through could take it to the next resistance level of 0.9693.
Moving ahead, investors will keep a close watch on Switzerland’s producer and import prices data for June, slated to release in a few hours.
The currency pair is showing convergence with its 20 Hr moving average and trading below its 50 Hr moving average.
