Sample Category Title
Trade Idea Wrap-up: USD/JPY – Stand aside
USD/JPY - 113.19
Most recent candlesticks pattern : N/A
Trend : Near term up
Tenkan-Sen level : 113.02
Kijun-Sen level : 113.11
Ichimoku cloud top : 112.62
Ichimoku cloud bottom : 112.40
New strategy :
Stand aside
Position : -
Target : -
Stop : -
Although the greenback retreated after rising to 113.47 and consolidation below this level would be seen, reckon downside would be limited to the upper Kumo (now at 112.62) and 112.40 should hold, bring another rise later, above said resistance at 113.47 would signal recent upmove is still in progress for headway to 113.75-80 but loss of momentum should prevent sharp move beyond 114.00, bring retreat later.
In view of this, would not chase this rise here and would be prudent to stand aside for now. Below the lower Kumo (now at 112.40) would suggest top is possibly formed but break of 111.90-95 is needed to add credence to this view, bring test of 111.73 support first.

Dollar Extends Cautious Rebound
- European stocks opened lower as the Asian risk-off momentum carried over into European trading, but equities found their composure and recovered most of the opening losses. Oil's multi-day rally stalled after OPEC production increased as member exempt from supply guts boosted output. There is no trading in the US today because of the 4th of July holiday.
- ECB Board member Praet sounded dovish as he said patience and persistence is needed. Patience as inflation convergence with the target needs more time to show in the data and underlying price pressures continue to be subdued. Persistence as future inflation remains contingent on the current accommodative monetary policy.
- BoE's Ian McCafferty, who voted for a rate hike in the last policy meeting, confirmed his backing for a hike as the economy has not slowed as feared after the Brexit vote and inflation has been high.
- Sweden's Riksbank, long noted for its extreme dovishness despite the country's buoyant economy, has kept the benchmark interest rate on hold at -0.5%, and indicated it's in no hurry to change course. It did however, as expected, weaken the easing bias in its statement slightly.
- The number of people registered with Spain's unemployment offices dropped by 98.3K in June to 3.36M, the lowest number in eight years. The declines was lower than the expected 114.9K and lower than the previous decline of 111.9K.
- UK construction is still growing, but momentum appears to have slowed a little, with the latest PMI for the sector stumbling to 54.8 in June, from 56 in May, and just shy of forecasts. Survey respondents saw renewed risk aversion among clients reflecting concerns about the economic outlook and heightened political uncertainty.
- The BOE's regulatory authority (PRA) said the resilience of consumer-credit portfolios is reducing due to the combination of growth, lower pricing, falling average risk weights in internal-ratings models and increased high risk lending. Therefore, the PRA will require all regulated firms to provide evidence that these concerns are addressed.
Rates
Dull trading in the absence of US traders
German bonds opened higher, as Asian trading turned risk-off on geopolitical tensions, but soon shifted sideways as the risk off sentiment eased in European bond and other markets. At noon, the Bund tried to rally higher but the move missed panache. By 14h, the Bund hit the opening levels again. ECB Peter Praet spoke in the afternoon, but couldn't give bonds direction. In very low volumes (see graph), the Bund again failed to stay further away from the key support levels (see graph). At best, some bottoming out process has started. Worst case, it is only a temporary pause awaiting key US eco data later this week. Praet sounded more dovish than his boss recently, but markets have not forgotten that he asked his colleagues at the Governing Council to wait as long as possible before discussing the ECB exit policy in the media. The Austrian small auction of 1.5% 2047 bonds and the German auction of 0.5% IL 2030 Bund passed without disturbing the overall market. At the time of writing, the German yield curve steepened with yields ranging from -2 bps (2-yr) to +1.5 bp (30-yr). On intra-EMU bond markets, 10-yr yield spread narrowed again modestly for the peripherals.
ECB Praet called for persistence and patience because inflation convergence needs more time to show through convincingly in the data. He was optimistic that, when economic prospects brighten, inflation would converge to the 2% objective. He pointed to subdued core inflation and wanted to see the entire distribution of inflation expectations shift a fair distance to the right. He hailed the effectiveness of the ECB's APP programme and said the inflation outlook is contingent on easy financial conditions.
Currencies
Dollar extends cautious rebound
In Asia, it looked like a risk-off sentiment would hamper yesterday's USD rebound. However, European markets ignored the Asian tensions though. In a market deprived of important eco news, the dollar found its composure and continued an, albeit very gradual, rebound. EUR/USD trades in the 1.1340 area. USD/JPY is changing hands at around 113.25.
Overnight, risk sentiment deteriorated in Asia. Especially Hong Kong stocks were hit. A new North Korean missile test raised political uncertainty and spoiled investors sentiment. The yen profited slightly. USD/JPY dropped to the 113 area. EUR/USD also lost a few ticks and dropped to the mid 1.13 area. (EUR/JPY driven?).
European equities declined about 0.5% in the open. USD/JPY dropped to the 112.75 area. EUR/USD filled bids at around 1.1340. However, most of the zquity opening losses were almost immediately reversed.
European investors had no intention at all to join the Asian-inspired risk-off trade. European equities settled in a tight range close to, mostly slightly below yesterday's closing levels. The US currency kept a positive intraday bid, to some extent continuing yesterday's rebound. EUR/USD held a tight range in the mid 1.1350 area, close to this week's low. USD/JPY regained the 113 barrier.
With US markets closed, there was no big impetus for USD trading from the other side of the Atlantic this afternoon. ECB's Praet kept a soft tone. The euro lost marginal ground on his comments. US equity futures are trading with modest gains, the Nasdaq outperforming. Asian geopolitical concerns are far again, only US President Trump may still act and add fuel to the flames and put pressure on China? Whatever, the dollar remains well bid. EUR/USD trades in the 1.1340/45 area. USD/JPY is changing hands in the 113.25 area.
Sterling declines on USD softness
There was no big story to tell on GBP trading today. Cable and EUR/USD drifted south in lockstep, mirroring a cautious intraday USD rise. The UK construction PMI dropped slightly more than expected from 56.00 to 54.8, without any lasting impact on sterling trading. On the other hand, BoE's McCafferty in an interview reiterated his view that a rate hike would be prudent. His view is no surprise as he already voted for a rate hike in June. The impact on sterling trading today was limited. Even so, the internal debate within the Bank of England continues. EUR/GBP trades in the 0.8780 area. Cable drifted to the 1.2920 area.
Elliott Wave Trade Ideas Performance Update
4 positions were entered last week with total profit of 375 points and the positions are listed below.
21 Jun : AUD/USD - Long at 0.7595, exited at 0.7675 (+ 80 points)
21 Jun : EUR/JPY - Long at 123.80, exited at 125.30 (+ 150 points)
23 Jun : USD/CAD - Short at 1.3295, exited at 1.3130 (+ 165 points)
28 Jun : EUR/GBP - Long at 0.8800, exited at 0.8780 (- 20 points)
| AUD EUR/JPY EUR/GBP CAD GBP GBPJPY
Jan - 15 -275 - 35 -120
Feb + 140 -17 - 40 +11
Mar - 20 +115 +132 - 19
Apr + 30 - 40 +120 + 45
May - 55 +100 - 6 -65 -60
Jun + 81 +150 - 10 +185 -120 +205
Jul
Aug
Sep
Oct
Nov
Dec
Y-T-D + 216 - 82 +107 +463 -185 +190
Candlesticks and Ichimoku Trade Ideas Performance Update
3 positions were entered among all 4 currency pairs with total profit of 30 points and the positions are listed below:
28 Jun : GBP/USD - Long at 1.2845, exited at 1.2945 (+ 100 points)
29 Jun : USD/JPY - Long at 112.40, exited at 112.05 (- 35 points)
3 Jul : USD/JPY - Short at 112.60, exited at 112.95 (- 35 points)
| JPY EUR CHF GBP
Jan + 167 - 85 - 10 + 50
Feb + 200 +150 +93 - 59
Mar -23 -70 -23 - 35
Apr + 65 + 93 + 50 - 40
May - 65 - 35 + 100 -175
Jun -100 -10 - 10 +175
Jul - 35
Aug
Sep
Oct
Nov
Dec
Y-T-D + 208 + 38 +200 - 74
AUDNZD Golden Ratio Supports The Pair
As markets reacted negatively to the RBA statement this month, the AUD may be experiencing temporary weakness. Data on the AIG Manufacturing Index and commodity prices was positive to the AUD earlier this week, whilst there is a lack of data this week on the NZD, which may limit its strength. At this point the pair is supported by 61.8, D L5, W L3 and rising trend line which might spike the price to the upside. The POC zone for long trades is 1.0430-45 and as long as it stays above 1.0375 upside is possible. Targets are 1.0485, 1.0510 and 1.0550.
Trade Idea: EUR/GBP – Stand aside
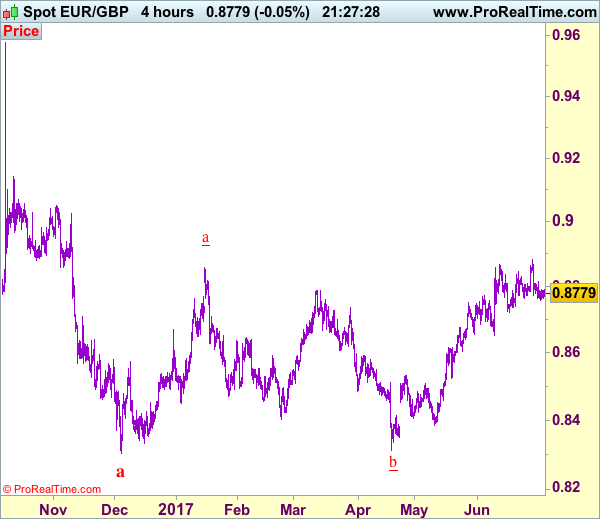
EUR/GBP - 0.8778
Recent wave: Major double three (A)-(B)-(C)-(X)-(A)-(B)-(C) is unfolding and 2nd (A) has possibly ended at 0.6936.
Trend: Near term up
New strategy :
Stand aside
Position : -
Target : -
Stop : -
Euro’s retreat after rising briefly to 0.8882 last week has retained our view that a temporary top is possibly formed there and few days of consolidation would be seen with mild downside bias, below 0.9755-60 would add credence to this view, bring retracement of recent upmove to 0.8730-35, however, still reckon downside would be limited to 0.8719 support.
In view of this, would be prudent to stand aside for now and look to turn short on recovery as 0.8840-50 should limit upside. Above 0.8882 would revive bullishness and extend recent upmove from 0.8304 low to 0.8900-10, having said that, as broad outlook remains consolidative, reckon current c leg of larger degree wave b should be limited to 0.8950 and price should falter well below 0.9000 psychological level.
Our preferred count is that, after forming a major top at 0.9805 (wave V), (A)-(B)-(C) correction is unfolding with (A) leg ended at 0.8400 (A: 0.8637, B: 0.9491 and 5-waver C ended at 0.8400. Wave (B) has ended at 0.9413 and impulsive wave (C) has either ended at 0.8067 or may extend one more fall to 0.8000 before prospect of another rally. Current breach of indicated resistance at 0.9043 confirms our view that the (C) leg has ended and bring stronger rebound towards 0.9150/54, then towards 0.9240/50.
Trade Idea: USD/CAD – Sell at 1.3115
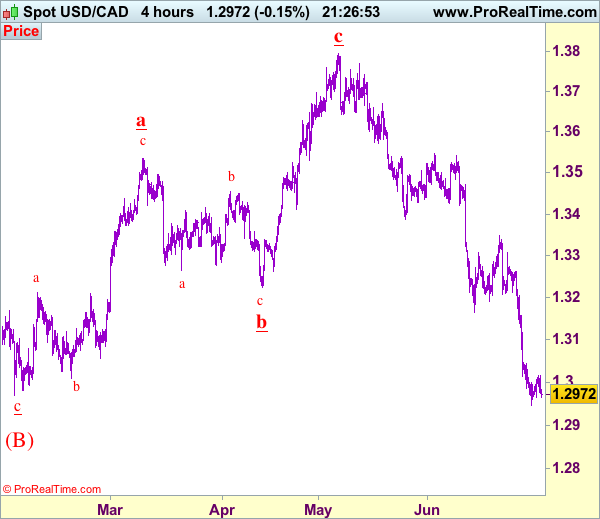
USD/CAD - 1.2972
Recent wave: Only wave v of c has ended at 0.9407 and wave C of major A-B-C correction is underway for headway to 1.4700
Trend: Near term down
Original strategy :
Sell at 1.3115, Target: 1.2915, Stop: 1.3175
Position: -
Target: -
Stop: -
New strategy :
Sell at 1.3115, Target: 1.2915, Stop: 1.3175
Position: -
Target: -
Stop:-
As the greenback has remained under pressure after last week’s selloff, bearishness remains for recent decline to resume after consolidation, although corrective bounce to 1.3045-50 and possibly 1.3080 is likely, reckon 1.3115-20 would limit upside and bring another decline later, below support at 1.2946 would extend the fall from 1.3794 top (wave c of larger degree wave b top) to 1.2920, however, near term oversold condition should limit downside to 1.2900 and reckon 1.2870 would hold from here, risk from there has increased for a rebound later.
In view of this, would not chase this fall here and would be prudent to sell the pair again on recovery as 1.3115-20 should limit upside. Above 1.3160-70 would defer and suggest low is formed, bring a stronger rebound to 1.3215-20 and possibly towards 1.3260-65 but only break there would abort and signal a temporary low is formed instead, then test of resistance at 1.3308 would follow.
To recap, wave B from 1.3066 is unfolding as an a-b-c and is sub-divided as a: 1.2192, b: 1.2716 and wave c is a 5-waver with i: 1.1983, ii: 1.2506, extended wave iii with minor iii at 1.0206, wave iv ended at 1.0781 and wave v as well as wave iii has ended at 0.9931, hence the subsequent choppy trading is the wave iv which is unfolding as (a)-(b)-(c) with (a) leg of iv ended at 1.0854, followed by (b) leg at 1.0108 and (c) leg as well as the wave iv ended at 1.0674. The wave v is sub-divided by minor wave (i): 0.9980, (ii): 1.0374, (iii): 0.9446, (iv): 0.9913 and (v) as well as v has possibly ended at 0.9407, therefore, consolidation with upside bias is seen for major correction, indicated target at 1.3700 and 1.4000 had been met and further gain to 1.4700 would be seen later.
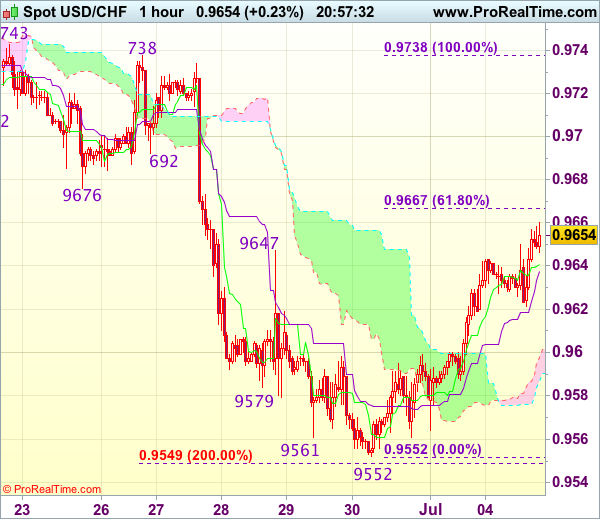
Trade Idea Update: USD/CHF – Buy at 0.9590
USD/CHF - 0.9655
Original strategy :
Buy at 0.9590, Target: 0.9690, Stop: 0.9555
Position : -
Target : -
Stop : -
New strategy :
Buy at 0.9590, Target: 0.9690, Stop: 0.9555
Position : -
Target : -
Stop : -
As the greenback staged a strong rebound after finding good support at 0.9552, suggesting a temporary low has been formed there and consolidation with mild upside bias is seen for this move to bring retracement of recent decline, hence gain to 0.9667-76 (61.8% Fibonacci retracement of 0.9738-0.9552 and previous support turned resistance) is likely, however, reckon upside would be limited to 0.9700 and price should falter below resistance at 0.9738.
In view of this, we are looking to turn long on pullback as the lower Kumo (now at 0.9590) should limit downside and bring another rise later. Below 0.9565-70 would abort and signal intra-day top is formed, risk retest of 0.9552 first.
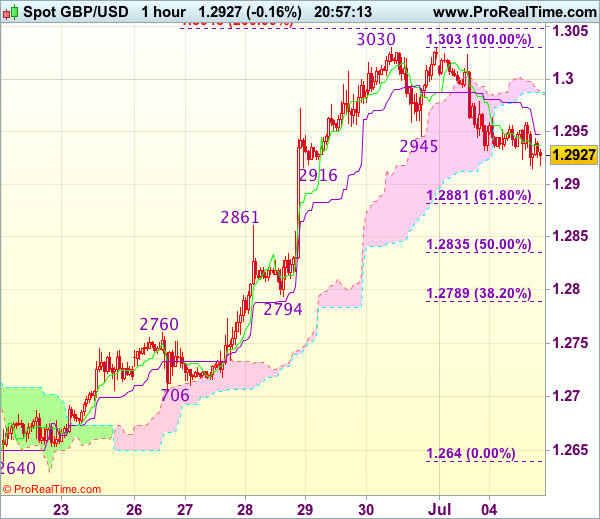
Trade Idea Update: GBP/USD – Buy at 1.2865
GBP/USD - 1.2930
Original strategy :
Buy at 1.2865, Target: 1.3000, Stop: 1.2830
Position : -
Target : -
Stop : -
New strategy :
Buy at 1.2865, Target: 1.3000, Stop: 1.2830
Position : -
Target : -
Stop : -
Cable’s retreat after faltering below last week’s high of 1.3030 suggests consolidation below this level would be seen, hence weakness to 1.2916 support cannot be ruled out, however, reckon downside would be limited to 1.2865-70 and bring another upmove later, above said resistance at 1.3030 would signal recent upmove is still in progress and may extend further gain towards recent high 1.3048 but loss of near term upward momentum should prevent sharp move beyond 1.3075-80 today and reckon 1.3100 would hold on first testing.
In view of this, would not chase this rise here and we are looking to buy cable again on pullback as 1.2900 should limit downside and bring another rally. Below previous resistance at 1.2861 would suggest a temporary top is formed instead, risk weakness to 1.2830-35 (50% Fibonacci retracement of 1.2640-1.3030) but support at 1.2794 should remain intact.
Trade Idea Update: EUR/USD – Buy at 1.1300
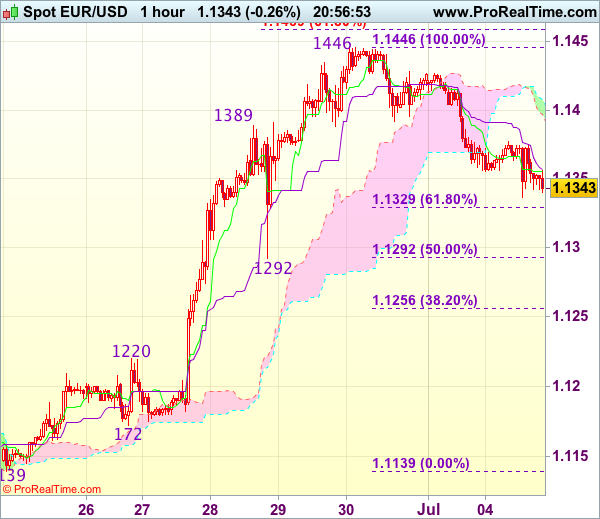
EUR/USD - 1.1347
Original strategy :
Buy at 1.1300, Target: 1.1400, Stop: 1.1265
Position : -
Target : -
Stop : -
New strategy :
Buy at 1.1300, Target: 1.1400, Stop: 1.1265
Position : -
Target : -
Stop : -
As euro’s retreat from last week’s high of 1.1446 has kept the single currency under near term pressure, suggesting initial downside risk remains for retracement of recent upmove to 1.1325-30 (38.2% Fibonacci retracement of 1.1139-1.1446), however, reckon support at 1.1292 (as well as 50% Fibonacci retracement) would hold and bring another rise, above 1.1400-10 would bring retest of said resistance at 1.1446, break there would extend recent rise to 1.1455-60 (61.8% projection of 1.1119-1.1389 measuring from 1.1292), then 1.1480.
In view of this, would not chase this rise here and would be prudent to buy euro on pullback as 1.1292 (previous support as well as 50% Fibonacci retracement of 1.1139-1.1446) should limit downside, bring rebound. Below 1.1270 would abort and signal a temporary top is formed, bring correction to 1.1250-55 first.