
Sample Category Title
Trade Idea Update: USD/JPY – Stand aside
USD/JPY - 113.19
New strategy :
Stand aside
Position : -
Target : -
Stop : -
Although the greenback retreated after rising to 113.47 and consolidation below this level would be seen, reckon downside would be limited to the upper Kumo (now at 112.60) and 112.40 should hold, bring another rise later, above said resistance at 113.47 would signal recent upmove is still in progress for headway to 113.75-80 but loss of momentum should prevent sharp move beyond 114.00, bring retreat later.
In view of this, would not chase this rise here and would be prudent to stand aside for now. Below the lower Kumo (now at 112.40) would suggest top is possibly formed but break of 111.90-95 is needed to add credence to this view, bring test of 111.73 support first.

Further Escalation of the North Korea Crisis
- North Korea overnight carried out its most advanced missile test so far with the launch of what was probably an intercontinental ballistic missile (ICBM). It was the 11th round of missile tests this year, but the first test of the long-ranging ICMB that is needed to reach the US.
- The test underlines that North Korea is not backing down from its nuclear ambitions but instead continues to make progress in its goal to reach the US with a nuclear warhead. It is one of the most difficult military challenges the US has faced since the Cold War. Below, we give a quick summary of the crisis and why it is important.
- For further background analysis and market implications please see Research: The rising risk from North Korea - and what it means for markets, 27 April 2017.
What happened overnight?
On US Independence Day, 4 July, North Korea carried out its most advanced missile test so far with the apparently successful launch of an ICBM. According to North Korean state media the rocket reached an altitude of 2.802km, reached the target 933km away and flew for 39 minutes. If true, it is the first time North Korea has tested an ICBM. It has previously tested rockets with similar technology but not an ICBM that can carry a warhead.
According to the state media it was fired at its highest angle. This makes the distance it travels shorter. But at a lower angle it is estimated by some Western experts that it may be able to reach a range of roughly 6700km, see for example this blog (www.allthingsnuclear.org). US, Japanese and South Korean military officials have not yet been able to confirm it indeed was an ICBM. The missile landed in Japan's Exclusive Economic Zone, according to US, Japanese and South Korean officials.
Why is it important?
The launch is another testimony that North Korea continues to move on with its nuclear ambitions - and that it has made a lot of progress over the past year in its stated aim of becoming able to strike the US with a nuclear warhead. For this, it needs two things: an ICBM that can reach the US and a nuclear weapon that can be miniaturized enough to fit in the cone of a missile. North Korea has escalated missile tests over the past two years and in a New Year speech, North Korean President Kim Jong-Un said North Korea had 'reached the final stage in preparations to test-launch an intercontinental ballistic rocket'. This may have turned out to be true with today's test. On the nuclear side of things, North Korea has carried out five tests in total, with the two most recent last year (the single most recent in September).
It is uncertain how close North Korea is to its stated goal. Experts believe that North Korea may only be a couple of years away from this. At the same time the US has been very clear that it will not allow North Korea to develop the capability of hitting the US with nuclear weapons. It seems clear that a solution will have to be found under the reign of US President Donald Trump and his advisors.
While the Trump administration has highlighted that all options are on the table - including the military option - it is also clear that a military intervention against North. Korea comes with a huge risk as North Korea would probably be able to cause severe casualties in South Korea and possibly Japan before being stopped.
The key thing to watch is still whether North Korea pursues completion of another nuclear test. The US has made clear that this would have consequences - and would need to respond in some way in order not to lose face. North Korea has been ready to do a test for some time according to military intelligence but has refrained from this.
How can North Korea be stopped? What are the scenarios?
This is the million dollar question to which there is no obvious answer. For Kim Jong-Un development of the nuclear deterrence is necessary for the survival of his regime - and possibly himself. Other nations that stopped nuclear weapons programmes were overthrown. Following a nuclear test in January 2016 a commentary in North Korea's state media said 'The Saddam Hussein regime in Iraq and the Gaddafi regime in Libya could not escape the fate of destruction after being deprived of their foundations for nuclear development and giving up nuclear programmes of their own accord.' There are thus no signs that any sanctions or threats are likely to stop the North Korean regime.
In theory a military alliance with China guaranteeing North Korea's safety - as the US is guaranteeing to defend South Korea - could work. But it requires a degree of trust between China and North Korea that does not exist. Another option is that the US eventually allows the development of North Korea's ability to reach the US with a nuclear weapon, simply because the cost of stopping North Korea with military force is deemed too high. This would be a major loss of US credibility, however, and would weaken any US show of force in future conflicts. Finally, using the military option and accepting the potential casualties could be the result if all other options are ruled out. The lack of any obvious solutions is what makes the situation so difficult - and the biggest US military challenge since the end of the cold war.
What does the escalation mean for US-China relations?
The continued escalation is gradually increasing tensions between the US and China again. The relationship got off to a much better start than feared with the successful visit by Chinese President Xi Jinping to Mar-a-Lago in April. Trump acknowledged that China was doing what it could to put pressure on North Korea but that it may not have so much power over North Korea. During the visit Trump said 'After listening 10 minutes, I realised it's not so easy...I felt pretty strongly that they had a tremendous power [over] North Korea... But it's not what you think'. He also called the relationship with China 'outstanding'.
As late as 20 June Trump tweeted 'While I greatly appreciate the efforts of President Xi & China to help with North Korea, it has not worked out. At least I know China tried!'
However, today after the missile launch Trump tweeted '...Hard to believe that South Korea and Japan will put up with this much longer... Perhaps China will put a heavy move on North Korea and end this nonsense once and for all'. It indicates that Trump believes China has not done all it could. This will most likely anger China, although it may continue to keep a calm face publicly.
It comes on top of a range of other issues upsetting China over the past few weeks: apparent US plans for steel tariffs (see Flash Comment: Trump likely to announce tariffs on steel soon, 23 June 2017), the US finalising a USD1.4bn arms sale to Taiwan (www.cnbc.com), labelling China one of the worst human traffickers (www.foxnews.com) and imposing sanctions on a Chinese bank for doing business with North Korea.
Keep an eye on the G20 meeting
Japan said on Monday that the US, South Korea and Japan will have a trilateral summit on North Korea at the G20 meeting in Hamburg this weekend (7-8 July). On Tuesday Japan's prime minister Shinzo Abe also said he would ask China and Russia to play a more constructive role in efforts to stop North Korea.
As the threat from North Korea rises, Japan may increasingly push to scale up its military power, which would most likely anger China and increase tensions in the Asian region.
Another hot issue at the G20 meeting that could make the environment for the talks difficult is the area of trade and protectionism. Trump may send a signal of coming protection of US steel workers or of other areas which would anger both the EU and China.
EURUSD Weakens Further, Risk Remains Lower
EURUSD: The pair closed lower on Monday opening the door for more weakness in the days ahead. Resistance comes in at 1.1400 level with a cut through here opening the door for more upside towards the 1.1450 level. Further up, resistance lies at the 1.1500 level where a break will expose the 1.1550 level. Conversely, support lies at the 1.1300 level where a violation will aim at the 1.1250 level. A break of here will aim at the 1.1200 level. Its daily RSI is bearish and pointing lower supporting this view. All in all, EURUSD faces further downside pressure.

Is Market Volatility Making a Return?
Asian stocks concluded lower on Tuesday while European equities were under pressure as geopolitical tensions stemming from North Korea's missile launch have encouraged investors to develop a more cautious stance. It appears that geopolitical risks are starting to reappear in the headlines, something that has been complemented by reports that President Trump believes China should be doing more to contain the situation.
With the unexpected surprises from last week sparking discussions of volatility making a return, the developments seen today could fuel the speculation further. The re-emergence of geopolitical tensions in Asia, Brexit developments and ongoing political instability in Washington could make for wild trading conditions in the third quarter of 2017.
Yen supported by caution
The Japanese Yen appreciated against its major counterparts during early trading on Tuesday amid risk aversion, with investors adopting a cautious approach following reports of North Korea conducting a long-range missile test. In times of uncertainty and trouble, the Yen remains a trader's best friend and this was illustrated today when the currency gained ground against the US Dollar.
Although the USDJPY eventually clawed back recent losses as of writing, further downside could be expected if uncertainty and geopolitical risk accelerate the flight to safety. From a technical standpoint, the USDJPY has found some resistance at 113.50. A failure of bulls to secure control above this level could open a path lower back towards 111.60.
WTI Crude smashes into $47
WTI bulls crashed into a brick wall in the form of $47 on Tuesday, following reports that OPEC's production in June climbed to its highest levels so far in 2017, as Nigeria and Libya pumped more oil. It's quite remarkable how the seemingly harmless supply cut exemptions for Libya and Nigeria are threatening to sabotage the efforts made by the rest of the group to rebalance the saturated markets.
With rising oil production in the US another painful piece of the equation that continues to compound to the oversupply concerns, WTI Crude is at risk of remaining depressed for a prolonged period of time. Although WTI Crude has staged an impressive rebound from the $42 level, sellers may be enticed to exploit the technical bounce to install renewed rounds of selling, with $45 acting as a level of interest. From a technical standpoint, the $47-48 region should act as a check point for bears to jump back in.
Commodity spotlight - Gold
Gold bulls found support in the form of geopolitical risk during Tuesday's trading session as the metal rebounded from $1220. Although the current market anxiety and flight to safety has the ability to support Gold, the sharp $23 depreciation observed on Monday will be difficult for bulls to claw back. Short term bears remain in control with Gold at risk of depreciating further if the Greenback continues to stabilize. From a technical standpoint, the yellow metal has turned bearish on the daily charts. Weakness below $1220 may open a path towards $1214.
Spot Gold Consolidating above Fresh Seven-Week Low
Spot Gold is consolidating above fresh seven-week low at $1218 posted after sharp fall on Monday. The yellow metal was down nearly 1.8% on strong bearish acceleration triggered by break of former key supports at $1236/35 (former low of 26 June / 200SMA). Recovery attempts were so far limited and holding below pivotal barrier at $1227 (Fibo 38.2% of Monday's fall), signaling extended consolidation before bears resume, as slow stochastic is oversold on daily chart. Technical studies are in firm bearish setup on daily chart and supportive for final push towards target at $1214 (09 May low) and $1209 (50% retracement of $1122/$1296 ascend) in extension. Extended upticks should be capped by falling 200SMA (now reverted to resistance), currently at $1233.
Res: 1227; 1230; 1233; 1236
Sup: 1218; 1214; 1209; 1200
GBP/USD Elliott Wave Analysis
GBP/USD – 1.2933
GBP/USD – Wave 4 is unfolding as an (A)-(B)-(C) and could have ended at 1.7192
As cable’s rebound from 1.2589 turned out to be much stronger than expected, suggesting the correction from 1.3048 has ended there and although price has eased from 1.3030, reckon downside would be limited to 1.2790-00 and bring another rise towards 1.3048 resistance, break there would extend recent upmove from 1.1986 low to 1.3140-50 (38.2% Fibonacci retracement of 1.5018-1.1986) and possibly 1.3200 but near term overbought condition should prevent sharp move beyond 1.3300, risk from there is seen for a retreat later.
Our preferred count on the daily chart is that cable's rebound from 1.3500 (wave (A) trough) is unfolding as a wave (B) with A ended at 1.7043, followed by triangle wave B and wave C as well as wave (B) has possibly ended at 1.7192, below support at 1.4232 would add credence to this count, then further fall to 1.4000 level would follow but reckon downside would be limited to 1.3655 support and price should stay above previous support at 1.3500.
On the downside, whilst initial pullback to 1.2800 cannot be ruled out, reckon support at 1.2760 (previous resistance) would hold and bring another rise later. A daily close below 1.2700-10 would defer and prolong choppy trading below 1.3048, bring weakness to 1.2650-55 but still reckon downside would be limited and said support at 1.2589 should remain intact. In the event sterling drops below this support, this would extend the fall from 1.3048 for retracement of recent upmove to 1.2550, then towards 1.2500.
Recommendation: Buy at 1.2800 for 1.3000 with stop below 1.2700.
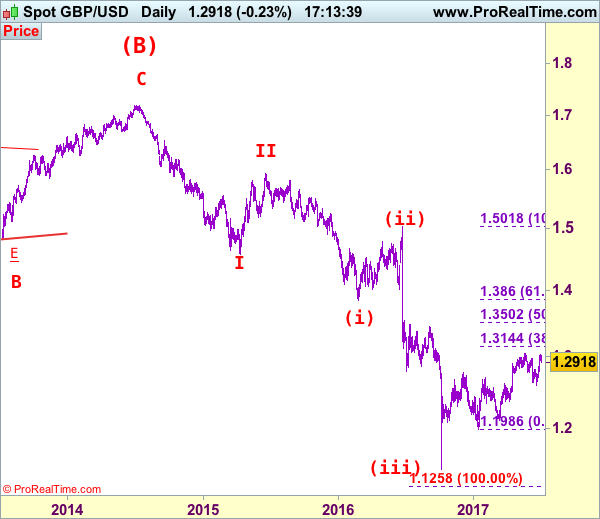
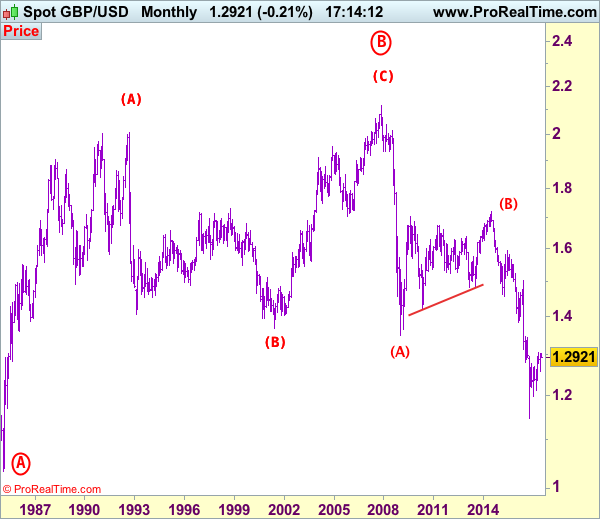
Longer term - Cable's rise from 1.0520 (Feb 1985) to 2.0100 (September 1992) is seen as [A], the decline to 1.3682 is labeled as (B) and (C) wave rally has ended at 2.1162 (9 Nov, 2007) which is also the top of larger degree wave B with circle. The selloff from there is a 5-waver with wave (A) ended at 1.3500 (23 Jan 2009), wave (B) itself is labeled as A: 1.6733, triangle wave B: 1.4813 and wave C as well as top of wave (B) ended at 1.7192 (2014), hence the selloff from there is an impulsive wave (C) with wave I : 1.4566, wave II 1.5930, an extended wave III is unfolding and already exceeded our downside target at 1.3500 and 1.3000, hence weakness to 1.2500 and possibly 1.2000 cannot be ruled out, however, price should stay well above psychological level at 1.0000.
GBP/CHF Elliott Wave Analysis
GBP/CHF – 1.2485
GBP/CHF – Circle wave v ended at 0.9106 and major correction has commenced for subsequent gain to 1.5547.
As sterling has rebounded again after holding above support at 1.2241, retaining our view that further consolidation above this level would be seen and recovery to 1.2540-50 (previous resistance and 38.2% Fibonacci retracement of 1.3069-1.2241) is likely, however, reckon upside would be limited to 1.2655-60 (50% Fibonacci retracement) and bring another decline later (probably in early Q3). Below 1.2390-95 would weakness to 1.2310-15 but break of said support at 1.2241 is needed to signal the fall from 1.3069 top has resumed for test of previous chart support at 1.2215, then 1.2150, having said that, loss of momentum should prevent sharp fall below another chart support at 1.2102 (this year’s low).
To recap the larger degree count, the selloff from 2.4965 (July 2007) is the beginning of wave V with circle and is labeled as 1: 2.3760, 2: 2.4425, wave 3 extension ended at 1.1470, followed by wave 4 at 1.5547, the quick rebound from 0.9106 suggests wave 5 as well as entire circle wave V could have ended there, hence consolidation with mild upside bias is seen for major correction to take place, bring initial test of 1.5547 (previous 4th of a lesser degree).
On the upside, whilst initial recovery to 1.2540-50 cannot be ruled out, reckon upside would be limited to 1.2655-60 (50% Fibonacci retracement of 1.3069-1.2241) and bring another decline later. Only a daily close above resistance at 1.2690-95 would abort and suggest first leg of decline from 1.3069 has ended, bring a stronger rebound to 1.2740-50, however, as top has been formed at 1.3069, still reckon upside would be limited to 1.2785-90 and price should falter below 1.2850-60, bring another decline later.
Recommendation: Sell at 1.2655 for 1.2355 with stop below 1.2755.

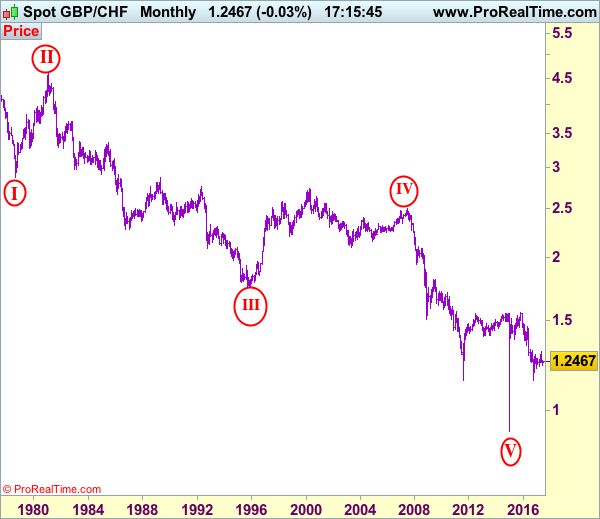
On the Monthly chart, the longer-term count is that major downtrend is under way with circle wave I at 2.8645 (Sep 1.978), then wave II with circle at 4.6175 (Feb 1981), the wave III with circle ended at 1.7425 (Nov 1995) and followed by wave IV with circle at 2.4965 (July 2007 with a short wave C) and wave V with circle has possibly ended at 0.9106. A monthly close above 1.5547 would add credence to this view, bring major correction to 1.7000, then towards psychological level at 2.0000.
Aussie Falls As RBA Maintains Benchmark Rate At Record Low
As expected by market participants, the Reserve Bank of Australia (RBA) today decided to keep rates unchanged at the historical low level of 1.5%. This comes at a time when major central banks around the world are either normalizing rates or are signalling that they're getting closer to start tightening their respective monetary policies.
The RBA's decision followed the release of the Australian retail sales data, which were published a few hours earlier. The figures showed retail sales growing by 0.6% month-on-month during May. This was a positive surprise relative to the 0.2% expected by analysts, but was below April's respective growth rate at 1.0%. On Monday, other figures out of Australia showed an unexpected steep deterioration in building approvals by 5.6% and a slight improvement in the AIG manufacturing index, which rose to 55.0 from 54.8 in May.
The RBA, contrasting the recent hawkish signals from the Federal Reserve, European Central Bank, Bank of England and the Bank of Canada, stuck on its neutral monetary stance that has been in place since August 2016, the last time the Bank engaged in a rate cut. RBA policymakers repeated in today's report that “holding the stance of monetary policy unchanged at this meeting would be consistent with sustainable growth in the economy and achieving the inflation target over time”. In addition, they seemed less confident about Australia's economic outlook, expressing concerns about the high household debt levels that could act as a drag on growth at a time of more or less stagnant wages.
Turning to the forex market's reaction following the central bank's meeting, the aussie steeply declined versus the dollar on the news. Specifically, aussie/dollar fell to as low as 0.7590. The pair traded at 0.7679 previously. It was last down more than seven-tenths of a percent on the day.
It should be noted that Australian inflation was released at 2.1% year-on-year in the first quarter of the year, a level that is within the RBA's target range of 2-3%. In the meantime, GDP growth declined to 1.7% over the same period after a strong recovery in the fourth quarter of 2016.
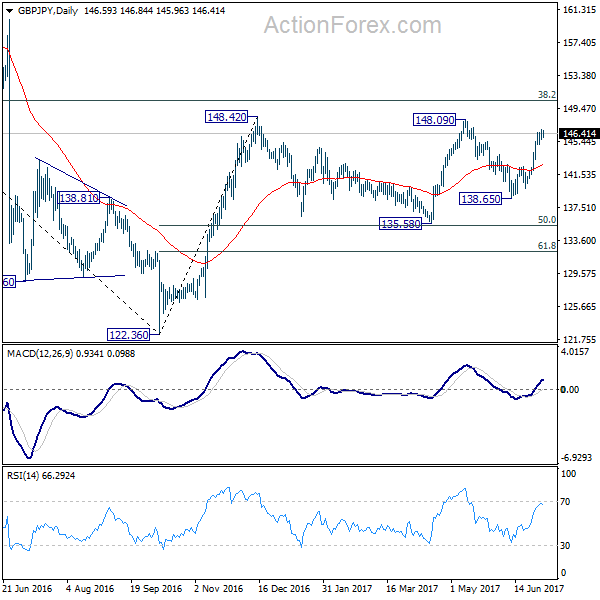
GBP/JPY Daily Outlook
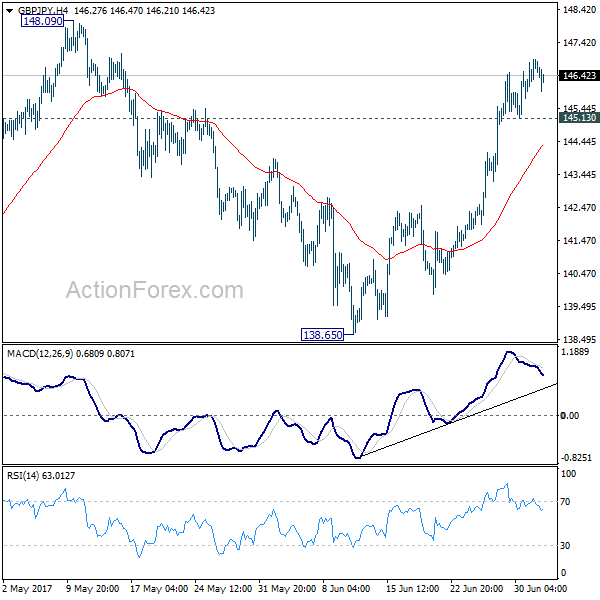
Daily Pivots: (S1) 145.95; (P) 146.43; (R1) 147.20; More....
Upside momentum in GBP/JPY is weak with 4 hour MACD staying below signal line. But with 145.13 minor support intact, further rise is expected to 148.09/42 resistance. Decisive break there will extend whole rally from 122.36 to long term fibonacci level at 150.43 next. On the downside, below 145.13 minor support will turn intraday bias neutral and bring consolidation again before staging another rally.
In the bigger picture, rise from medium term bottom at 122.36 is expected to continue to 38.2% retracement of 196.85 to 122.36 at 150.43. Decisive break there will carry long term bullish implications and pave the way to 61.8% retracement at 167.78. In case the sideway pattern from 148.42 extends, we'd be looking for strong support from 135.58 and 50% retracement of 122.36 to 148.42 at 135.39 to contain downside.
CAC Quiet, Eurozone PPI Misses Estimate
The CAC index is showing little movement in the Tuesday session. The index is currently trading at 5191.80 and is down 0.10% on the day. On the release front, Eurozone PPI declined 0.4% in May, missing the estimate of -0.2%. The index has not posted a gain since February, underscoring weak inflation in the eurozone.
The watershed French election, in which voters have given President Emmanuel Macron's En Marche party a resounding majority in parliament. There is a renewed feeling of optimism in the country, and recent indicators are pointing to stronger consumer confidence and spending levels. French consumer spending climbed 1.0% in June, easily beating the estimate of 0.5%. This marked the indicator's strongest gain since January 2015. The solid manufacturing data points to stronger optimism in the business sector. The economy appears to be improving – a recent INSEE report revised upwards its estimate for France's GDP for the first quarter to 0.5%, up from 0.4% earlier in June. Still, inflation levels remains mired at low levels, as underscored by French Preliminary CPI, which dropped to a flat 0.0%.
The annual European forum of central bankers is generally a non-event for the markets, but last week's gathering was a significant market-mover. Both the euro and the pound recorded sharp gains, following hawkish remarks from ECB President Mario Draghi and BoE Governor Mark Carney. The euro jumped 2.0% last week, catching ECB policymakers by surprise. The bank tried to dampen market speculation about any imminent moves to withdraw stimulus, but the euro remains at high levels. Last week's stampede to snap up euros has forced ECB policymakers to reassess whether what moves, if any, it will announce at the July 20 policy meeting. In June, the ECB removed an easing bias regarding interest rates, effectively closing the door to further rate cuts. However, after the Draghi rally last week, policymakers may be wary about removing a second easing bias regarding the asset-purchase program, to avoid another run on the euro. The ECB has repeated loud and clear that it will not remove QE until inflation levels are closer to the bank's target of 2.0%, but Draghi may have learned the hard way at the ECB forum that the market is picking up a different message than what the ECB thinks it is sending. This could result in the ECB playing it safe and avoiding any meaningful discussion about QE at the July meeting, especially if the euro remains at high levels.
The Federal Reserve has given broad hints that it plans to raise interest rates three times in 2017, but the markets are becoming more skeptical. The odds of a rate hike in December have fallen to 47%, down from 53% last week, according to the CME Group. With the US economy giving a mediocre performance in the first quarter, and inflation levels remains low, there are Fed policymakers who are currently lukewarm to the idea of raising rates again this year. Key economic indicators have not looked particularly sharp in the second quarter, notably housing and consumer spending numbers. If inflation numbers do not improve and GDP reports for Q2 remain soft, the odds of a December hike will drop even further, which could translate into broad losses for the US dollar.