Sample Category Title
Technical Outlook: USDJPY- Bulls Face Strong Headwinds At 113.50 But Bias Remains Bullish
The pair is consolidating under fresh high at 113.47 (the highest since 16 May) posted on strong rally on Monday (the biggest one day rally since 15 June).
Corrective dip to 112.73 in early Europe was short-lived and the price returned above 113.00 handle, maintaining positive tone.
Overall strong bullish tone favors further upside, with firm break above solid barrier at 113.50 to trigger fresh acceleration towards 114.00 and key barrier at 114.36 (11 May high).
Caution on overbought slow stochastic which is forming bearish divergence on daily chart. Increased downside risk could be expected on firm break below 112.80 pivot (Fibo 38.2% of 111.72/113.47 upleg).
Res: 113.50, 113.95, 114.36, 114.65
Sup: 113.05, 112.80, 112.60, 112.39
EUR/JPY Daily Outlook
Daily Pivots: (S1) 128.22; (P) 128.58; (R1) 129.20; More...
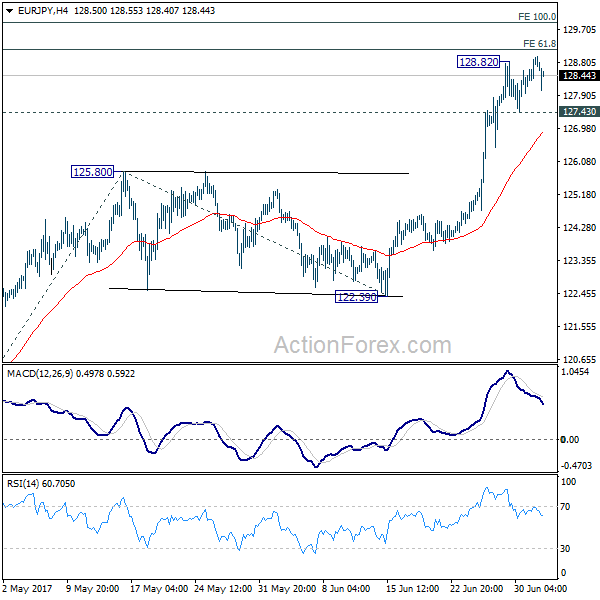
EUR/JPY's rally resumed after brief retreat. Intraday bias is turned back to the upside for 61.8% projection of 114.84 to 125.80 from 122.39 at 129.16 first. We'd be aware of strong resistance between 129.16 and medium term projection level at 129.89 to bring short term topping. On the downside, below 1.2743 will bring deeper pull back to 125.80 resistance turned support.
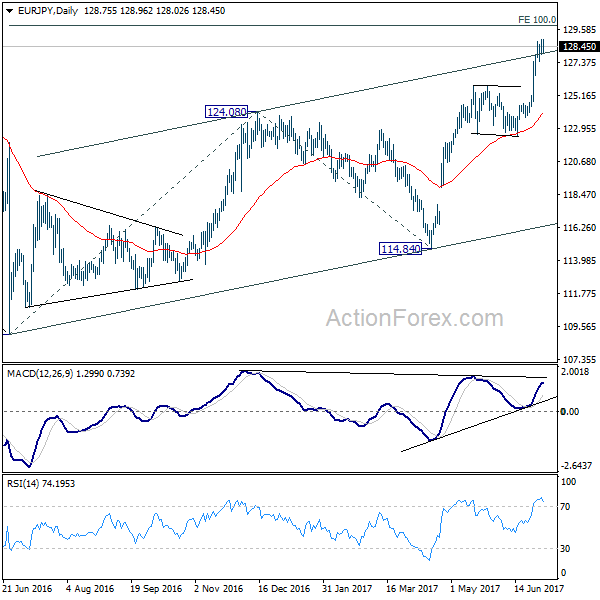
In the bigger picture, the break of 126.09 support turned resistance should have confirmed completion of down trend form 149.76 (2014 high), at 109.03 (2016 low). Current rise from 109.03 should target 100% projection of 109.03 to 124.08 from 114.84 at 129.89 first. Break there will pave the way to 61.8% retracement of 149.76 to 109.03 at 134.20 and above. Medium term outlook will now remain bullish as long as 122.39 support holds.
GOLD Monitoring Support At 1214, SILVER Continued Weakness, CRUDE OIL Pushing Higher.
GOLD Monitoring support at 1214.
Gold's is trading lower. The commodity has broken hourly support located at 1236 (26/06/2017 low). Stronger support is given at 1214 (09/05/2017 low). Hourly resistance can be found at 1258 (23/06/2017 high). Expected to show further monitoring of support at 1214.
In the long-term, the technical structure suggests that there is a growing upside momentum. A break of 1392 (17/03/2014) is necessary ton confirm it, A major support can be found at 1045 (05/02/2010 low).
SILVER Continued weakness.
Silver's bullish bounce quickly faded. Closest support given at 16.29 (26/06/2017 low). has been broken. Strong support is given at 16.06 (09/05/2017 low). Key resistance is given at a distance at 17.75 (06/06/2017 high). The road seems wide open for further decline.
In the long-term, the death cross indicates that further downsides are very likely. Resistance is located at 25.11 (28/08/2013 high). Strong support can be found at 11.75 (20/04/2009).
CRUDE OIL Pushing higher.
Crude oil's momentum seems strong again. Support is given at 42.05 (21/06/2017 low). Expected to show renewed weakness.
In the long-term, crude oil has recovered after its sharp decline last year. However, we consider that further weakness are very likely. Strong support lies at 35.24 (05/04/2016) while resistance can now be found at 55.24 (03/01/2017 high).
EUR/JPY Continued Increase, EUR/GBP Slight Weakness, EUR/CHF Stalling Below 1.0960.
EUR/JPY Continued increase.
EUR/JPY is now consolidating after its recent rally. Key resistance is located at 128.83 (30/06/2017). Hourly support can be found at 127.10 (30/06/2017). Next support is given at 122.56 (18/05/2017 low). Further upside is favored.
In the longer term, the technical structure validates a medium-term succession of lower highs and lower lows. As a result, the resistance at 149.78 (08/12/2014 high) has likely marked the end of the rise that started in July 2012. Strong support at 94.12 (24/07/2012 low) looks nonetheless far away.
EUR/GBP Slight weakness.
EUR/GBP has broken downtrend resistance triggering a move towards support at 0.8719 (16/06/2017 low). Stronger support can be found at 0.8652 (08/06/2017 low). Expected to show continued weakness.
In the long-term, the pair has largely recovered from recent lows in 2015. The technical structure suggests a growing upside momentum. The pair is trading above from its 200 DMA. Strong resistance can be found at 0.9500 psychological level.
EUR/CHF Stalling below 1.0960.
EUR/CHF's short-term bullish pressures are definitely on after clear break of downtrend channel. Hourly support is located at a distance at 1.0792 (03/05/2017 low) while the pair is heading towards resistance given at 1.0987 (12/05/2017 high).
In the longer term, the technical structure is mixed. Resistance can be found at 1.1200 (04/02/2015 high). Yet,the ECB's QE programme is likely to cause persistent selling pressures on the euro, which should weigh on EUR/CHF. Supports can be found at 1.0184 (28/01/2015 low) and 1.0082 (27/01/2015 low).
EUR/GBP Daily Outlook
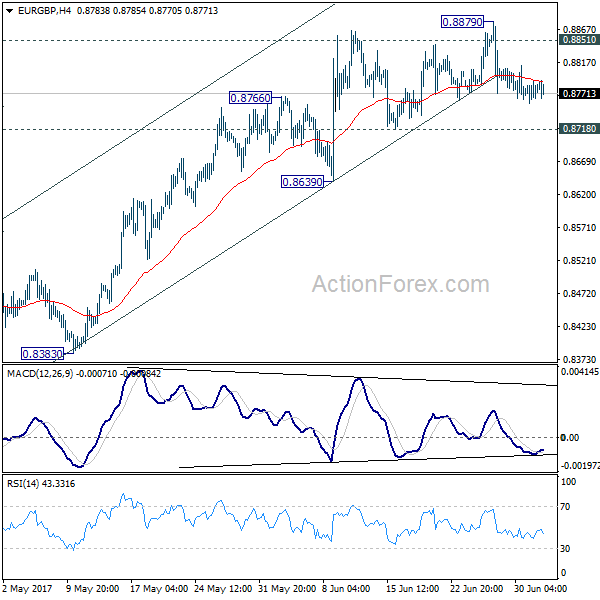
Daily Pivots: (S1) 0.8761; (P) 0.8776; (R1) 0.8795; More...
EUR/GBP continues to stay in consolidation below 0.8879 and intraday bias remains neutral for the moment. On the downside, break of 0.8718 support will argue that rise from 0.8312 has completed. In that case, intraday bias with be turned back to the downside for lower side of the range at 0.8312. Meanwhile, break of 0.8879 and sustained trading above 0.8851 will pave the way to retest 0.9304 high.
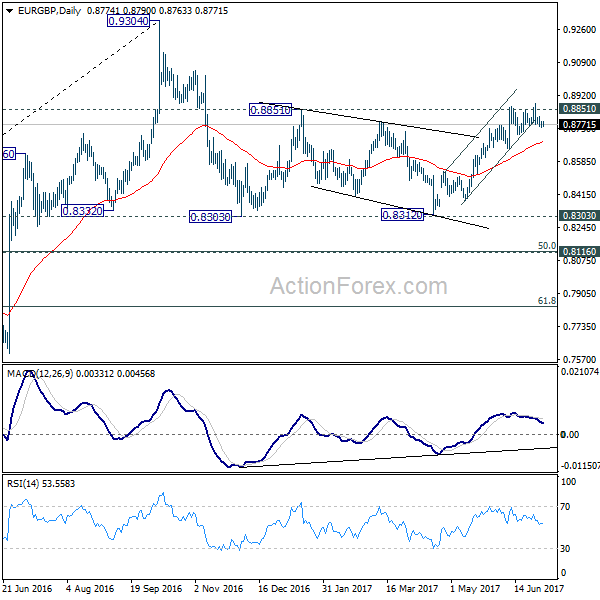
In the bigger picture, price actions from 0.9304 are viewed as a medium term corrective pattern. It's uncertain whether it is finished yet. But in case of another fall, we'd expect strong support from 0.8116 cluster support (50% retracement of 0.6935 to 0.9304 at 0.8120) to contain downside and bring rebound. Whole up trend from 0.6935 is expected to resume after consolidation from 0.9304 completes.
EUR/AUD Daily Outlook
Daily Pivots: (S1) 1.4811; (P) 1.4846; (R1) 1.4867; More...
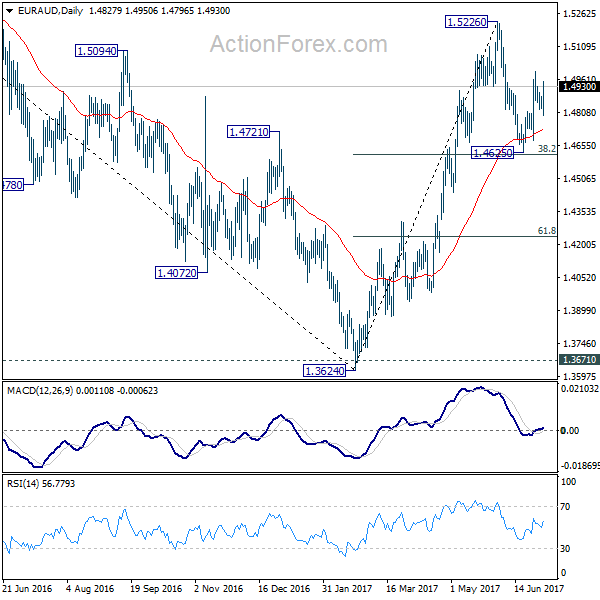
Despite breaching 1.4813 support, EUR/AUD quickly recovered. Intraday bias is neutral first and we're holding on to the bullish view. That is, pull back from 1.5226 has completed at 1.4625, ahead of 38.2% retracement of 1.3624 to 1.5226 at 1.4614. Above 1.4997 will turn bias back to the upside for 1.5226 first. However, firm break of 1.4813 will dampen this view and turn bias back to the downside for 1.4625 support.
In the bigger picture, price actions from 1.6587 medium term top are viewed as a corrective pattern. Such correction should be completed at 1.3624 after defending 1.3671 key support. Rise from 1.3642 would extend to 61.8% retracement of 1.6587 to 1.3624 at 1.5455. Sustained break there will pave the way to retest 1.6587. However, sustained break of 1.4669 support will dampen this bullish view. We'll assess the outlook later after looking at the structure and depth of the pull back.

EUR/CHF Daily Outlook
Daily Pivots: (S1) 1.0928; (P) 1.0940; (R1) 1.0961; More...
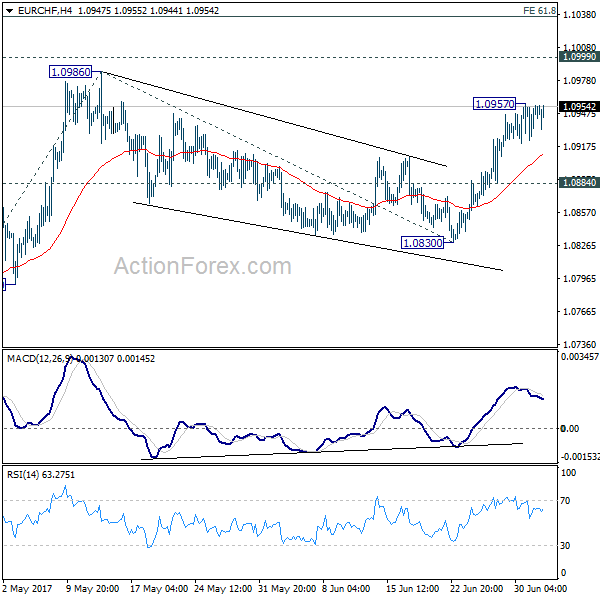
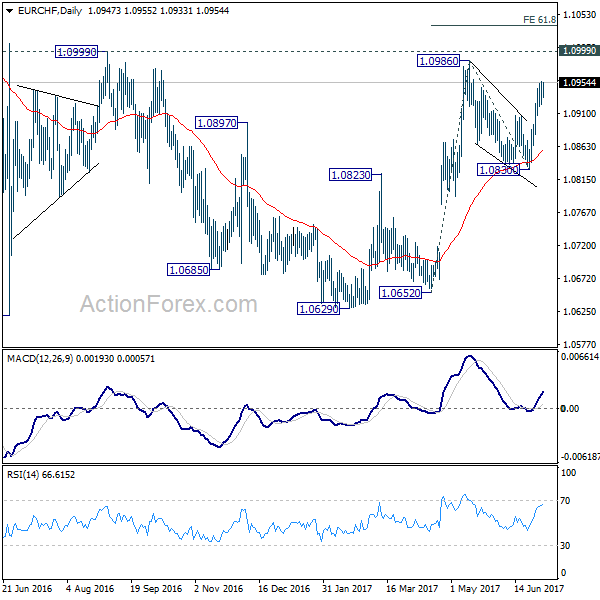
Intraday bias in EUR/CHF remains neutral as it's staying in range below 1.0957 temporary top. Some more consolidations could be seen. But downside of retreat should be contained above 1.0884 support to bring rise resumption. As noted before, the rally from 1.0629 should be resuming. Above 1.0957 will send EUR/CHF through 1.0986/0999 resistance zone to 61.8% projection of 1.0652 to 1.0986 from 1.0830 at 1.1036.
In the bigger picture, the price actions from 1.1198 are seen as a corrective move. Such correction could have completed after defending 38.2% retracement of 0.9771 to 1.1198 at 1.0653. Decisive break of 1.0999 resistance will target a test on 1.1198 high. For now, this will be the preferred case as long as 1.0830 support holds.
DAX Inches Lower As Markets Hunt For Cues
The DAX index has ticked lower in the Tuesday session, as the index is down 0.21%. Currently, the DAX is at 12,449.50. On the release front, it's a very quiet day. There are no US events, as the markets are closed for Independence Day. The sole eurozone indicator was Eurozone PPI, which declined 0.4%, weaker than the forecast of -0.2%. On Wednesday, the Federal Reserve will publish the minutes of its June policy meeting.
The German consumer is spending more, which is good news for the German and eurozone economies. German retail sales posted a solid gain of 0.5%, in May, the strongest since February. Preliminary CPI posted a gain of 0.2% in June, beating the estimate of 0.0%. This reading was an improvement from May, which showed a decline of 0.2%. The German manufacturing sector is in good shape, boosted by a stronger demand for German exports. On Monday, German Manufacturing PMI came in at 59.6, pointing to expansion. We'll get a look at additional manufacturing data later in the week, with the release of Factory Orders and Industrial Production.
The annual European forum of central bankers is generally a non-event for the markets, but last week's gathering was a significant market-mover. Both the euro and the pound recorded sharp gains, following hawkish remarks from ECB President Mario Draghi and BoE Governor Mark Carney. The euro jumped 2.0% last week, catching ECB policymakers by surprise. The bank tried to dampen market speculation about any imminent moves to withdraw stimulus, but the euro remains at high levels. Last week's stampede to snap up euros has forced ECB policymakers to reassess whether what moves, if any to announce at the July 20 policy meeting. In June, the ECB removed an easing bias regarding interest rates, effectively closing the door to further rate cuts. However, after the Draghi rally last week, policymakers may be wary about removing a second easing bias regarding the asset-purchase program, to avoid another run on the euro. The ECB has repeated loud and clear that it will not remove QE until inflation levels are closer to the bank's target of 2.0%, but Draghi may have learned the hard way at the ECB forum that the market is picking up a different message than what the ECB thinks it is sending. This could result in the ECB playing it safe and avoiding any meaningful discussion about QE at the July meeting, especially if the euro remains at high levels.
The Federal Reserve has given broad hints that it plans to raise interest rates three times in 2017, but the markets are becoming more skeptical. The odds of a rate hike in December have fallen to 47%, down from 53% last week, according to the CME Group. With the US economy giving a mediocre performance in the first quarter, and inflation levels remains low, there are Fed policymakers who are currently lukewarm to the idea of raising rates again this year. Key economic indicators have not looked particularly sharp in the second quarter, notably housing and consumer spending numbers. If inflation numbers do not improve and GDP reports for Q2 remain soft, the odds of a December hike will drop even further, which could translate into broad losses for the US dollar.
USD/CHF Continued Bullish Consolidation, USD/CAD Consolidating Around 1.3000, AUD/USD Strong Decline.
USD/CHF Continued bullish consolidation.
USD/CHF is pushing higher but the technical structure suggests further weakness. Hourly resistance can be found at 0.9771 (09/06/2017 high). Strong resistance is given at 1.0107 (10/04/2017 high). Hourly support is given at 0.9553 (30/06/2017 low). Expected to show continued bearish pressures.
In the long-term, the pair is still trading in range since 2011 despite some turmoil when the SNB unpegged the CHF. Key support can be found 0.8986 (30/01/2015 low). The technical structure favours nonetheless a long term bullish bias since the unpeg in January 2015.
USD/CAD Consolidating around 1.3000.
USD/CAD is way into bearish mode. Support is given at 1.2965 (30/06/2017 low). Resistance is located at 1.3014 (02/15/2017). Expected to show continued downside pressures.
In the longer term, the pair lies in a bullish channel since a year. Strong resistance is given at 1.4690 (22/01/2016 high). Long-term support can be found at 1.2461 (16/03/2015 low).
AUD/USD Strong decline.
AUD/USD's technical structure is bullish since early May. Recovery bounce near former resistance at 0.7636 is gaining momentum. The pair has lost around 80 pips yesterday. Expected to see further consolidation after such a move. A break of support at 0.7520 (09/06/2017 low) would indicate a trend reversal.
In the long-term, we are waiting for further signs that the current downtrend is ending. Key supports stand at 0.6009 (31/10/2008 low) . A break of the key resistance at 0.8295 (15/01/2015 high) is needed to invalidate our long-term bearish view.
EUR/USD Continued Bearish Consolidation, GBP/USD Weakening After Failing To Monitor Resistance Given At 1.3046, USD/JPY Riding Within Symmetrical Triangle.
EUR/USD Continued bearish consolidation.
EUR/USD is now consolidating after its recent rally above 1.1400. Hourly support can be found at 1.1076 (18/05/2017 low). Stronger support lies at 1.0842 (11/05/2017 low).
In the longer term, the momentum is clearly negative. We favour a continued bearish bias towards parity. Key resistance holds at 1.1714 (24/08/2015 high) while strong support lies at 1.0341 (03/01/2017 low).

GBP/USD Weakening after failing to monitor resistance given at 1.3046.
GBP/USD is consolidating lower. The pair failed to monitor resistance given at 1.3046 (18/05/2017 high). Hourly support is given at 1.2923 (intraday low). Expected to show renewed short-term bullish pressures.
The long-term technical pattern is even more negative since the Brexit vote has paved the way for further decline. Long-term support given at 1.0520 (01/03/85) represents a decent target. Long-term resistance is given at 1.5018 (24/06/2015) and would indicate a long-term reversal in the negative trend. Yet, it is very unlikely at the moment.
USD/JPY Riding within symmetrical triangle.
USD/JPY is riding higher within symmetrical triangle. Hourly support can be found at 111.73 (30/06/2017 low). Strong support is located at 108.13 (17/04/2017 low). Expected to show continued pressures within symmetrical pressures.
We favor a long-term bearish bias. Support is now given at 96.57 (10/08/2013 low). A gradual rise towards the major resistance at 135.15 (01/02/2002 high) seems absolutely unlikely. Expected to decline further support at 93.79 (13/06/2013 low).