

Sample Category Title
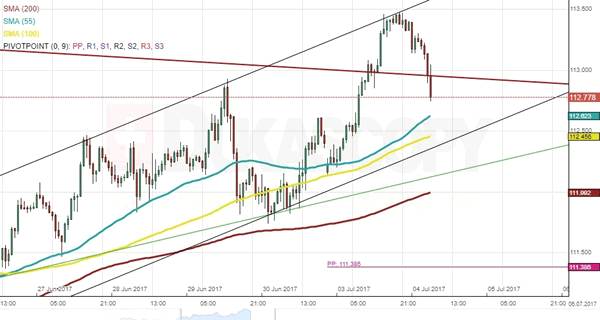
USDJPY Analysis: Limited By 100-Hour SMA
USD/JPY was driven by strong upside momentum that resulted in the rate breaking the down-trend on Monday. The rate halted near the 113.40 mark and retraced back to the given line. Near-term technical indicators are bearish, suggesting that the US Dollar may trade lower. A possible stopping point may be the 100-hour SMA at 112.45. In case of a U-turn at this level, this move may confirm the formation of a minor ascending channel. The next support of importance is the 200-hour SMA circa 112.00. The monthly R1 at 113.94 should be the upside limit for today. On the contrary, the given move above the down-trend may likewise be a false breakout, thus requiring to re-adjust the given line. In this scenario, the rate is expected to test the aforementioned 200-hour SMA.
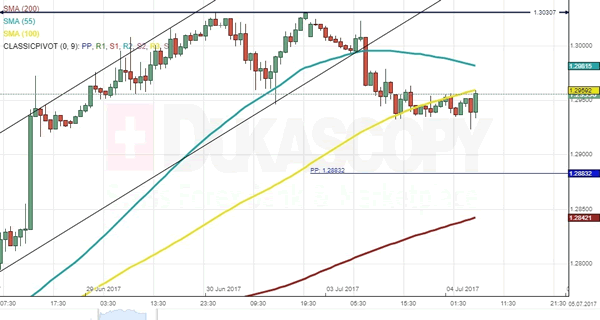
GBPUSD Analysis: Limited By 100-Hour SMA
The Pound responded negatively to weak UK Manufacturing PMI mid-Monday, thus pushing the rate through the bottom channel boundary. The subsequent action did not form any distinctive direction and resulted in slight volatility sideways. The 100-hour SMA was breached to the downside with little hindrance; however, it did continue to function effectively as a resistance level. It seems that the bearish sentiment may prevail in the upcoming hours prior to edging higher late Tuesday. Immediate support is formed by the 100– and 55-hour SMAs at 1.2958 and 1.2983, respectively. Nevertheless, the main upside limit is considered to be circa 1.3029, as the Sterling had already failed to overcome this level for two consecutive sessions, thus forming a double top.
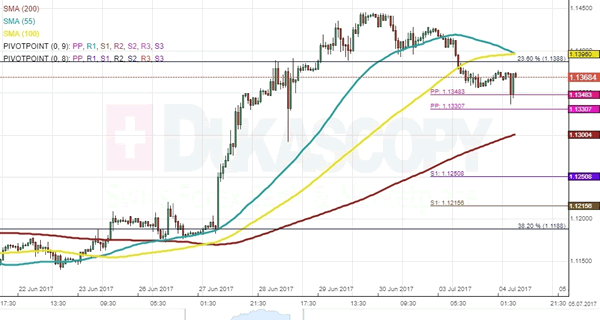
EUR/USD Analysis: Retreats Below 1.14 Mark
On Tuesday morning, the common European currency had retreated below the 1.1350 mark against the US Dollar. However, the combined support of the weekly and monthly pivot points at 1.1348 and 1.1331, respectively, proved strong enough to force the currency exchange rate for a rebound. It can be expected that the pair regains some of the lost ground before it faces a notable resistance level. Most likely the resistance will be provided by the 23.60% Fibonacci retracement level at the 1.1388 mark. The retracement level is set to be reinforced by the resistance of the 55- and 100-hour SMAs, which were located at 1.1396 on Tuesday morning. It could be clearly observed that the simple moving averages will approach the pair from the upside.
UK Manufacturing PMI At Three-Month Low Of 54.3 In June
'While growth slowed in June, the average of the past three surveys pointed to the fastest rate of quarterly growth in the sector for three years.' — George Nikolaidis, EEF
Manufacturing activity in Britain slowed unexpectedly last month, a private survey showed on Monday. Markit report showed that its PMI for the UK manufacturing sector came in at 54.3 points in June, falling to a three-month low from a downwardly-revised figure of 56.3 in the preceding month. However, analysts expected a smaller decline to 56.4 for the month from May's originally reported 56.7. Growth of the country's manufacturing output slowed as businesses showed smaller increases in demand for new domestic orders, while export orders marked the weakest pace of growth in five months. Though, some economists expect the UK economy to show stronger growth in the Q2 with stronger competitiveness boosted by the weak Sterling. However, export orders are set to put downward pressures on further economic expansion. Meanwhile, overall confidence weakened to a seven-month low amid the beginning of the Brexit talks and more uncertainties surrounding the UK outlook. Opposite to Britain's faltering manufacturing sector, manufacturing activity in other EU countries rose to its highest level in six years in June.
US Manufacturing Strengthens Significantly In June
'The ISM index provides further evidence that the prospects for the manufacturing sector remain bright.' - Andrew Hunter, Capital Economics.
US manufacturing activity rose more than expected last month, official figures showed on Monday. The Institute for Supply Management reported its Purchasing Managers' Index for the manufacturing sector increased to 57.8 in June, up from 54.9 registered in the preceding month. That marked the strongest reading since August 2014, reflecting improvements in economic conditions both within the country and abroad. The report showed that 15 of 18 sectors tracked by the ISM expanded in June. Moreover, the New Orders Index jumped to 63.5 last month from 59.5 in May, while production surged to 62.4. Furthermore, the Prices Paid Index fell to this year's lowest level of 55.0, though, the reading above 50 point level still indicated higher prices of raw materials. Overall, the ISM survey suggested that the US economy would show a sharp rebound for the June quarter. After the release, the Atlanta Fed raised its second-quarter GDP growth forecast to a 3.0% annual rate, up from 2.7% expected earlier. In addition, experts suggest that higher overseas demand is likely to support rising confidence in the global economic outlook.
Australian Retail Sales Grow At Faster-Than-Expected Pace In May
'Notwithstanding, the last two retail trade prints have been particularly encouraging and suggest that consumer spending should post a healthy lift in the second quarter.' - Gareth Aird, CBA
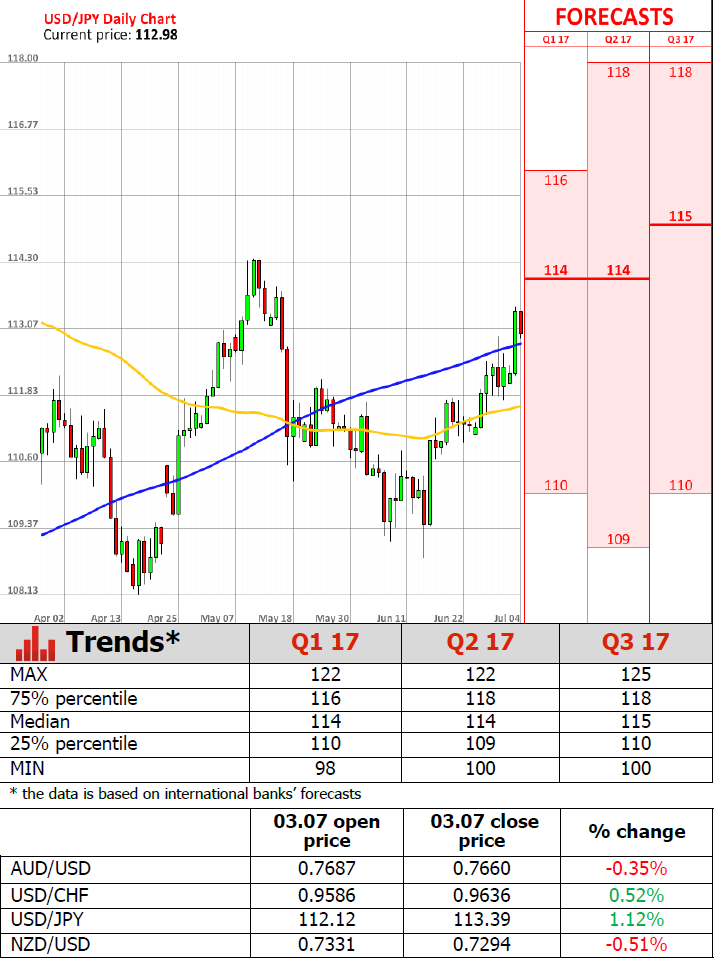
Australian retail sales increased more than expected over the course of May, a fresh release showed on Monday. The Australian Bureau of Statistics reported that the country's retail sales surged at a seasonally adjusted pace of 0.6% in May, following the preceding month's gain of 1.0%, which was the strongest in nearly two years. The survey showed the reading topped market forecasts for a modest 0.3% increase, suggesting that consumer spending was recovering after a sluggish start this year. Moreover, yearly growth in Australian retail sales advanced to 3.2%, with gains posted by household goods, food retailing, department stores and catering. However, some experts suggested that May's data were partially supported by the weather-related, temporary factors. Separately, other economic indicators pointed to a likely consumer spending rebound amid strong data on tourism, the labour market and new car sales. To assist further economic expansion, the Reserve Bank of Australia decided to keep its key interest rates at a record low of 1.50% and monetary policy unchanged as anticipated.
Forex Technical Analysis: EUR/USD, USD/JPY, GBP/USD
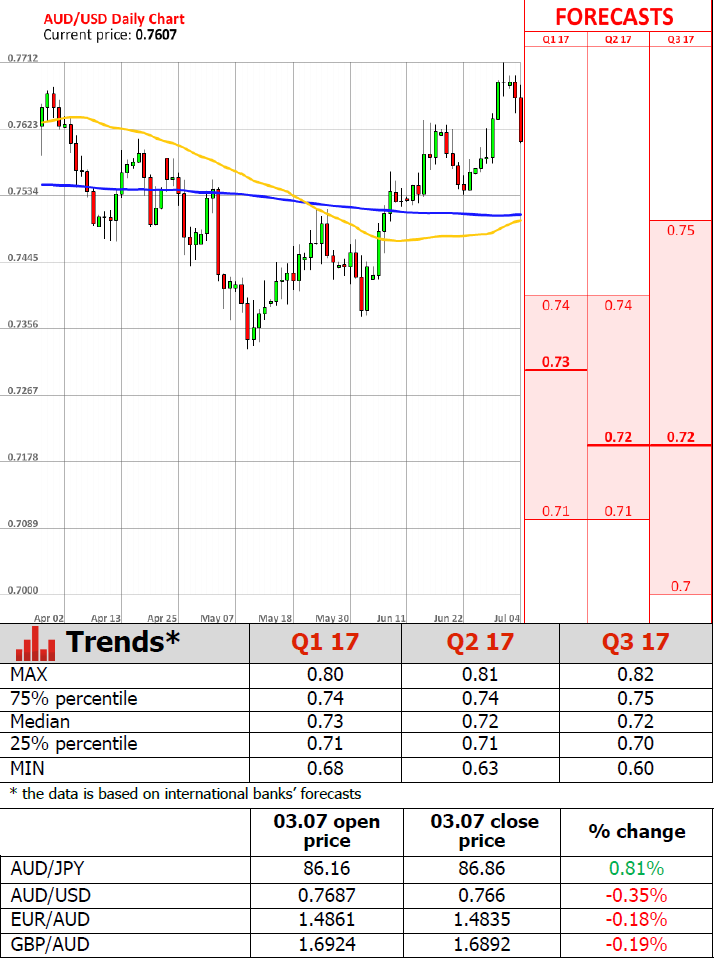
EUR/USD
Current level - 1.1355
The outlook remains bearish below 1.1385 minor resistance, for a tight test of 1.1290 support area. Crucial on the upside is 1.1425 and only a violation of the latter will signal a renewal of the general uptrend for 1.1610.
| Resistance | Support | ||
| intraday | intraweek | intraday | intraweek |
| 1.1385 | 1.1450 | 1.1290 | 1.1020 |
| 1.1425 | 1.1610 | 1.1290 | 1.0838 |
USD/JPY
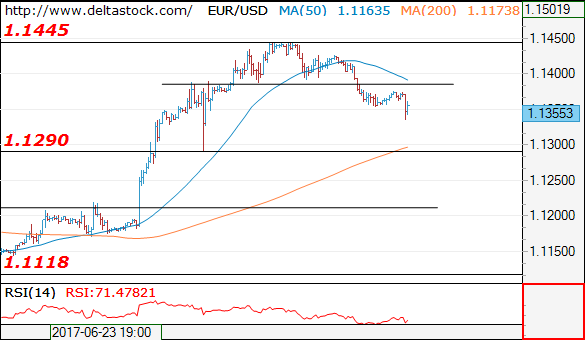
Current level - 112.90
The uptrend is still intact despite intraday's pullback from 113.45 and crucial on the downside is 111.70. Initial target projection lies at 114.35.
| Resistance | Support | ||
| intraday | intraweek | intraday | intraweek |
| 113.45 | 114.30 | 112.70 | 110.30 |
| 114.30 | 115.50 | 111.70 | 108.81 |
GBP/USD
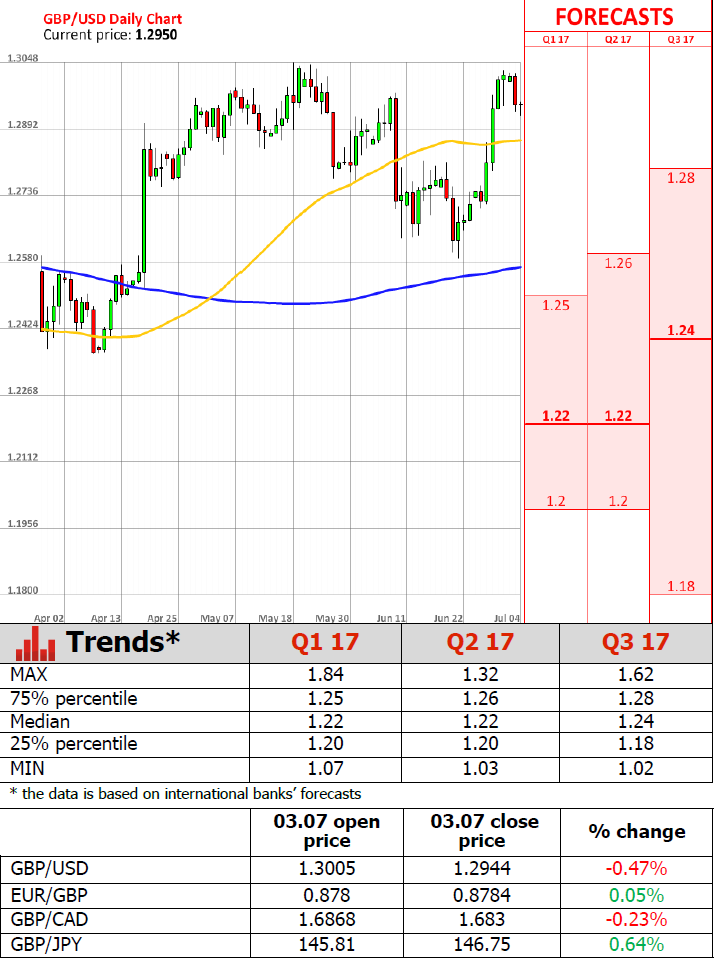
Current level - 1.2944
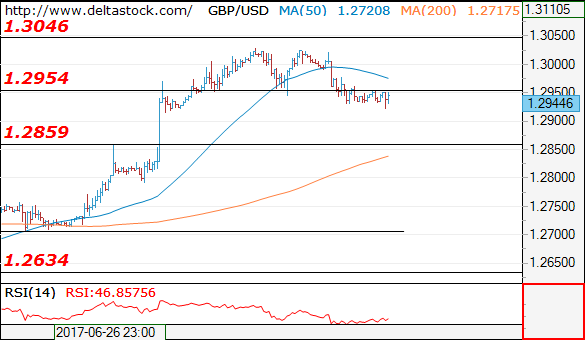
The intraday bias is negative, for a slide towards 1.2860, Key resistance lies at 1.2990.
| Resistance | Support | ||
| intraday | intraweek | intraday | intraweek |
| 1.2990 | 1.3130 | 1.2860 | 1.2635 |
| 1.3050 | 1.3500 | 1.2790 | 1.2480 |
Trade Idea: EUR/JPY – Buy at 127.00
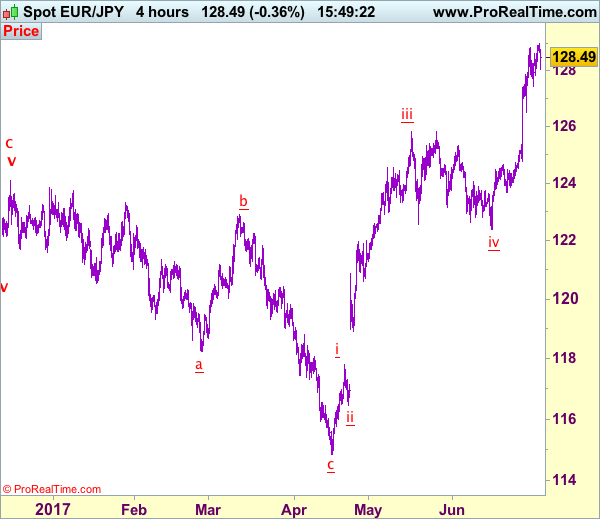
EUR/JPY - 128.60
Recent wave: wave v of (C) ended at 94.12 and major correction in wave A has ended at 149.79
Trend: Near term up
Original strategy:
Buy at 127.00, Target: 129.00, Stop: 126.40
Position: -
Target: -
Stop: -
New strategy :
Buy at 127.00, Target: 129.00, Stop: 126.40
Position: -
Target: -
Stop:-
Although the single currency resumed recent upmove, lack of follow through buying on break of previous resistance at 128.83 (last week’s high) suggests consolidation would be seen and pullback to 128.00-05 cannot be ruled out, however, reckon downside would be limited to 127.40-45 and renewed buying interest should emerge around 127.00, bring another rise later, above 129.00 would extend recent upmove to 129.50-60 but near term overbought condition should prevent sharp move beyond psychological level 130.00.
In view of this, we are looking to reinstate long on pullback as 127.00 should limit downside. Below support at 126.49 would defer and suggest top is possibly formed, risk correction to 126.00 and later towards 125.40-50.
Our latest preferred count is that wave (ii) is ABC-X-ABC which ended at 123.33 and wave (iii) is unfolding with wave iii ended at 100.77, followed by wave iv at 111.57 and wave v as well as the wave (iii) has ended at 97.04, followed by wave (iv) at 111.43 and wave (v) has ended at 94.12 which is also the end of the larger degree v, this also implied the major wave (C) has also ended there, hence major correction has commenced from there with (A) leg unfolding in its lower degree wave c which has possibly ended at 145.69. Under this count, A-B-C wave (B) has commenced with A leg ended at 136.23, wave B at 143.79 and wave C has possibly ended at 149.79.
Our larger degree count is that the decline from 139.26 is wave (C) and is sub-divided into a diagonal triangle i-ii-iii-iv-v with wave i - 105.44, wave ii- 123.33, wave iii - 97.03, wave iv - 111.43, followed by the final wave v as well as the end of wave (C) at 94.12, this also mark the bottom of larger degree wave B. Under this count, major rise in wave C has commenced as an impulsive wave with minor wave III ended at 145.69, wave V is still in progress for further gain to 150.00. Having said that, this so-called wave V could well be the first leg of larger degree 5-waver wave C and this wave C should bring at least a retest of wave A top at 169.97 (July 2008).
Technical Outlook: AUDUSD Falls As Market Expected More Hawkish Tone From RBA
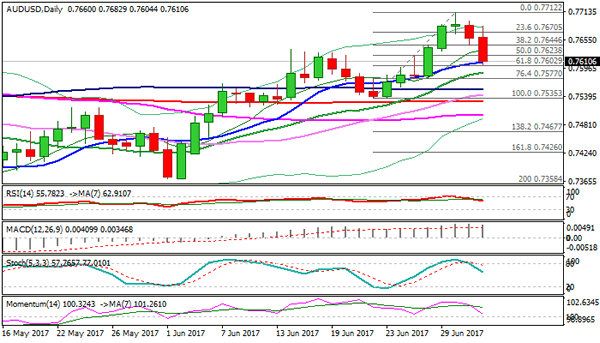
The Aussie dollar fell sharply on Tuesday after RBA kept interest rates unchanged at record low at 1.5%, as widely expected, but following rate statement disappointed markets. RBA kept neutral bias, showing no hurry to hike, while markets expected more hawkish wording after ultra hawkish comments from former board member Edwards last week, who signaled possibility of very aggressive approach in 2018/19. The Australian dollar fell to 0.7604 (Fibo 61.8% of 0.7535/0.7712 upleg) on strong post-RBA bearish acceleration from session high at 0.7682, extending pullback into second straight day.
Monday's strong close in red confirmed reversal pattern, as today's fresh bearish acceleration turned near-term focus lower and south-heading daily RSI/slow stochastic showing more room at the downside.
Fresh bearish signal could be expected on close below 0.7600 that would expose a cluster of MA supports below, starting with 20SMA at 0.7588, followed by 100SMA at 0.7553 and 30SMA at 0.7543, which guard key near-term support at 0.7535 (22 June trough/daily cloud top / Kijun-sen line).
At the upside, broken daily Tenkan-sen marks initial resistance at 0.7623, followed by broken Fibo 38.2% at 0.7644 and session high at 0.7682.
Res: 0.7623, 0.7644, 0.7682, 0.7694
Sup: 0.7604, 0.7588, 0.7577, 0.7553
Trade Idea: AUD/USD – Sell at 0.7635
AUD/USD – 0.7608
Recent wave: Wave 5 ended at 1.1081 and major correction has commenced for fall to 0.7000 and then towards 0.6500-10
Trend: Near term up
New strategy :
Sell at 0.7635, Target: 0.7500, Stop: 0.7685
Position: -
Target: -
Stop:-
Aussie’s retreat after rising to 0.7712 suggests top has possibly been formed there and consolidation with mild downside bias is seen for test of 0.7575-80, however, break there is needed to signal a temporary top has been formed, bring further all to 0.7535 support but break there is needed to add credence to this view, bring correction of recent rise to 0.7500.
In view of this, we are looking to sell aussie on recovery as 0.7635-40 should limit upside. Above 0.7655-60 would risk test of intra-day resistance at 0.7683 but only break there would signal the retreat from 0.7712 has ended instead, bring retest of this level later.
On the 4-hour chart, the move from 0.8066 is the wave 5 with i: 0.8860, ii: 0.8315, wave iii is an extended move ended at 1.0183, iv: 0.9706 and wave v has ended at 1.1081 (also the top of entire wave 5). The subsequent selloff is the major correction which is unfolding as ABC-X-ABC and 2nd A leg has ended at 0.8848, followed by a-b-c wave B which ended at 0.9758, hence, 2nd C wave is now in progress and indicated downside target at 0.7000 and 0.6950 had been met, so further fall to 0.6710-20 cannot be ruled out.
