
Sample Category Title
RBA Disappointed As It Failed To Hint Rate Hike
RBA left the cash rate unchanged at 1.5% in June. While the decision had been widely anticipated, Aussie slumped after the announcement as the central bank failed to deliver a more hawkish tone as its US and European counterparts did. Policymakers affirmed that Australian economy would continue to grow gradually. Yet, they pointed to the strength in Australian dollar and subdue inflation as key reasons for standing on the sideline. Meanwhile, RBA remained concerned over the overheating housing market.
Policymakers judged that the country's economy would 'strengthen gradually, with the transition to lower levels of mining investment following the mining investment boom almost complete' They acknowledged that 'business conditions have improved and capacity utilization has increased” while 'business investment has picked up in those parts of the country not directly affected by the decline in mining investment' Yet, they added that 'consumption growth remains subdued, reflecting slow growth in real wages and high levels of household debt'
The central bank noted that the economy would continue to be boosted by low interest rates, but warned that appreciation in the exchange rate is offsetting the effect. As suggested in the statement RBA reiterated the caution that 'an appreciating exchange rate would complicate this adjustment'
On the housing market, policymakers noted that the conditions are varied across the country. As suggested in the statement, 'in the eastern capital cities, a considerable additional supply of apartments is scheduled to come on stream over the next couple of years. Rent increases are the slowest for two decades. Growth in housing debt has outpaced the slow growth in household incomes' Policymakers noted that ”supervisory measures should help address the risks associated with high and rising levels of household indebtedness'
The market was disappointed as RBA did not deliver a more hawkish tone, as what was done by central banks in the UK, Eurozone and even Canada. Last week, BOE's Mark Carney suggested that rate hike debate was building and growth would be a key issue for discussion. ECB President Mario Draghi also delivered some hawkish comments last Tuesday while there have been heightening speculations that BOC would hike rate, for the first time in 7 years, in as soon as next week.
Trade Idea : USD/JPY – Stand aside
USD/JPY - 112.85
Most recent candlesticks pattern : N/A
Trend : Near term up
Tenkan-Sen level : 113.08
Kijun-Sen level : 112.96
Ichimoku cloud top : 112.33
Ichimoku cloud bottom : 112.22
New strategy :
Stand aside
Position : -
Target : -
Stop : -
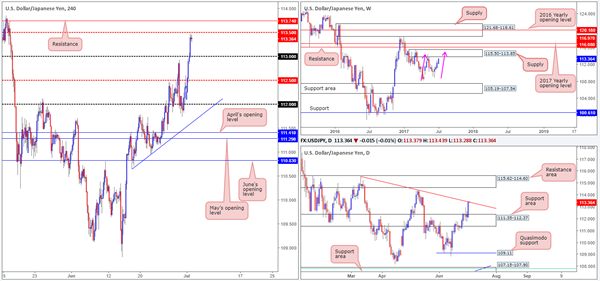
Although the greenback has retreated after rising to 113.47 and consolidation below this level would be seen, reckon downside would be limited to 112.60 and the upper Kumo (now at 112.33) should hold and bring another rise later, above said resistance at 113.47 would signal recent upmove is still in progress for headway to 113.75-80 but loss of momentum should prevent sharp move beyond 114.00, bring retreat later.
In view of this, would not chase this rise here and would be prudent to stand aside for now. Below the lower Kumo (now at 112.22) would suggest top is possibly formed but break of 111.90-95 is needed to add credence to this view, bring test of 111.73 support first.

Daily Technical Analysis: EUR/USD, USD/JPY Wave 4 Arrives At Fibonacci Decision Zone
Currency pair EUR/USD
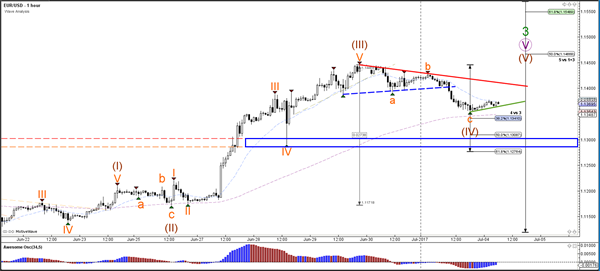
The EUR/USD is building a pullback after breaking above resistance (dotted lines).A bullish bounce could see price approach the Fibonacci targets of wave 5 (purple) which could complete wave 3 (green).
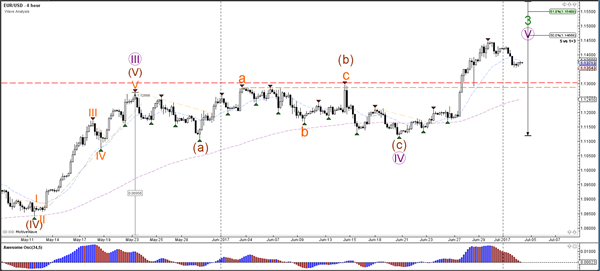
The EUR/USD broke the support trend line (dotted blue) and completed its ABC zigzag correction (orange) within wave 4 (brown). The Fibonacci levels of wave 4 vs 3 (brown) plus the broken resistance levels (blue box) are a key decision zone (point of confluence) and could act as support. A bullish bounce confirms the wave 4 whereas a bearish beak invalidates it.
Currency pair USD/JPY
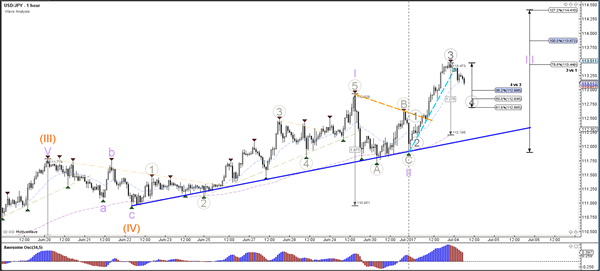
The USD/JPY is moving higher towards the Fibonacci targets of wave 3 (purple) and wave 5 (orange).
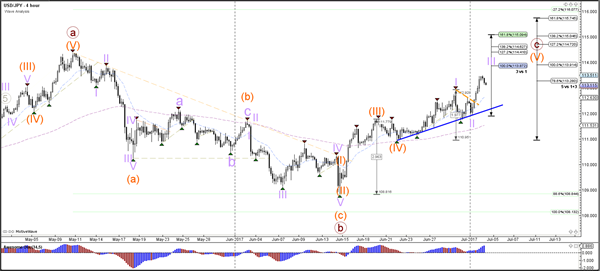
The USD/JPY could be building a wave 4 (grey) retracement as long as price stays above the 50-61.8% Fibonacci level. The most used Fib for wave 4 (grey) is the 38.2% level.
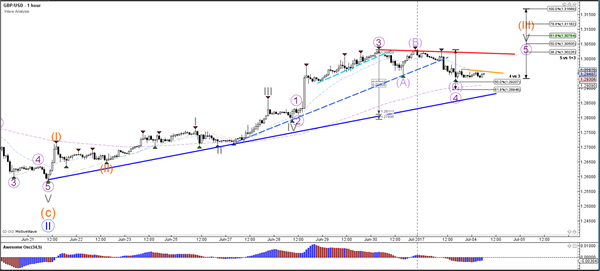
Currency pair GBP/USD
The GBP/USD bullish momentum is hesitating with breaking above the previous top (red). A break above red could see an uptrend continuation towards the Fibonacci targets of wave 3 vs 1 (orange).
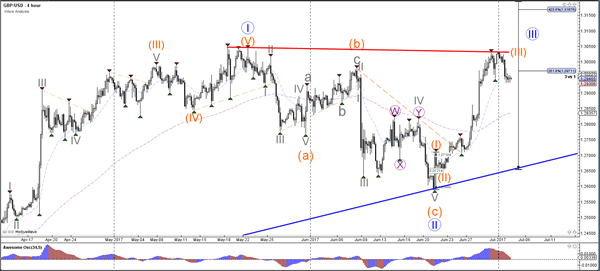
The GBP/USD could be building a wave 4 pullback (purple) as long price stays above the Fibonacci levels of wave 4 vs 3 and the support trend line (blue).. A bullish continuation could complete wave 4 and 5 (purple) within wave 3 (orange).
Daily Technical Outlook And Review: EUR/USD, GBP/USD, AUD/USD, USD/JPY, USD/CAD, USD/CHF, DOW 30, GOLD
A note on lower timeframe confirming price action...
Waiting for lower timeframe confirmation is our main tool to confirm strength within higher timeframe zones, and has really been the key to our trading success. It takes a little time to understand the subtle nuances, however, as each trade is never the same, but once you master the rhythm so to speak, you will be saved from countless unnecessary losing trades. The following is a list of what we look for:
- A break/retest of supply or demand dependent on which way you're trading.
- A trendline break/retest.
- Buying/selling tails ... essentially we look for a cluster of very obvious spikes off of lower timeframe support and resistance levels within the higher timeframe zone.
- Candlestick patterns. We tend to only stick with pin bars and engulfing bars as these have proven to be the most effective.
We typically search for lower-timeframe confirmation between the M15 and H1 timeframes, since most of our higher-timeframe areas begin with the H4. Stops are usually placed 1-3 pips beyond confirming structures.
EUR/USD
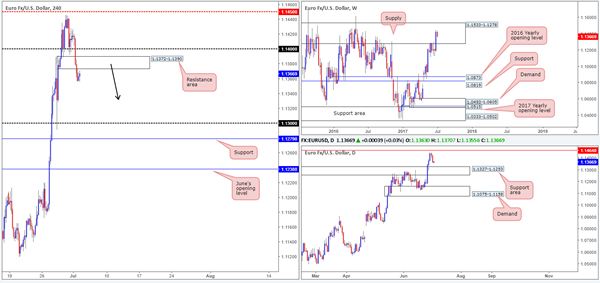
Across the board the US dollar advanced for a second consecutive day on Monday, consequently forcing the EUR southbound. Both the 1.14 handle and a H4 demand base at 1.1372-1.1390 were taken out, leaving H4 price free to finish the day around the 1.1360 mark.
Seeing the H4 candles now trading only inches away from retesting the underside of the recently broken demand zone, would we consider this to be a stable enough platform to sell today? Yes. The reasons behind our decision can be seen on the bigger picture. Weekly price remains loitering within the walls of a major supply zone drawn from 1.1533-1.1278. On the daily chart, there's space for the candles to continue moving south at least until the pair connects with the support area fixed at 1.1327-1.1253.
Our suggestions: Granted, we do seem to have a higher-timeframe connection regarding the H4 resistance area, but we would still require additional confirmation in the form of a H4 bearish candle reversal, before pulling the trigger. This is largely to help avoid any fakeout up to the 1.14 neighborhood. Should a trade come to fruition from 1.1372-1.1390, we'd be looking to ride the train south until we reach 1.1327, followed closely by the 1.13 handle.
Data points to consider: No high-impacting events on the docket today. US banks closed in observance of Independence Day.
Levels to watch/live orders:
- Buys: Flat (stop loss: N/A).
- Sells: 1.1372-1.1390 ([waiting for a reasonably sized H4 bear candle – preferably a full-bodied candle – to form before pulling the trigger is advised] stop loss: ideally beyond the candle's wick).
GBP/USD
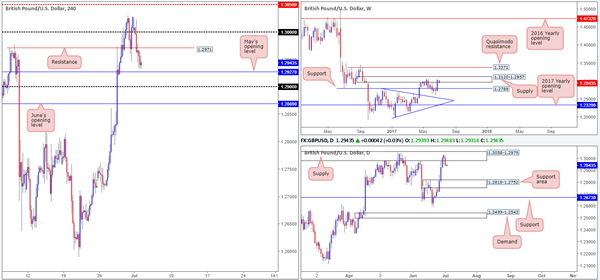
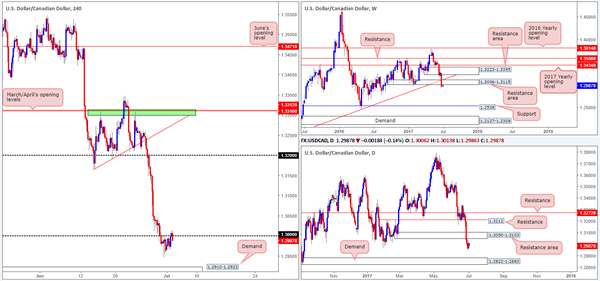
Kicking this morning's report off with a quick look at the weekly timeframe shows that the bears are beginning to make an appearance from the supply zone marked at 1.3120-1.2957. Providing that the bears can hold firm here, the next line in the firing range will be the support level pegged at 1.2789. Turning our attention to the daily timeframe, the pair is also seen interacting with a supply zone at 1.3058-1.2979, which is essentially a partner supply to the aforementioned weekly area. Should this bearish momentum continue to be seen here on the daily chart, it is likely that we'll see price shake hands with a support area coming in at 1.2818-1.2752, which happens to house the weekly support level mentioned above at 1.2789.
Over on the H4 candles, the unit is seen lurking just ahead of May's opening level at 1.2927, shadowed closely by the 1.29 handle. Given this, neither a long nor short seems attractive at the moment. Both the weekly and daily timeframes suggest selling to be the preferred approach, while H4 structure shows multiple supports hovering below current price. The path would, as far as we can see, only be clear once June's opening level at 1.2869 is cleared, and even then we're not left with much wiggle room until we reach the top edge of the aforementioned daily support area at 1.2818.
Our suggestions: Based on current structure, our team has decided to humbly step aside today.
Data points to consider: UK Construction PMI at 9.30am GMT+1. US banks closed in observance of Independence Day.
Levels to watch/live orders:
- Buys: Flat (stop loss: N/A).
- Sells: Flat (stop loss: N/A).
AUD/USD
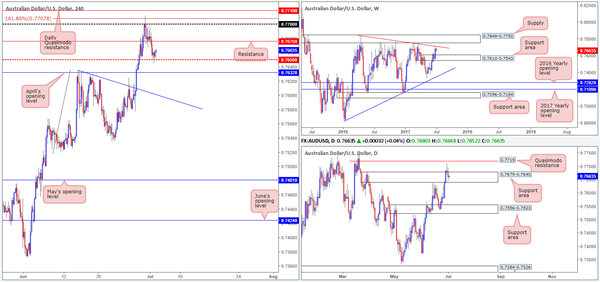
During the course of Monday's segment, the H4 candles breached support at 0.7676 and headed for the mid-level support at 0.7650. This number, as you can see, managed to stabilize price into the closing bell. According to the weekly timeframe, where recently a trendline resistance extended from the high 0.7835 was brought into view, we could see price action slip lower and eventually touch gloves with a support area formed at 0.7610-0.7543. On the other side of the spectrum, however, daily price is seen located within a support area coming in at 0.7679-0.7640. While it is not wise to overlook this zone, things do not look too promising at the moment. The next area of interest beyond here can be seen at 0.7556-0.7523: another support area that's positioned within the noted weekly support zone.
Our suggestions: In a similar fashion to Monday's report, this remains a somewhat difficult market to trade at the moment. Although the weekly timeframe suggests that selling could be the way forward, both the H4 and daily charts suggest otherwise! Therefore, we believe opting to stand on the sidelines may be the better position to take today.
Data points to consider: Australian Retail sales figures at 2.30am, RBA Rate statement at 5.30am GMT+1. US banks closed in observance of Independence Day.
Levels to watch/live orders:
- Buys: Flat (stop loss: N/A).
- Sells: Flat (stop loss: N/A).
USD/JPY
The buyers managed to find their feet early on in the day yesterday. Multiple H4 tech resistances were wiped out, with price only showing signs of stabilization as the unit approached the H4 mid-level resistance at 113.50. Bolstering this number, there's a daily trendline resistance taken from the high 115.50. But is this enough to halt further buying today? The reason for asking this is due to weekly price showing room to advance up to supply coming in at 115.50-113.85 in the shape of a potential AB=CD correction (see pink arrows).
Our suggestions: While a sell from 113.50 looks appealing, we would not feel comfortable trading against potential weekly flow. With that being the case, we will not be selling from 113.50, or the H4 resistance seen planted above it at 113.74. Instead will be looking for price to extend its gains today and hopefully connect with the aforementioned weekly supply zone, before considering a sell.
Data points to consider: No high-impacting events on the docket today. US banks closed in observance of Independence Day.
Levels to watch/live orders:
- Buys: Flat (stop loss: N/A).
- Sells: Flat (stop loss: N/A).
USD/CAD
Trade update: The short position taken from 1.2972 was recently stopped out at 1.3005.
In recent trading, we've seen the H4 candles punch back above the 1.30 region and tap a high of 1.3013. This move has very likely triggered a truckload of stop-loss orders, including ours! However, all may not be lost here! The current H4 candle is looking incredibly bearish right now. Should this candle close at, or very near, its lows, this would be a strong signal to indicate a selloff may be on the horizon. Why we feel so strongly regarding shorting this market comes down to seeing both the weekly and daily charts showing room for the loonie to continue pressing lower, at least until we reach daily demand based at 1.2822-1.2883.
Our suggestions: With stops taken from above 1.30, and the higher-timeframe picture showing space to move lower as well as a possible H4 full-bodied bearish candle that closes below 1.30, this is something we would look to sell. The first take-profit target would be a H4 demand base seen at 1.2910-1.2923. A break beyond here, however, would push us to look at the top edge of the daily demand at 1.2883.
Data points to consider: No high-impacting events on the docket today. US banks closed in observance of Independence Day.
Levels to watch/live orders:
- Buys: Flat (Stop loss: N/A).
- Sells: Should the current H4 candle close bearishly, then a short from here is valid (stop loss: 1.3015).
USD/CHF
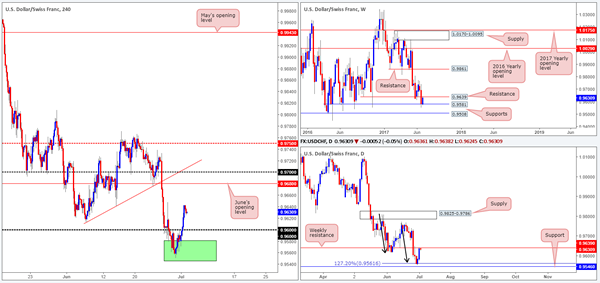
For those who have been following recent reports you may recall that our team is long from 0.9567. Our reasoning behind the position came down to the higher-timeframe picture. The green area shown on the H4 chart is comprised of a weekly support level at 0.9581 and a daily support level pegged at 0.9546. Initially, we had our stop beneath the green zone at 0.9544, but seeing as how the Swissy took off north yesterday, our stop is now resting at breakeven. In addition to this, we have also removed 70% of the position off the able once price struck weekly resistance at 0.9639. We're going to hold the remaining 30% in the market since if the weekly resistance level is taken out; we feel June's opening level at 0.9680 will be next in the firing range.
Our suggestions: Apart from our current trade, we do not see a lot to hang our hat on. Yes, one could look to sell from the current weekly resistance level, since the underlying trend in this market is pointing south. For us personally, we will hold fire and see if the bulls have any drive left after coming into contact with the weekly level.
Data points to consider: No high-impacting events on the docket today. US banks closed in observance of Independence Day.
Levels to watch/live orders:
- Buys: 0.9567 ([live] stop loss: breakeven).
- Sells: Flat (stop loss: N/A).
DOW 30
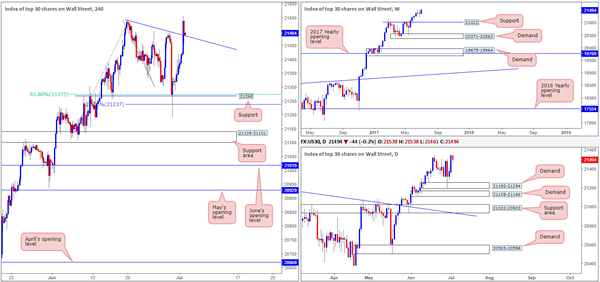
US equities, as you can see, continued to climb higher on Monday, eventually challenging and taking out a H4 trendline resistance extended from the high 21541. In Friday's report, we mentioned that our desk took a long trade at 21323, following the large H4 bull candle that formed off the H4 support level marked at 21268. What attracted us to this point was that the H4 level converged with a H4 61.8% Fib support level at 21275 taken from the low 21108 as well as a H4 127.2% Fib ext. point 21237 drawn from the high 21541 and also because of the daily demand at 21192-21254.
Our stop-loss order has now been moved to breakeven and 50% of our position was taken off the table once price connected with the said H4 trendline resistance. We have left the remaining 50% in the market to run as we believe that this index has the potential to punch much higher yet!
Our suggestions: Given our current long position, our desk is watching for the H4 trendline to now hold as support. This could, given that the weekly, daily and H4 charts show absolutely no overhead resistance, also be a reasonable level to look for possible long opportunities. Personally, we're happy as we are. Should price break into fresh highs today, however, we've noted that we are going to move our stop-loss order up to the 21400 neighborhood.
Data points to consider: No high-impacting events on the docket today. US banks closed in observance of Independence Day.
Levels to watch/live orders
- Buys: 21323 ([live] stop loss: breakeven).
- Sells: Flat (stop loss: N/A).
GOLD
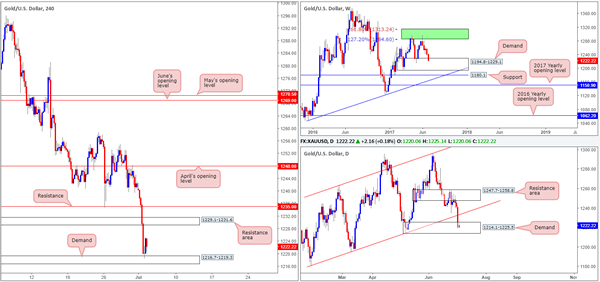
With the US dollar recently seen advancing higher, it was no surprise to see the price of the yellow metal decline in value. On the weekly timeframe, this has brought the unit down into the jaws of a demand base coming in at 1194.8-1229.1. Looking down to the daily timeframe, the recent move south enabled this market to break through the channel support taken from the low 1180.4, and trade deep into a demand area formed at 1214.1-1225.5.
Over on the H4 timeframe, we can also see that the price of gold stabilized around a demand area seen at 1216.7-1219.3. This area is positioned within both the weekly and daily demands mentioned above, and therefore could hold prices higher today and eventually send the metal north to retest 1229.1-1231.6 as resistance.
Our suggestions: While we are interested in buying this market, we would be hesitant at current prices. Ideally, should we see H4 price retest the said H4 demand zone today and print a reasonably sized H4 bull candle, preferably a full-bodied candle, we would have no hesitation in buying this market and targeting 1229.1-1231.6 as an initial take-profit zone.
Levels to watch/live orders:
- Buys: 1216.7-1219.3 ([waiting for a reasonably sized H4 bull candle – preferably a full-bodied candle – to form before pulling the trigger is advised if you want to help avoid a potential fakeout] stop loss: ideally beyond the candle's tail).
- Sells: Flat (stop loss: N/A).
Long-Term Pennant Ready To Slap The USDJPY Lower This Week
Key Points:
- Despite the recent uptrend, the pair looks ready to retreat.
- The long-term pennant should remain in place.
- Losses could extend to the 110.17 handle.
The Dollar-Yen has been advancing rather consistently over the past few weeks, largely ignoring the notable selling pressure besetting the greenback. Due to this, it's little wonder that when the pair surged around 1.15% higher yesterday, hopes of challenging May's high once again began to circle. Unfortunately for the bulls, the technical bias may not be as rosy as it at first appears and the bears could be about to stage a comeback.
As shown below, on the face of it, the USDJPY does indeed look rather bullish and could very well be poised to push higher in the coming days. For one thing, the EMA bias is highly bullish and the Parabolic SAR is certainly indicating that an uptrend is underway. Nevertheless, these two readings could be somewhat misleading. Upon digging a little deeper, it becomes clear that whilst it is currently below price action, the Parabolic SAR could quite easily invert if yesterday's gains are reversed. If this was to occur, the overall bias would shift to bearish rather rapidly – potentially sparking a rout.
Of course, this medium-term shift in trend hinges on a sharp near-term reversal. Luckily, just such a slip is looking rather likely given the USDJPY's proximity to the robust long-term declining trend line that constitutes the upside constraint of the broader pennant structure. This trend line has proven to be an excellent source of resistance over the past months and we expect that it should encourage a reversal yet again. This expectation is only reinforced by the fact that stochastics are well and truly overbought and in sore need of being relieved.
Once the bears are back in control, losses are expected to extend to around the 110.17 handle. At this price, the presence of the 78.6% Fibonacci level and the downside of the pennant should supply ample support and encourage the pair to moderate or even reverse. However, given the extent to which price action has narrowed, it is now withinthe realm of possibility that a breakout could be seen. Due to this, we may have to take a closer look at the pair nearer to the time to establish whether the USDJPY has another reversal left in it.
Overall, keep an eye on the pair as we could certainly have a bumpy few weeks on our hands. Moreover, don't neglect the fundamental side of things as data releases could generate some sizable intra-day volatility for the Dollar-Yen.
European Open Briefing: The US Dollar Consolidated Regained Some Strength After Solid US Economic Data Releases
Global Markets:
- Asian stock markets: Nikkei up 0.40 %, Shanghai Composite fell 0.40 %, Hang Seng rose 0.05 %, ASX 200 rallied 1.70 %
- Commodities: Gold at $1223 (+0.30 %), Silver at $16.03 (-0.35 %), WTI Oil at $46.80 (-0.55 %), Brent Oil at $49.40 (-0.60 %)
- Rates: US 10-year yield at 0.48, UK 10-year yield at 1.26, German 10-year yield at 0.48
News & Data
- Australia Retail Sales 0.6 % vs 0.2 % expected
- Australia ANZ Roy Morgan Weekly Consumer Confidence Index Jul 114.5 (prev 111.8)
- South Korea CPI (M/M) Jun: -0.20% (prev 0.10%; est -0.10%)
- Japan Monetary Base 17.0 % vs 19.2 % expected
- New Zealand NZIER Business Confidence 18 % vs 17 % previous
- Asian shares track U.S., European gains, dollar hovers near seven-week high – RTRS
- Oil rises more than 2 percent as U.S. crude output slows – RTRS
Markets Update:
The US Dollar consolidated regained some strength after solid US economic data releases. EUR/USD fell to 1.1355 in Asia. After the break below 1.1370, the next major support level is now seen at 1.1320. The outlook remains positive, and buying interest is likely to remain high on larger dips.
GBP/USD was rejected at 1.3020 resistance on Monday and retraced to 1.2930. Key support is seen at 1.2920. A break below would signal that the pair is likely to retest 1.2850 support soon.
USD/JPY rallied yesterday amid broad USD strength and rising stock markets. The pair reached 113.40 overnight and there is little resistance until 114.40 now. Support is noted at 113 and 112.60.
The Australian Dollar rose after better than expected Retail Sales data. However, the pair quickly retraced the rally and settled around 0.7660/70 for the rest of the trading session.
WTI is back above $47 and the outlook for Oil has turned positive. This could keep USD/CAD under pressure. Following the break below 1.2970 support, the next major support level now lies at 1.28.
Upcoming Events:
- 09:30 BST – UK Construction PMI
- 13:30 BST – ECB Member Praet speaks
RBA Leaves Key Interest Rate Unchanged At 1.5%
For the 24 hours to 23:00 GMT, the AUD declined 0.3% against the USD and closed at 0.7661.
LME Copper prices declined 0.2% or $13.5/MT to $5894.0/MT. Aluminium prices rose 0.5% or $9.0/MT to $1917.5/MT.
In the Asian session, at GMT0300, the pair is trading at 0.7665, with the AUD trading a tad higher against the USD from yesterday’s close.
Earlier today, the Reserve Bank of Australia (RBA), at its latest monetary policy meeting, opted to leave the key interest rate steady at 1.5%, meeting market expectations.
The pair is expected to find support at 0.7644, and a fall through could take it to the next support level of 0.7624. The pair is expected to find its first resistance at 0.7686, and a rise through could take it to the next resistance level of 0.7708.
Moving ahead, market participants will await the release of Australia’s AiG performance of services index for June, scheduled to release overnight.
The currency pair is trading between its 20 Hr and 50 Hr moving averages.

Manufacturing Sector Growth Across The Euro-Zone Hit A 74-Month High In June
For the 24 hours to 23:00 GMT, the EUR declined 0.45% against the USD and closed at 1.1368.
On the data front, the Euro-zone's final Markit manufacturing PMI was revised higher to a level of 57.4 in June, expanding at its fastest pace in more than six years and compared to a level of 57.3 recorded in the flash estimate. In the prior month, the PMI had registered a level of 57.0. Additionally, the region's unemployment rate remained steady at 9.3% in May, at par with market expectations and maintaining its lowest level since March 2009.
Separately, activity in Germany's manufacturing sector unexpectedly advanced to a level of 59.6 in June, accelerating at its fastest pace in more than six years, while the preliminary print had indicated a fall to a level of 59.3. In the previous month, the PMI had registered a reading of 59.5.
The greenback strengthened against its key peers, after data showed that the US ISM manufacturing activity index jumped more-than-expected to a level of 57.8 in June, surging to its highest level in three years, thus indicating that the sector is on course for stronger growth in the second half of the year. Market participants expected the PMI to rise to a level of 55.2, after recording a reading of 54.9 in the prior month.
Meanwhile, the nation's construction spending remained flat on a monthly basis in May, compared to a revised drop of 0.7% in the prior month, while investors were expecting construction spending to advance 0.3%. On the contrary, the nation's final Markit manufacturing PMI fell more than initially estimated in June, after it declined to a level of 52.0, compared to a drop to a level of 52.1 registered in the flash estimate. In the prior month, the PMI had recorded a level of 52.7.
In the Asian session, at GMT0300, the pair is trading at 1.1366, with the EUR trading slightly lower against the USD from yesterday's close.
The pair is expected to find support at 1.1341, and a fall through could take it to the next support level of 1.1316. The pair is expected to find its first resistance at 1.1405, and a rise through could take it to the next resistance level of 1.1444.
Going ahead, investors will look forward to the Euro-zone's producer price index for May, slated to release in a few hours.
The currency pair is showing convergence with its 20 Hr moving average and trading below its 50 Hr moving average.

UK’s Manufacturing Sector Growth Eased To A 3-Month Low In June
For the 24 hours to 23:00 GMT, the GBP declined 0.48% against the USD and closed at 1.2943, after UK's manufacturing sector showed a poor performance in June.
Data showed that Britain's Markit manufacturing PMI unexpectedly eased to a level of 54.3 in June, marking its slowest pace of expansion in three months, adding further evidence of a slowing economy that is expected to face renewed downside pressure in the wake of political uncertainties. The PMI had registered a revised reading of 56.3 in the prior month, while investors had envisaged it to remain steady.
In the Asian session, at GMT0300, the pair is trading at 1.2937, with the GBP trading marginally lower against the USD from yesterday's close.
The pair is expected to find support at 1.2905, and a fall through could take it to the next support level of 1.2873. The pair is expected to find its first resistance at 1.2996, and a rise through could take it to the next resistance level of 1.3055.
Looking forward, Britain's Markit construction PMI for June, scheduled to release in a few hours, will be on investors' radar.
The currency pair is trading below its 20 Hr and 50 Hr moving averages.

Japan’s Consumer Confidence Unexpectedly Deteriorated In June
For the 24 hours to 23:00 GMT, the USD rose 0.89% against the JPY and closed at 113.37.
In economic news, Japan's consumer confidence index unexpectedly dropped to a level of 43.3 in June, defying market consensus for the index to advance to a level of 43.9 and compared to a reading of 43.6 in the previous month.
In the Asian session, at GMT0300, the pair is trading at 113.25, with the USD trading 0.11% lower against the JPY from yesterday's close.
Overnight data showed that the nation's monetary base climbed less-than-anticipated by 17.0% YoY in June, compared to a gain of 19.4% in the previous month.
The pair is expected to find support at 112.57, and a fall through could take it to the next support level of 111.89. The pair is expected to find its first resistance at 113.70, and a rise through could take it to the next resistance level of 114.15.
Looking ahead, investors will keep a close watch on Japan's final Nikkei services PMI for June, due to release overnight.
The currency pair is showing convergence with its 20 Hr moving average and trading above its 50 Hr moving average.
