Sample Category Title
USD/CAD Daily Outlook
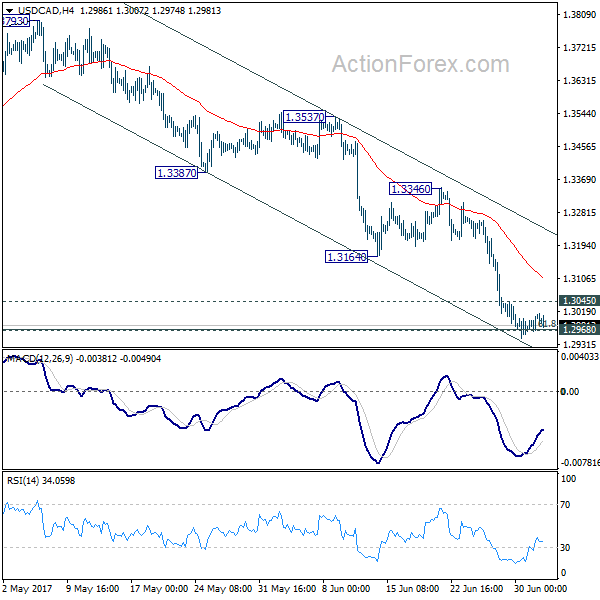
Daily Pivots: (S1) 1.2976; (P) 1.2994; (R1) 1.3023; More....
No change in USD/CAD's outlook as it's gyrating in tight range around 1.3 cluster support. With 1.3045 minor resistance intact, further decline is expected. Sustained trading below 1.2968 cluster support, 61.8% retracement of 1.2460 to 1.3793 at 1.2969 will pave the way to retesting 1.2460 low. On the upside, above 1.3045 will indicate short term bottoming, possibly on bullish convergence condition in 4 hour MACD. In such case, stronger rebound would be seen back to 1.3164/3346 resistance zone first, before staying another decline.
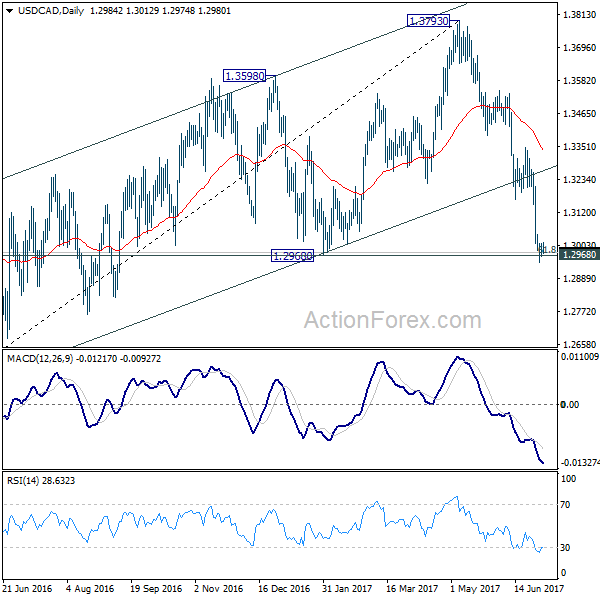
In the bigger picture, price actions from 1.4689 medium term top are seen as a correction pattern. The second leg should have finished at 1.3793. Break of 1.2460 will tend such correction to 50% retracement of 0.9406 to 1.4869 at 1.2048. At this point, we'd look for strong support from there to contain downside and bring rebound. However, firm break there will target 100% projection of 1.4689 to 1.2460 from 1.3793 at 1.1564.
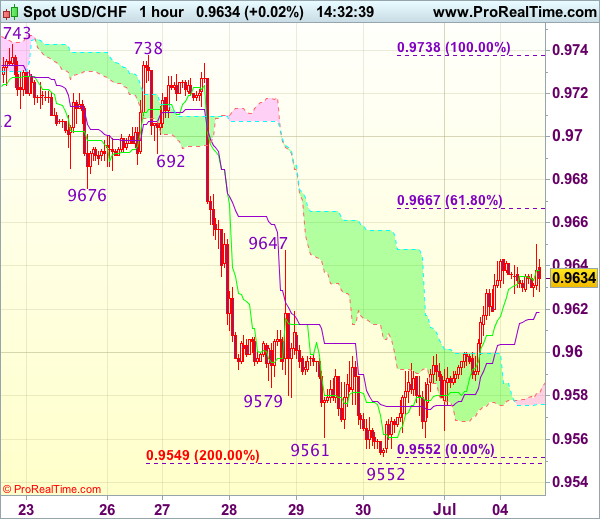
Trade Idea : USD/CHF – Buy at 0.9590
USD/CHF - 0.9625
Most recent candlesticks pattern : N/A
Trend : Near term down
Tenkan-Sen level : 0.9636
Kijun-Sen level : 0.9619
Ichimoku cloud top : 0.9584
Ichimoku cloud bottom : 0.9576
Original strategy :
Buy at 0.9600, Target: 0.9700, Stop: 0.9565
Position : -
Target : -
Stop : -
New strategy :
Buy at 0.9590, Target: 0.9690, Stop: 0.9555
Position : -
Target : -
Stop : -
As the greenback staged a strong rebound after finding good support at 0.9552, suggesting a temporary low has been formed there and consolidation with mild upside bias is seen for this move to bring retracement of recent decline, hence gain to 0.9667-76 (61.8% Fibonacci retracement of 0.9738-0.9552 and previous support turned resistance) is likely, however, reckon upside would be limited to 0.9700 and price should falter below resistance at 0.9738.
In view of this, we are looking to turn long on pullback as the upper Kumo (now at 0.9584) should limit downside and bring another rise later. Below the lower Kumo (now at 0.9576) would abort and signal intra-day top is formed, risk retest of 0.9552 first.
US Dollar Attempts To Make A Comeback On Manufacturing PMI
The US dollar index was seen trading stronger on Monday after data from the Institute of Supply Management (ISM) showed that manufacturing activity rose to 57.8 in the month of June. The ISM's reading marked the highest level in the index since August 2014 and reversed the declining trend over the past few months.
As a result, the euro and the British pound continued to weaken, while the Japanese yen fell against the US dollar. While the ISM manufacturing activity increased, Markit's measure of manufacturing activity in the US slipped to 55.0, missing estimates of 58.5 and declined from 60.5 posted the month before.
Looking ahead, the US markets are closed today on account of the US Independence Day holiday. Data from the US is, therefore, limited for today. Traders are likely to shift focus to the RBA's meeting followed by UK's construction PMI data.
EURUSD intraday analysis
EURUSD (1.1371): The EURUSD extended the declines for a second consecutive day, giving up the gains above $1.1400. Price action is now seen testing the support level at 1.1357. Lack of any clear fundamentals today and slow trading is likely to keep the EURUSD trading flat. With the support level seen holding currently, EURUSD could be attempting to post another high off the bounce from 1.1357 support. A lower high could signal that the currency pair could be potentially breaking below the support at 1.1357 with the next level at 1.1300 coming into focus. To the upside, a continuation is required with further gains coming only on a convincing close above the previous high that was formed at 1.1445.
GBPUSD intraday analysis
GBPUSD (1.2942): The British pound was weaker yesterday following the disappointing manufacturing PMI data. Price action posted a reversal near the 1.2975 - 1.3000 resistance zone. Further declines could be seen coming with GBPUSD likely to fall back to the support level at 1.2800. On the 4-hour chart, any near-term bounce could see the 1.2975 price level being tested for resistance. This could confirm the downside towards 1.2800. Failure to limit the gains near 1.2975 could signal a continuation to the upside.
USDJPY intraday analysis
USDJPY (113.23): USDJPY posted strong gains yesterday, and price action managed to clear the 112.00 resistance level. The rally to 113.36 marks the completion of the bullish flag pattern. We could now expect to see some consolidation take place unless USDJPY can clear the 113.36 level which is currently acting as resistance. There is a risk of the downside in prices as the support level at 110.70 is likely to be tested in the medium term. Watch for the initial support at 112.00 which could be in focus immediately. Failure to contain the declines here could push USDJPY lower to 110.78.
Market Update – Asian Session: RBA Leaves Rate And Policy Stance Unchanged
Asia Summary
Markets were mixed in the session. North Korea launched a ballistic missile, which was said to have traveled for forty minutes before landing in the sea in Japan’s EEZ. South Korea vowed to sternly respond to the provocation. US President Trump tweeted he hoped that China would take care of North Korea. The USD/KRW stayed little changed, while the USD/JPY fell 0.3% to 113.09.
AUD/USD climbed into the target rate decision but then fell to session lows of 0.7621 after RBA left target rate unchanged at 1.5% and reiterated its policy stance from prior meetings. RBA commented it sees some signs that housing conditions are starting to ease and inflation will increase gradually.
China and Hong Kong markets traded lower, the PBOC skipped OMO for the 8th consecutive day and the yuan mid-point was set at its weakest level in 2-weeks. In an SCMP piece, said that the PBOC is likely to succumb to Fed tightening. Japan auto maker US sales were all higher y/y, while Kia/Hyundai reported weak figures in China vehicle sales.
Reminder US markets are closed for the July 4th holiday.
Key economic data
(AU) RESERVE BANK OF AUSTRALIA (RBA) LEAVES CASH RATE TARGET UNCHANGED AT 1.50% (AS EXPECTED)
(AU) AUSTRALIA MAY RETAIL SALES M/M: 0.6% V 0.2%E
(NZ) NEW ZEALAND Q2 NZIER BUSINESS CONFIDENCE: 18% V 17% PRIOR
(KR) SOUTH KOREA JUN CPI M/M: -0.1% V -0.1%E; Y/Y: 1.9% V 2.0%E; CPI CORE Y/Y: 1.4% V 1.5%E
(AU) Australia ANZ Roy Morgan Weekly Consumer Confidence Index: 114.5 v 111.8 prior
(JP) JAPAN JUN MONETARY BASE Y/Y: 17.0% V 19.2%E; MONETARY BASE END OF PERIOD: ¥468.0T V ¥455.9T PRIOR
(KR) South Korea Q2 Foreign Direct Investment (FDI) y/y: -9.0% v -9.2% prior
Speakers and Press
China
(CN) PBOC Deputy Gov Gonsheng : China looking at allowing foreign agencies to assign credit ratings on onshore bonds – SCMP
(CN) China's 2017 GDP growth may be higher than 2016 - Chinese Press
Japan
(JP) PM Abe expected to continue to pursue plan to revise Japan's constitution - Japanese Press
(JP) Bank of Japan (BoJ) Survey: Japan companies expect 1-year inflation at 0.8% y/y
(JP) Japan Fin Min Aso: Will discuss problems facing global economy at G20
Korea
(KR) Bank of Korea (BOK) Gov Lee: Central bank govs at the recent BIS meeting agreed that while monetary policies in developed countries are headed for a change, financial market instability seen during 2013 taper tantrum is unlikely to be repeated
(KR) North Korea has launched ballistic missile, around 09:40AM, said to have traveled 40 minutes - Korean press
(KR) US President Trump: North Korea has just launched another missile. Does this guy have anything better to do with his life? Hard to believe that South Korea and Japan will put up with this much longer. Perhaps China will put a heavy move on North Korea and end this nonsense once and for all! - tweet
Asian Equity Indices/Futures (00:30ET)
Nikkei +0.2%, Hang Seng -0.7%, Shanghai Composite -0.5%, ASX200 +1.7%, Kospi -0.2%
Equity Futures: S&P500 +0.0%; Nasdaq -0.1%, Dax +0.1%, FTSE100 +0.1%
FX ranges/Commodities/Fixed Income (00:30ET)
EUR 1.1377-1.1363; JPY 113.41-113.13; AUD 0.7682-0.7654; NZD 0.7296-0.7263
Aug Gold +0.3% at 1,223/oz; Aug Crude Oil -0.5% at $46.84/brl; Sept Copper -0.4% at $2.67/lb
(CN) PBOC skips open market operations (8th straight skip)
(CN) PBOC SETS YUAN MID POINT AT 6.7889 V 6.7772 PRIOR (weakest setting in 2-weeks)
(KR) South Korea sells 30-yr bonds at 2.365%
USD/CNY Commerzbank analyst: PBOC may allow controllable yuan drop; could see yuan at 7.1 by the end of 2017
(TH) Thailand sells combined THB60B in 3-month and 6-month bonds
USD/CNY China State owned banks seen selling dollars at CNY6.80 in onshore forex market - financial press
JGB (JP) Japan MoF sells ¥1.86T in 10-yr 0.1% bonds; Avg yield 0.079%; bid-to-cover 4.77x v 3.64x prior (highest since February 2005)
Asia equities notable movers
Australia
Emeco Holdings, EHL.AU Morgans Financial Ltd Initiates EHL.AU with Add, price target: A$0.15, +11.4%
88 Energy, 88E.AU Provides project update on Project Icewine, -7.7%
Japan
Idemitsu Kosan, 5019.JP Planning ¥140B, 49M share sale (30% of shares outstanding), against the founders wishes; -11.2%
Show Shell, 5002.JP Idemitsu has no plans to call a shareholders' meeting to vote on a merger with rival Showa Shell Sekiyu after the issuance of new shares, which would dilute the stake held by the refiner's founding family; +6.7%
Hong Kong/China
PetroChina, 857.HK Announcement regarding the approval of the proposed Issuance of exchangeable Corporate Bonds by the Controlling Shareholder, +4.8%
Sinolink Securities ,600109.CN Tsinghua Holdings plans to cut stake by up to 5% within 6 months, -4.8%
US Session Highlights
US markets closed early ahead of the 4th of July holiday
Trump set to use US LNG as a political tool when he meets leaders from a group of a dozen countries. He is to tell the group, known as the “Three Seas” summit, that Washington wants to make it easier for US gas to reach these nations; which are often held to ransom by their dependence on Russia.
ISM Manufacturing Index rose to an unexpected 57.8 last month, for its best reading since August 2014. The components contributing the most were New Orders, showing a very strong 63.5, and Production also high at 62.4.
Contrasting positive manufacturing data, major US Automakers reported a decline in sales for June, for a fourth consecutive monthly decline. GM said it expected June sales to show 16.6 million units, down 1% from the same period last year.
Treasury yield curve continues to flatten as yields rise across the curve. 10-year yield up 5bps to 2.35%, and 30-year yield up at 2.87%. The 10s/30s yield curve flattening further to 52bps.
US markets on close: Dow +0.7%, S&P500 +0.9%, Nasdaq +1.4%
Best Sector in S&P500: Energy
Worst Sector in S&P500: IT
Biggest gainers: RIG +5.4%; CF +4.5%; GPS +4.2%; MOS +4.1%
Biggest losers: WDC -3.7%; NVDA -3.6%; SYMC -2.8%; AMD -2.6%
At the close: VIX 11.22 (+0.4%); Treasuries: 2-yr 1.41% (+2.0%), 10-yr 2.35% (+2.0%), 30-yr 2.86% (+0.9%)
Notable US Equities
TSLA Reports Q2 deliveries just over 22.0K v 24.2Ke v just over 25.0K q/q; Provided global economic conditions do not worsen considerably, company is confident that combined deliveries of Model S and Model X in H2 of 2017 will likely exceed deliveries in H1 of 2017.
Currencies: Risk-Off To Set The Tone For FX Trading?
Sunrise Market Commentary
- Rates: Geopolitical tensions to give bonds some respite?
Strong US ISM aborted a sluggish corrective upturn during the US session with US Treasuries now underperforming Bunds. Geopolitical tensions may give Bunds some upside, but this might be temporary. Mind the technical pictures: red alert in the Bund and code orange for US Treasuries. Sell-on upticks preferred. - Currencies: Risk-off to set the tone for FX trading?
Yesterday, the dollar rebounded as investors anticipated good US eco data. Today, US markets are closed. Geopolitical tensions triggered a risk-off correction in Asia. Such a correction might cap the USD/JPY rebound. The impact on EUR/USD is less straightforward. A correction in EUR/JPY might weigh also weigh on EUR/USD.
The Sunrise Headlines
- US equities closed with modest gains for the S&P 500 with NASDAQ again underperforming (-0.49%) on tech declines. Initially, Asian markets followed but sentiment turned as Asian stocks dropped on political tensions and losses in technology shares.
- President Jinping complained about a 'negative' turn in China's relationship with the US after several assertive US moves in Asia. Tensions are heating up in Asia as North Korea again fired a ballistic missile into the Sea Of Japan.
- The Reserve Bank of Australia is leaving its benchmark interest rate unchanged at 1.5%. There was little change in the RBA statement compared to previous months despite a general move of other central banks to more hawkish stances.
- The US manufacturing ISM was better than expected in June with a reading of 57.8 (55.3 consensus and 54.9 in May). Growth in production, employment and new orders indices point to a vibrant pace of activity in manufacturing.
- Multiple Nasdaq-listed stocks, including Amazon, Microsoft and Apple, saw their share price change to exactly $123.47 on multiple platforms. Nasdaq said this was due to 'improper use of test data' sent to third party data providers.
- Bank of Canada governor Poloz expects inflation to be 'well into an uptrend' in 2018 as the output gap in the economy closes. He added that the BoC should not wait to react until inflation hits the target otherwise it could be too late.
- With the 4th of July Holiday in the US, the eco-calendar is thin. The Swedish Riksbank rate decision and ECB's Praet's speech are the only interesting items on the agenda. The wildcard for today is the tension in international politics
Currencies: Risk-Off To Set The Tone For FX Trading?
Risk-off correction to drive FX trading today?
The dollar made a cautious comeback at the start of the week as investors prepared for key US data to be released this week. Interest rate differentials also (re)widened slightly in favour of the US currency. EUR/USD returned below the 1.14 handle. USD/JPY regained the 113 barrier. The EMU eco data were strong, but the euro didn't profit. Later, the US manufacturing ISM printed a strong 57.8, but didn't cause any significant additional USD gains as US markets headed into an early close. EUR/USD finished the session at 1.1364 (from 1.1426). USD/JPY extended its uptrend to close the day at 113.38 (from 112.3).
Overnight, sentiment on Asian equity market deteriorated during the session. Especially Hong Kong stocks are hit hard. A new missile test from North Korea played a role. Tech stocks also remain under pressure. The yen profits slightly from the intraday equity decline. USD/JPY is drifting back to the 113 area. EUR/USD is also losing a few ticks and trades in the 1.1345/50 area (EUR/JPY driven?). The Reserve Bank of Australia left its policy rate unchanged at 1.5%. The RBA maintains a constructive view on the economy but wage growth remains low. The RBA didn't hint at a change in its policy bias, disappointing hawks. AUD/USD dropped from the 0.7680 area to the 0.7620 area.
Today, there are only second tier eco data in Europe and US markets are closed for the 4th of July National Holiday. In such a context, one expects directionless trading in thin markets. This might still be the case, but we keep an eye on equities after the intraday sell-off in Asia. Will the correction in tech stocks spread to other parts of the market. Will political tensions (North Korean, reaction of Trump/discord between the US and China) cause additional volatility going into this weekend's G20 meeting? Of late, politics seldom was a lasting issue for global markets' trading. Even so, we keep an eye on it.
Yesterday, the dollar was well bid as investors anticipated good US eco data this week. However, if sentiment on risk deteriorates, this picture might change. A risk-off correction might cap the recent USD/JPY rebound. Remarkably, EUR/USD declined this morning despite the risk-off sentiment. After the recent EUR/JPY rally, time might be ripe for a correction in this cross-rate. This could cap the upside in EUR/USD. More still, it could weigh on this cross-rate in case of a temporary risk-off.
Technical picture: USD looking for a bottom
A combination of hawkish ECB comments and weaker US eco data pushed EUR/USD last week above the 1.1300/66 resistance area with a new high at 1.1448. The next resistance is now the 1.15 area. Further out LT-correction tops are coming in at 1.1616/1.1714. A break would end the long consolidation period that followed the sharp decline of EUR/USD in 2014/early 2015. Such a key area will be difficult to break for now. A drop below 1.1119 would suggest the pair enters calmer waters.
The USD/JPY rally ran into resistance in early May and the pair returned lower in the 108.13/114.37 range. The post-Fed USD rebound pushed the pair the 112.13 correction top early last week, but follow-through gains were modest. So, the jury is still out. A sustained break would improve the ST-picture. Even so, were remain cautious on further USD/JPY gains
EUR/USD correcting off last week's top.
EUR/GBP
Sterling declines against dollar; stable against euro.
Yesterday, the sterling trading was driven by the price moves in the dollar and the euro. The overall rebound of the dollar pushed cable back below the 1.30 barrier. There was also a small fall-out from the EUR/USD decline on EUR/GBP. The UK manufacturing PMI unexpectedly declined to 54.3 from 56.3. Sterling lost only modest ground after the release. EUR/GBP closed session at 0.8882 (from 0.8771). Cable finished the day at 1.2940.
Today, the UK construction PMI is expected decline slightly from 56.0 to 55.0. We see slight downside risks. The reaction of sterling to the release is likely limited. The Brexit negotiations are on ongoing issue. A risk-off sentiment, if it would occur, most often is a slightly negative for sterling. Short-term, we see EUR/GBP staying below the key resistance of 0.8866/80 as markets still digest the recent decline of sterling/rise of EUR/GBP. Cable's fate will depend on EUR/USD.
From a technical point of view, EUR/GBP set a minor top north of the 0.8854/66 resistance (2017 top). A sustained break didn't occur, causing a correction on the recent EUR/GBP rebound. A return below the 0.8655 correction low would indicate easing pressure on sterling. Such a break lower will be difficult. A EUR/GBP buy-on-dips approach remains favoured
EUR/GBP topside test rejected. A modes/temporary sterling comeback might be on the cards
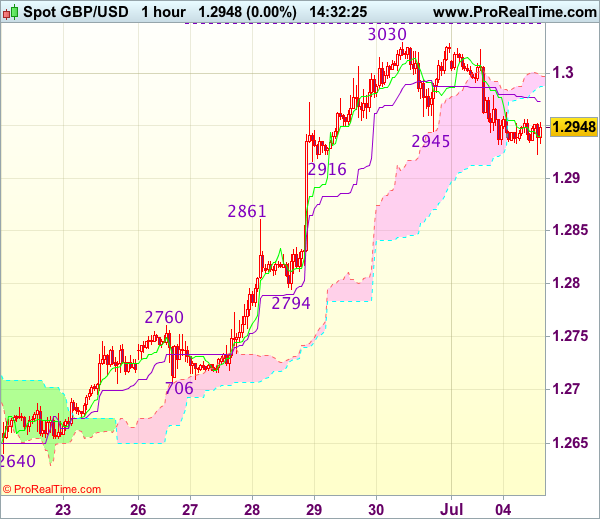
Trade Idea : GBP/USD – Buy at 1.2865
GBP/USD - 1.2954
Most recent candlesticks pattern : N/A
Trend : Near term up
Tenkan-Sen level : 1.2940
Kijun-Sen level : 1.2973
Ichimoku cloud top : 1.2998
Ichimoku cloud bottom : 1.2988
Original strategy :
Buy at 1.2865, Target: 1.3000, Stop: 1.2830
Position : -
Target : -
Stop : -
New strategy :
Buy at 1.2865, Target: 1.3000, Stop: 1.2830
Position : -
Target : -
Stop : -
Cable’s retreat after faltering below last week’s high of 1.3030 suggests consolidation below this level would be seen, hence weakness to 1.2916 support cannot be ruled out, however, reckon downside would be limited to 1.2865-70 and bring another upmove later, above said resistance at 1.3030 would signal recent upmove is still in progress and may extend further gain towards recent high 1.3048 but loss of near term upward momentum should prevent sharp move beyond 1.3075-80 today and reckon 1.3100 would hold on first testing.
In view of this, would not chase this rise here and we are looking to buy cable again on pullback as 1.2900 should limit downside and bring another rally. Below previous resistance at 1.2861 would suggest a temporary top is formed instead, risk weakness to 1.2830-35 (50% Fibonacci retracement of 1.2640-1.3030) but support at 1.2794 should remain intact.
Gold Under Pressure As Equities & Yields Rally
Equity investors have entered the third quarter with an optimistic attitude. Despite the low trading volumes and shortened U.S. trading session, stocks across Europe and the U.S. posted considerable gains sending the Dow Jones Industrial Average to a new record high, with the financial and energy sectors taking the lead. Data released on Monday supported the appetite for risk as factories in the Eurozone and the U.S. surprised by being on the upside. The U.S. Manufacturing Index rose to 57.8 from 54.9 in May, its strongest expansion since August 2014. Similarly, the IHS Markit Manufacturing PMI for the Eurozone rose to 57.4, its highest figure since April 2011.
The positive data sent the yields on U.S. 10-year Treasury bonds to their highest levels since mid-May. On the shorter end, 2-year Treasury Notes that are mainly influenced by monetary policy actions rose to their highest levels since June 2009, during the global financial crisis. This move convinced the dollar bulls to return after investors dumped the U.S. currency for four consecutive months. Whether the spike in the U.S. dollar is meant to continue or whether it is just a dead cat bounce depends on how fast other central banks across advanced economies converge into normalization. In the shorter run however, Wednesday's FOMC's minutes and Friday's jobs report will be the prime catalysts. Currency markets are trading in a very narrow range early Tuesday and I expect traders to remain on the sidelines until the U.S. returns from its Independence Day holiday on Wednesday.
Gold was the biggest story yesterday. The yellow metal has lost its shine, posting its biggest one-day fall in almost eight months. The dollar's strength may have contributed to the selling pressures but I think it was only a minor factor. Many investors believe that the bull bond market has come to an end, as central bankers signaled borrowing costs are going up, which going forward will be the major factor impacting precious metals. Breaking below the 200-day Moving Average also attracted bears to drag prices lower, with immediate support now seen at $1,213.80 (May's low). However, if Beijing-Washington tensions continue to escalate after the U.S. made a $1.4 billion arms deal with Taiwan and also sent a navy missile destroyer close to Triton Island in the South China Sea, investors are very likely to return to gold for protection against political risks. Today's launch of a ballistic missile from North Korea further added to the complication of China-U.S. relations, but it seems markets did not take this as a serious threat. Overall, macroeconomic fundamentals are indicating a lower gold price, while geopolitical risks are keeping the Bulls on standby.
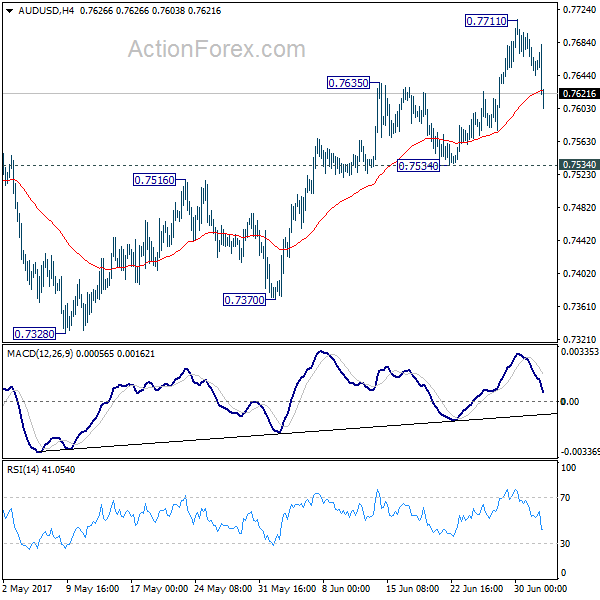
AUD/USD Daily Outlook
Daily Pivots: (S1) 0.7638; (P) 0.7667; (R1) 0.7689; More...
AUD/USD pull back from 0.7711 accelerates to as low as 0.7603 so far. But it's still staying above 0.7534 support and intraday bias remains neutral first. Another rise is in favor as long as 0.7534 support holds. Above 0.7711 will target 0.7748 resistance and above. At this point, there is no clear sign of range breakout yet. Hence, we'd be cautious on topping again as it approaches medium term fibonacci level at 0.7849. On the downside, break of 0.7534 will indicate near term reversal and turn bias back to the downside for 0.7370 support.
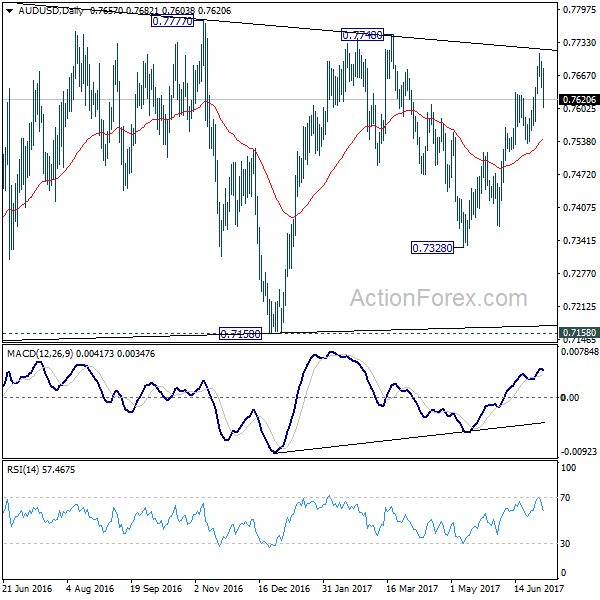
In the bigger picture, we're still treating price actions from 0.6826 low as a corrective pattern. And, as long as 38.2% retracement of 0.9504 to 0.6826 at 0.7849 holds, long term down trend from 1.1079 is expected to resume sooner or later. Break of 0.6826 low will target 0.6008 key support level. However, firm break of 0.7849 will indicate that rise from 0.6826 is developing into a medium term rebound, rather than a sideway pattern. In such case, stronger rise should be seen to 55 month EMA (now at 0.8096) and above.
Yen Rebounds after Another North Korean Missile, Aussie Tumble as RBA Doesn’t Turn Hawkish
Yen rebounds strongly in Asian session today following steep in decline in China and Hong Kong stocks markets. In particular, the HK HSI is trading down -400 pts, or -1.5% at the time of writing, led by tech titan Tencent and casino stocks. Some attributes the selloff to North Korea's firing of another ballistic missile just ahead of July 4. That drew response from US President Donald Trump, with his tweet that "hard to believe that South Korea and Japan will put up with this much longer". And Trump tried to shift the spot to China again saying that "perhaps China will put a heavy move on North Korea and end this nonsense once and for all!" USD/JPY is back below 113 after surging to 113.46 overnight following the stronger than expected ISM manufacturing data.
Speculations of new BoJ head grow
Also from Japan, Prime Minister Shinzo Abe's advisor Esuro Honda said in a telephone interview last week regarding BoJ that "what's important, especially this time, is whether we can undertake regime change". And for the next BoJ Governor, "it should be someone who is refreshing enough and can renew people's impressions with personal charm and sincerity." This is sharp turn from his prior comments that reappointing current BoJ Governor Haruhiko Kuroda after his term ends next April is an option.
Another advisor, former BoJ board member Nobuyuki Nakahara also said earlier this week that BoJ will need "someone who can prepare for" stimulus exit in the next five years. And Kuroda "will fall into inertia and struggle to come up with bold new ideas". There are growing speculations that Kuroda will not be re-appointed.
Also from Japan, monetary base rose 17.0% yoy in June versus expectation of 19.2% yoy.
Aussie tumbles as RBA stays balanced
Aussie tumbles sharply today after RBA left interest rate unchanged at 1.50% as widely expected. The statement is balanced and markets are disappointed that RBA doesn't turn hawkish like some other global central banks. Policymakers expected that Australian economy would "strengthen gradually". However, they remained concerned over the "subdued" consumption growth, suggesting it reflected "slow growth in real wages and high levels of household debt".
Meanwhile, RBA remained cautious over the property market. As noted in the statement, "in the eastern capital cities, a considerable additional supply of apartments is scheduled to come on stream over the next couple of years. Rent increases are the slowest for two decades". RBA added that "growth in housing debt has outpaced the slow growth in household incomes".
More in RBA Disappointed As It Failed To Hint Rate Hike.
Also from Australian, retail sales rose 0.6% mom in May, above expectation of 0.2% mom.
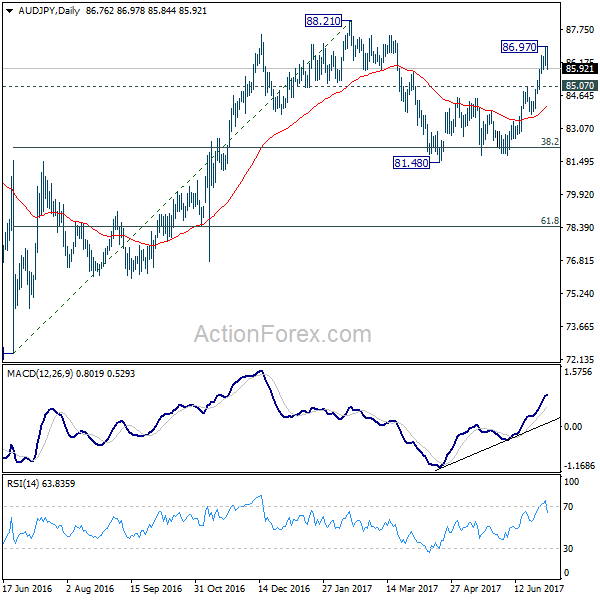
AUD/JPY possibly in near term reversal
AUD/JPY's sharp fall today now raises the chance that rebound from 81.48 is completed at 86.97, ahead of 88.21 resistance. Focus is now back on 85.07 support. Break there will extend the corrective pattern from 88.21 with another falling leg, back to 38.2% retracement of 72.39 to 88.21 at 82.17. In case of another rise, we'd be cautious on topping at 88.21.
Elsewhere...
Economic calendar is light today with July 4 holiday in US. UK construction PMI and Eurozone PPI are the main features.
AUD/USD Daily Outlook
Daily Pivots: (S1) 0.7638; (P) 0.7667; (R1) 0.7689; More...
AUD/USD pull back from 0.7711 accelerates to as low as 0.7603 so far. But it's still staying above 0.7534 support and intraday bias remains neutral first. Another rise is in favor as long as 0.7534 support holds. Above 0.7711 will target 0.7748 resistance and above. At this point, there is no clear sign of range breakout yet. Hence, we'd be cautious on topping again as it approaches medium term fibonacci level at 0.7849. On the downside, break of 0.7534 will indicate near term reversal and turn bias back to the downside for 0.7370 support.
In the bigger picture, we're still treating price actions from 0.6826 low as a corrective pattern. And, as long as 38.2% retracement of 0.9504 to 0.6826 at 0.7849 holds, long term down trend from 1.1079 is expected to resume sooner or later. Break of 0.6826 low will target 0.6008 key support level. However, firm break of 0.7849 will indicate that rise from 0.6826 is developing into a medium term rebound, rather than a sideway pattern. In such case, stronger rise should be seen to 55 month EMA (now at 0.8096) and above.
Economic Indicators Update
| GMT | Ccy | Events | Actual | Forecast | Previous | Revised |
|---|---|---|---|---|---|---|
| 23:50 | JPY | Monetary Base Y/Y Jun | 17.00% | 19.20% | 19.40% | |
| 1:30 | AUD | Retail Sales M/M May | 0.60% | 0.20% | 1.00% | |
| 4:30 | AUD | RBA Rate Decision | 1.50% | 1.50% | 1.50% | |
| 8:30 | GBP | Construction PMI Jun | 55 | 56 | ||
| 9:00 | EUR | Eurozone PPI M/M May | -0.20% | 0.00% | ||
| 9:00 | EUR | Eurozone PPI Y/Y May | 3.50% | 4.30% |
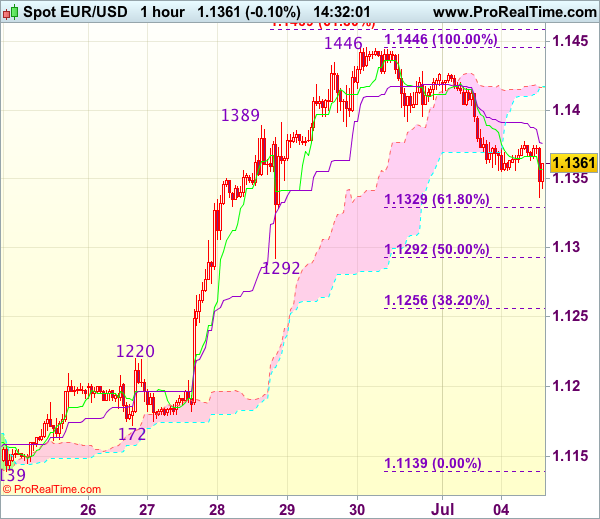
Trade Idea : EUR/USD – Buy at 1.1300
EUR/USD - 1.1356
Most recent candlesticks pattern : N/A
Trend : Near term up
Tenkan-Sen level : 1.1357
Kijun-Sen level : 1.1376
Ichimoku cloud top : 1.1417
Ichimoku cloud bottom : 1.1416
Original strategy :
Buy at 1.1325, Target: 1.1440, Stop: 1.1290
Position : -
Target : -
Stop : -
New strategy :
Buy at 1.1300, Target: 1.1400, Stop: 1.1265
Position : -
Target : -
Stop : -
As euro’s retreat from last week’s high of 1.1446 has kept the single currency under near term pressure, suggesting initial downside risk remains for retracement of recent upmove to 1.1325-30 (38.2% Fibonacci retracement of 1.1139-1.1446), however, reckon support at 1.1292 (as well as 50% Fibonacci retracement) would hold and bring another rise, above 1.1400-10 would bring retest of said resistance at 1.1446, break there would extend recent rise to 1.1455-60 (61.8% projection of 1.1119-1.1389 measuring from 1.1292), then 1.1480.
In view of this, would not chase this rise here and would be prudent to buy euro on pullback as 1.1292 (previous support as well as 50% Fibonacci retracement of 1.1139-1.1446) should limit downside, bring rebound. Below 1.1270 would abort and signal a temporary top is formed, bring correction to 1.1250-55 first.