Sample Category Title
GBPUSD Pauses Rally But Remains Bullish Above Ichimoku Cloud
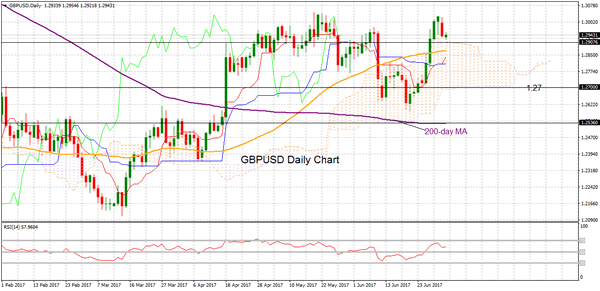
GBPUSD paused a strong rally that took the pair to a high of 1.3029 on June 30. The near-term bullish phase has not shifted yet despite a pullback from this high as the market remains above the daily Ichimoku cloud. Meanwhile, other technical indicators are positively aligned, adding to the assertion that the short-term bullish bias is still intact.
There is not much scope for a sustained decline since the RSI is still in bullish territory above 50 and the recent downturn in the indicator has stalled, suggesting a weakening in GBPUSD’s downside momentum.
Moreover, the Tenkan-sen line (red) has crossed above the Kijun-sen (blue) -a bullish signal- while the 50-day moving average (MA) made a bullish crossover above the 200-day MA on May 12.
Support is expected by the top of the Ichimoku cloud at 1.2907. Should the price contract below this level, the 50-day MA at 1.2872 is likely to provide additional support.
To the upside, a rebound in GBPUSD from current levels could see a retest of the May 18 high of 1.3046 with scope to target the September 2016 high of 1.3120.
Looking at the bigger picture, the market maintains a bullish to neutral structure following a rise from the March 14 low of 1.2108. Since rising above the 200-day MA, the pair has been neutral between 1.2580 and 1.3050.
Aussie Under Pressure, Geopolitical Concerns Lift Yen
The Australian dollar came under pressure against the greenback on the unchanged cash rate by the Reserve Bank of Australia. Meanwhile, the yen got a lift amid geopolitical concerns induced by another North Korea missile test. The euro and sterling were broadly steady against the US dollar.
The RBA left its cash rate unchanged at a historic low of 1.5% during its policy meeting earlier today. While this was widely expected by the markets, the aussie was under pressure against the greenback during the Asian session, having dropped 0.7% to 0.7606. In the global context, Australia's central bank is diverging from its peers that are being increasingly more hawkish. This could have led to a disappointment among investors.
The yen was boosted against the US dollar by geopolitical concerns after news of another North Korean missile test during early hours in Asia. Dollar/yen broke below the 113 level as the Asian trading session was coming to a close. This comes after yesterday's high of 113.46, its strongest since mid-May.
The dollar index that gauges the greenback against a basket of six major currencies inched down, last trading at 96.147.
The euro was steady against the dollar for most of the Asian session, however it came under pressure in early European trading hours on lower than expected change in Spanish unemployment. A data point that measures the unemployed individuals in Spain has fallen by 98,300 in June, below the expected level of 120,300 and May's figure of 111,900. Euro/dollar was last trading at 1.1361.
Sterling was edging higher against the dollar, trading in the range of $1.2922-$1.2958 during the Asian session. All eyes will be on the construction PMI (to be released at 8:30 GMT), which is expected to temper to 55 from May's 56. Any positive surprise to this could lend a boost to the pound.
Looking at commodities, oil prices were under pressure, trending down after eight days of consecutive gains. US crude was last trading at $46.94 a barrel, while Brent crude inched down to $49.53.
Gold was trending higher on dollar weakness, reaching $1,225.30 an ounce, after yesterday's one-and-a-half-month low of $1,1218.45.
Looking ahead, not many events are scheduled that could move the forex market significantly. ECB Executive Board member Peter Praet will be speaking later in the day. His speech might give more colour on the ECB thinking. The US markets will be closed for the July 4th holiday.
GBP/USD Candlesticks and Ichimoku Analysis
Weekly
• Last Candlesticks pattern: Long white candlestick
• Time of formation: 16 Jan 2017
• Trend bias: Down
Daily
• Last Candlesticks pattern: Long white candlestick
• Time of formation: 18 Apr 2017
• Trend bias: Near term up
GBP/USD – 1.2945
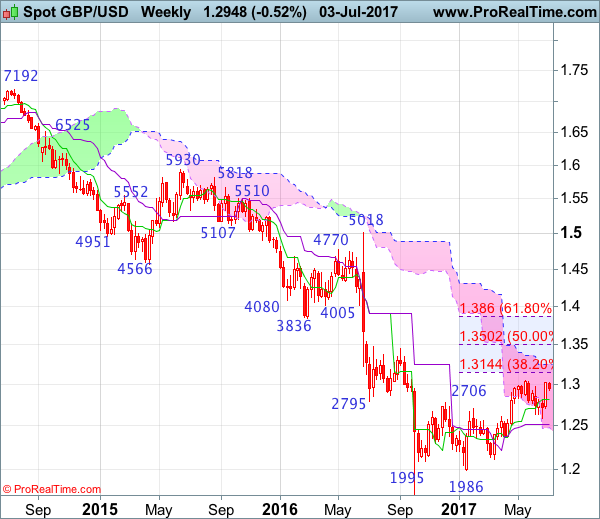
Cable’s rise from 1.2589 turned out to be much stronger than expected, suggesting the correction from 1.3048 has ended there and consolidation with upside bias is seen for a retest of said resistance, however, break there is needed to retain bullishness and signal recent erratic upmove from 1.1986 low has resumed and extend gain to 1.3100, then 1.3140-45 (38.2% Fibonacci retracement of 1.5018-1.1986), however, reckon upside would be limited to 1.3200-10 and price should falter well below 1.3300, risk from there is seen for a retreat later.
On the downside, whilst initial pullback to the Tenkan-Sen (now at 1.2842) cannot be ruled out, reckon downside should be limited to the Kijun-Sen (now at 1.2810) and 1.2760 (previous minor resistance) should hold, bring another rise later. Below 1.2700-10 would abort and prolong consolidation, risk weakness to 1.2650 and possibly towards 1.2600 but said support at 1.2589 should remain intact, bring rebound later. Only a drop below 1.2589 would signal recent decline from 1.3048 top has resumed and extend fall to 1.2550, then 1.2500 support but price should stay well above key support at 1.2365, bring rebound later.
Recommendation: Stand aside for this week
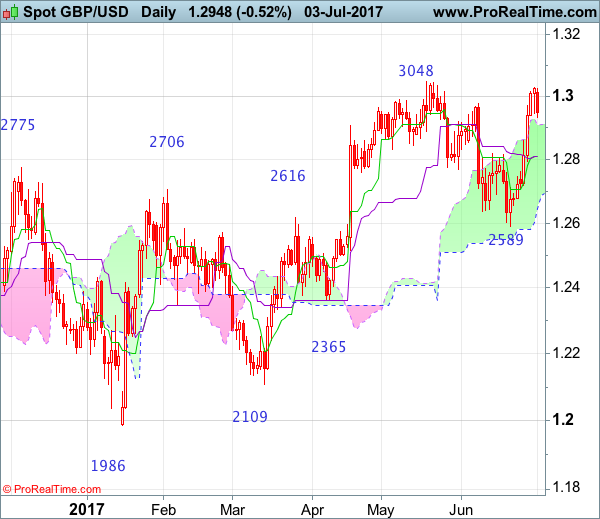
On the weekly chart, last week’s stronger-than-expected rebound formed a long white candlestick, signaling the pullback from 1.3048 has ended and break there would extend recent rise from 1.1986 low (2017 low) for retracement of early decline to 1.3090-00, then towards 1.3140-50 (38.2% Fibonacci retracement of 1.5018-1.1986) but reckon upside would be limited to 1.3200-10 and price should falter below 1.3300, bring retreat later this month.
On the downside, expect pullback to be limited to 1.2850-60 and the Tenkan-Sen (now at 1.2819) should hold, bring another rise later. A drop below 1.2760 would suggest the rebound from 1.2589 has ended instead and prolong choppy trading, bring weakness to 1.2640-50 but said support at 1.2589 should remain intact. Only a break of said support at 1.2589 would signal the fall from 1.3048 top is still in progress for correction of early upmove to 1.2550, however, still reckon downside would be limited and previous support at 1.2515 should remain intact, price should stay well above previous support at 1.2365, bring rebound later.
EUR/USD Daily Outlook
Daily Pivots: (S1) 1.1336; (P) 1.1381 (R1) 1.1408; More.....
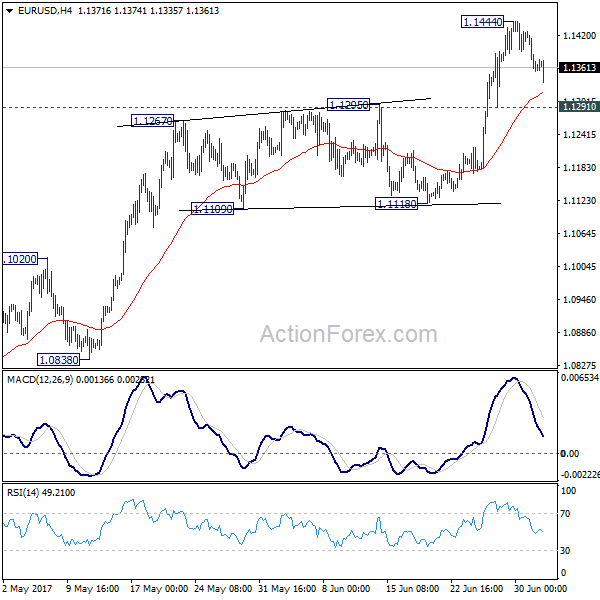
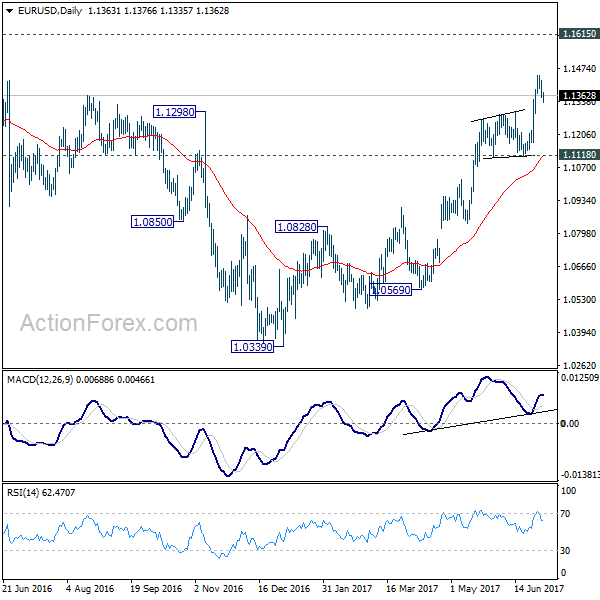
EUR/USD's retreat from 1.1444 extends lower but it's staying above 1.1291 support. Intraday bias remains neutral first. More consolidative trading could be seen. But downside should be contained by 1.1291 support to bring rise resumption. Break of 1.1444 will extend the rally from 1.0339 low to 1.1615 resistance next.
In the bigger picture, the firm break of 1.1298 resistance further affirm medium term reversal. That is an important bottom was formed at 1.0339 on bullish convergence condition in weekly MACD. Further rise would be seen to 55 month EMA (now at 1.1776). Sustained break there will pave the way to 38.2% retracement of 1.6039 (2008 high) to 1.0339 (2017 low) at 1.2516 next. This will now remain the favored case as long as 1.1118 support holds.
A Boost To U.S. Growth?
Trading on Monday was 'buoyant' across all markets ahead of today's July 4th Holiday in the US – with many traders anxiously awaiting this Friday's Non-Farm Payroll release to gauge the 'next steps' of the Federal Reserve. USD strengthened the most in 2 weeks as American factories productivity jumped in June at the fastest pace in close to 3 years. The Institute for Supply Management (ISM) said on Monday its index of national factory activity rose to a reading of 57.8 last month (54.9 in May) its best performance since August 2014. Conversely, U.S. construction spending remained flat in May but federal government outlays on construction projects were the highest in more than four years.
Ahead of a meeting between leaders from the US and China this week in Germany, North Korea today test-fired a missile into Japanese waters. The test-fire adds to continued tension in the area with Japanese Prime Minister Abe stating that the launch 'ignores repeated warnings from the international community,' and that 'the launch this time shows its threat was further increased.'
Data released on Monday showed that UK factory growth slowed more than expected in June, as export orders rose at their weakest pace in five months. The Markit/CIPS UK Manufacturing Purchasing Managers' Index (PMI) fell to 54.3 from a downwardly revised 56.3 in May, a three-month low and below economists' forecasts. As a result, GBPUSD lost 0.5% on the day trading down to a low of 1.29318 snapping its 8-day rally 'streak'. GBPUSD has continued lower overnight trading as low as 1.29223 this morning and is currently trading around 1.2940.
With USD strength EURUSD declined 0.5% on the day trading down to a low of 1.13546 on Monday. EURUSD is currently trading around 1.1350.
USDJPY traded 1% higher on Monday to reach a high of 113.452. USDJPY is currently trading around 113.00.
Earlier today the Reserve Bank of Australia, at its first meeting of the new financial year, kept the official interest rate at 1.5%, pointing to a gradually improving global economy and local inflation. Traders are pricing in a rate hike by the Board at around 50% over the next 12 months. AUD fell as much as 0.7% to 0.76039 on the announcement, reversing a 0.2% gain in earlier trade. Currently, AUDUSD is trading around 0.7610.
Oil prices rose after data on Friday indicated active U.S. rigs had declined for the first time in 24 weeks. WTI rose over 1% reaching a high on the day of $46.97pb. WTI has rallied more than 8% over eight days, after falling from the year's highs to recently enter a 'bear market'. WTI is currently trading around $46.95 with Brent trading around $49.50.
Gold also fell against USD declining 1.8% on the day to trade as low as $1,219.34. Gold has retraced slightly overnight to currently trade around $1,225.
Today is rather light on major economic data releases as the US is on holiday however, there will be interest in UK PMI Construction data that is scheduled to be released at 9:30 BST with the market expecting a slight decrease to 55 from the previous reading of 56. At 11:00 BST the UK will have its Inflation Report Hearings by The Treasury Committee so we may see volatility in GBP.
Foreign Exchange Market Commentary: EUR/USD, USD/JPY, GBP/USD, GOLD, WTI CRUDE, DJIA, FTSE100, DAX
EUR/USD
The American dollar started the second quarter with a positive tone, edging higher against all of its major rivals this Monday, although holding not far from its recent lows. The EUR/USD pair retreated further after reaching a year high of 1.1445 late last week, settling in the 1.1360 region, in spite of strong EU data released early Europe. The final revision of the EU June Markit manufacturing PMIs showed that the sector's growth extended into the end of the second quarter, with the index up to 57.4, a fresh six-year high, and above flash estimate of 57.3. Across the region, readings were mixed with the German index up to 59.6, its highest in 74 months according to Markit, while Spain and French figures suffered modest downward revisions. Unemployment in the EU surged to 9.3% in May, above previous 9.25, but below from the 10.2% printed a year earlier. The dollar found support after the US opening in the ISM manufacturing report, as according to it, economic activity expanded for the 97th consecutive month, up to 57.8 in June from previous 54.9.
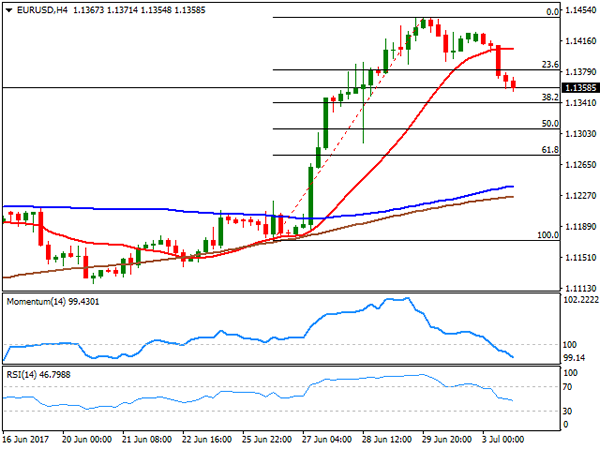
The EUR/USD pair fell down to 1.1355 before paring losses, with selling interest limited after an early US close ahead of the July 4th holiday. From a technical point of view, the pair has broken below the 23.6% retracement of last week's rally, now the immediate resistance at 1.1380, but more relevant, the pair is retreating after approaching a major long-term resistance, the 1.1460 region, as the pair has been unable to surpass it pretty much since January 2015. Short term, the 4 hours chart shows that the price has also broken below a now horizontal 20 SMA, whilst the Momentum indicator keeps heading south within bearish territory, and the RSI indicator heads south at 46, supporting some further slides ahead. The immediate support comes at 1.1340, the 38.2% retracement of the mentioned rally, followed by Thursday's low of 1.1290. Below this last, an interim top will be confirmed, anticipating some additional declines for the following sessions.
Support levels: 1.1340 1.1290 1.1250
Resistance levels: 1.1380 1.1420 1.1460
USD/JPY
The American dollar started the second quarter with a positive tone, edging higher against all of its major rivals this Monday, although holding not far from its recent lows. The EUR/USD pair retreated further after reaching a year high of 1.1445 late last week, settling in the 1.1360 region, in spite of strong EU data released early Europe. The final revision of the EU June Markit manufacturing PMIs showed that the sector's growth extended into the end of the second quarter, with the index up to 57.4, a fresh six-year high, and above flash estimate of 57.3. Across the region, readings were mixed with the German index up to 59.6, its highest in 74 months according to Markit, while Spain and French figures suffered modest downward revisions. Unemployment in the EU surged to 9.3% in May, above previous 9.25, but below from the 10.2% printed a year earlier. The dollar found support after the US opening in the ISM manufacturing report, as according to it, economic activity expanded for the 97th consecutive month, up to 57.8 in June from previous 54.9.
The EUR/USD pair fell down to 1.1355 before paring losses, with selling interest limited after an early US close ahead of the July 4th holiday. From a technical point of view, the pair has broken below the 23.6% retracement of last week's rally, now the immediate resistance at 1.1380, but more relevant, the pair is retreating after approaching a major long-term resistance, the 1.1460 region, as the pair has been unable to surpass it pretty much since January 2015. Short term, the 4 hours chart shows that the price has also broken below a now horizontal 20 SMA, whilst the Momentum indicator keeps heading south within bearish territory, and the RSI indicator heads south at 46, supporting some further slides ahead. The immediate support comes at 1.1340, the 38.2% retracement of the mentioned rally, followed by Thursday's low of 1.1290. Below this last, an interim top will be confirmed, anticipating some additional declines for the following sessions.
Support levels: 1.1340 1.1290 1.1250
Resistance levels: 1.1380 1.1420 1.1460
GBP/USD
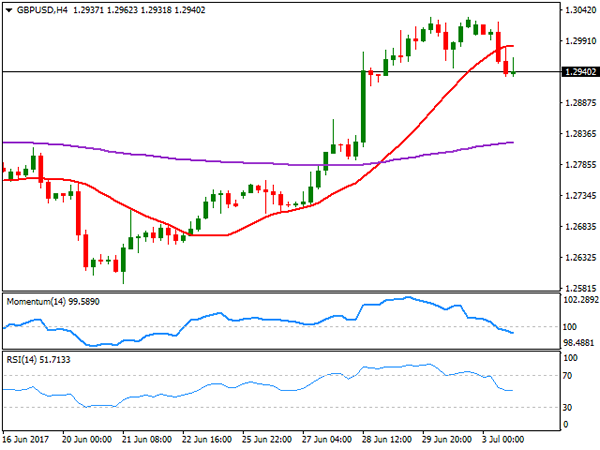
The American dollar started the second quarter with a positive tone, edging higher against all of its major rivals this Monday, although holding not far from its recent lows. The EUR/USD pair retreated further after reaching a year high of 1.1445 late last week, settling in the 1.1360 region, in spite of strong EU data released early Europe. The final revision of the EU June Markit manufacturing PMIs showed that the sector's growth extended into the end of the second quarter, with the index up to 57.4, a fresh six-year high, and above flash estimate of 57.3. Across the region, readings were mixed with the German index up to 59.6, its highest in 74 months according to Markit, while Spain and French figures suffered modest downward revisions. Unemployment in the EU surged to 9.3% in May, above previous 9.25, but below from the 10.2% printed a year earlier. The dollar found support after the US opening in the ISM manufacturing report, as according to it, economic activity expanded for the 97th consecutive month, up to 57.8 in June from previous 54.9.
The EUR/USD pair fell down to 1.1355 before paring losses, with selling interest limited after an early US close ahead of the July 4th holiday. From a technical point of view, the pair has broken below the 23.6% retracement of last week's rally, now the immediate resistance at 1.1380, but more relevant, the pair is retreating after approaching a major long-term resistance, the 1.1460 region, as the pair has been unable to surpass it pretty much since January 2015. Short term, the 4 hours chart shows that the price has also broken below a now horizontal 20 SMA, whilst the Momentum indicator keeps heading south within bearish territory, and the RSI indicator heads south at 46, supporting some further slides ahead. The immediate support comes at 1.1340, the 38.2% retracement of the mentioned rally, followed by Thursday's low of 1.1290. Below this last, an interim top will be confirmed, anticipating some additional declines for the following sessions.
Support levels: 1.1340 1.1290 1.1250
Resistance levels: 1.1380 1.1420 1.1460
GOLD
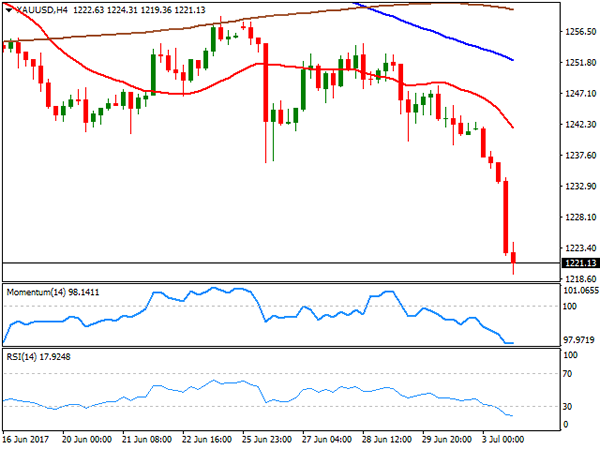
Dollar's recovery sent gold tumbling this Monday, with spot ending the day around $1,221.00 a troy ounce, its lowest settlement since early May. A recovery in the USD-index after reaching a 9-month low last week alongside with a sharp advance in US Treasury yields undermined the precious metal, while a strong US manufacturing report revived hopes for a soon-to-come rate hike in the US. The technical picture has turned strongly bearish for the commodity, as the daily chart shows that it settled below its 200 DMA for the first time since mid May, whilst a bearish 20 DMA is crossing below the 100 DMA far above the current level. In the same chart, technical indicators head south within negative territory, approaching oversold readings , and also in line with additional slides ahead. In the 4 hours chart, the price is developing below all of its moving averages, with the 20 SMA gaining bearish momentum around 1,241.80, and technical indicators moderating their declines in oversold territory, rather reflecting the low volumes at this time of the day than suggesting downward exhaustion.
Support levels: 1,219.30 1,211.10 1,203.80
Resistance levels: 1,224.40 1,236.50 1,241.80
WTI CRUDE OIL
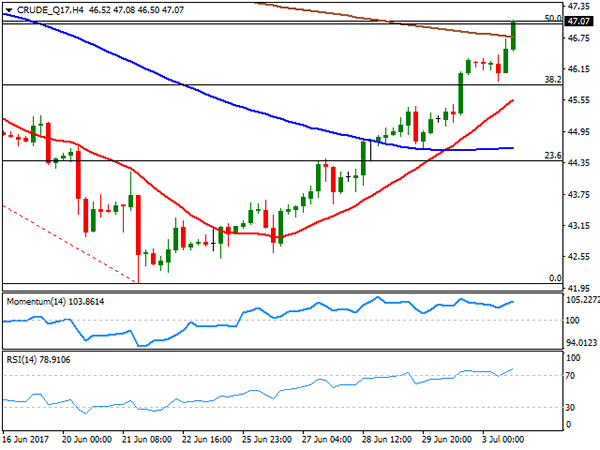
West Texas Intermediate crude oil futures closed the day at $47.05 a barrel, its highest settlement in nearly four weeks, up for an eighth straight session in a row, and despite news indicating that OPEC's output surged in June to the highest for this year. Most of the increase came from Libya and Nigeria, both countries exempted from the cut deal. News late last week, indicating that US production has decreased keep supporting the commodity that retains the positive tone seen on the previous update, given that in the daily chart, technical indicators continue heading higher within positive territory, whilst the price extended well-above its 20 SMA, now hovering around the 50% retracement of its latest daily decline. In the 4 hours chart, technical indicators accelerated their advances within overbought levels, whilst the price surpassed its 200 SMA for the first time since late May, further supporting additional gains towards 48.15, the 61.8% retracement of the mentioned slide.
Support levels: 46.30 45.80 45.20
Resistance levels: 47.60 48.15 48.80
DJIA
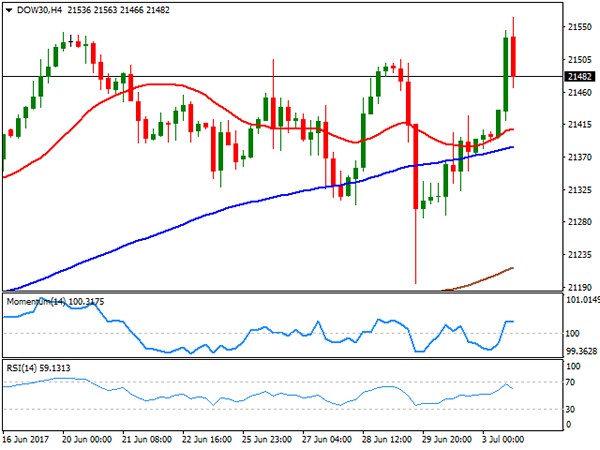
US indexes closed mixed, with the Nasdaq Composite down 30 points, to 6,110.06 amid a decline in tech-related equities, but the Dow Jones Industrial Average settled at 21,479.27, up 129 points and after setting a record high intraday of 21,563. The S&P also closed up at 2,429.01, advancing 0.23%. Gains were led by financials and energy-related equities, and within the Dow, Goldman Sachs was the best performer, up 2.42%, followed by JPMorgan that added 2.04%. Chevron, El du Pont and Exxon Mobil, all added over 1.50%. Microsoft was the worst performer, down 1.10%, followed by Intel that shed 0.83%. Technically, the daily chart for the DJIA shows that the index recovered after hovering around a bullish 20 DMA during the last days of the past week, whilst technical indicators have bounced from their mid-lines, with a limited upward potential ahead of Tuesday's holiday. In the 4 hours chart, the index settled above all of its moving averages, but given the strong retracement ahead of the close, technical indicators have lost upward strength, with the RSI already turning lower, but both within positive territory, limiting chances of a steeper decline ahead.
Support levels: 21,420 21,361 21,310
Resistance levels: 21,462 21,506 21,563
FTSE100
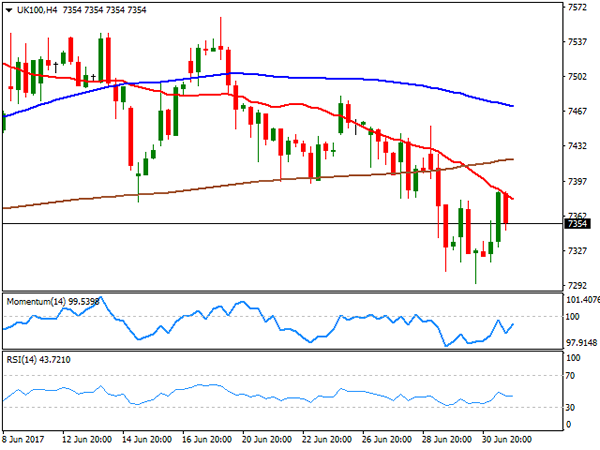
The FTSE 100 closed the day at 7,377.09, up roughly 65 points amid a continued advance in oil prices and a weaker Pound. The Footsie put a halt to a 4-day slide, helped further by a recovery in a mining sector. Glencore led advancers, settling 5.01% higher, followed by Rio Tinto and Anglo American that added 4.0% each. Provident Financial, on the other hand, was the worst performer, closing 2.67% lower, followed by Micro Focus International that lost 1.85%. The daily chart for the London benchmark shows that the index was unable to recover above its 100 DMA, whilst the 20 DMA continues heading south above the largest, and technical indicators have bounced modestly from near oversold levels, but are still within negative territory, all of which suggests that the risk remains towards the downside. In the 4 hours chart, the risk is also towards the downside, given that an early advance was contained by a bearish 20 SMA, currently at 7,380, while technical indicators hover within bearish territory, with no certain directional strength.
Support levels: 7,331 7,294 7,256
Resistance levels: 7,380 7,424 7,452
DAX
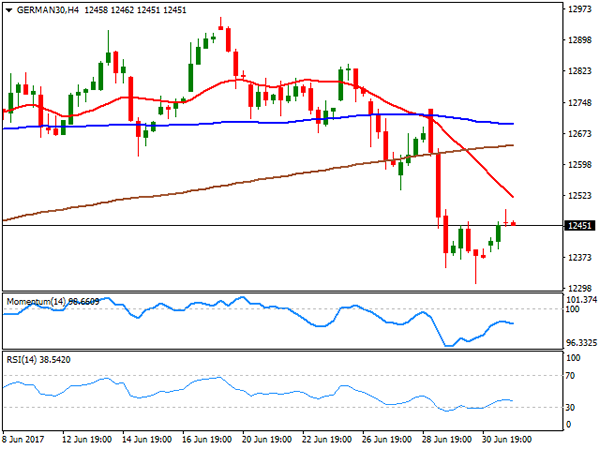
The German DAX advanced 1.22% or 152 points at the beginning of the week to settle at 12,471.31, with all European index closing with gains as banks and mining-related equities led the way higher. The Markit manufacturing PMI was revised higher in Germany, up to 59.6 from 59.5 in May, the highest in 74 months according to the official report. Commerzbank was the best performer within the DAX, up 4.29%, followed by ThyssenKrupp that added 4.01%. Vonovia topped losers' list, with a 0.89% decline. The recovery was not enough to revert the negative tone in the benchmark, as in the daily chart, it remains well below a bearish 20 DMA, whilst technical indicators have barely lost downward strength, holding near oversold readings. In the same chart, a light of hope comes from the fact that the price has extended its bounce from its 100 DMA. Shorter term, and according to the 4 hours chart, the upside also seems limited as the intraday advance stalled well-below a still strongly bearish 20 SMA, whilst technical indicators resumed their declines within negative territory, after correcting oversold readings.
Support levels: 12,420 12,364 12,310
Resistance levels: 12,448 12,490 12,542
USD/CHF Candlesticks and Ichimoku Analysis
Weekly
• Last Candlesticks pattern: Shooting star
• Time of formation: 7 Mar 2017
• Trend bias: Sideways
Daily
• Last Candlesticks pattern: Morning star
• Time of formation: 9 May 2017
• Trend bias: Near term up
USD/CHF – 0.9628
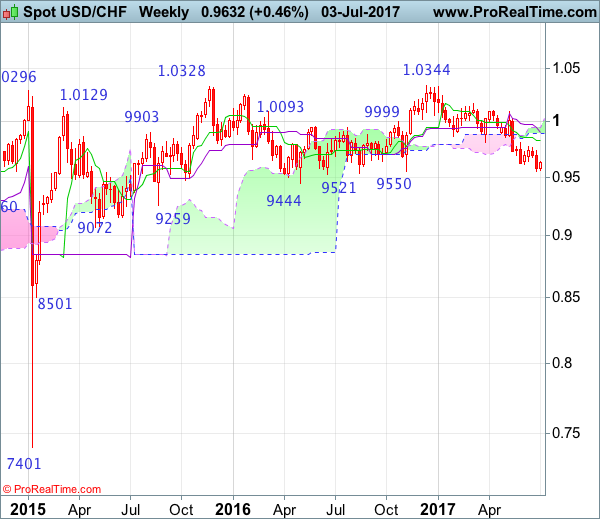
Although the greenback resumed recent decline and fell to as low as 0.9552 (just held above previous chart support at 0.9550), the subsequent rebound formed a white candlestick yesterday and consolidation above this level would be seen, above the Tenkan-Sen (now at 0.9648) would bring test of the Kijun-Sen (now at 0.9680) but a daily close above this level is needed to add credence to this view, bring retracement of recent decline to 0.9700, then test of 0.9738 resistance. A break above there would encourage for a stronger rebound to previous resistance at 0.9771 but reckon resistance at 0.9808 would hold on first testing.
On the downside, whilst pullback to 0.9590-00 cannot be ruled out, said support at 0.9552 should hold and bring another rebound to aforesaid retracement targets. Below indicated support at 0.9550-52) would signal recent decline from 1.0344 top (2016 high) is still in progress and may extend further weakness to psychological support at 0.9500, having said that, loss of downward momentum should prevent sharp fall below another previous chart support at 0.9444 and risk from there has increased for a rebound later.
Recommendation: Buy at 0.9600 for 0.9800 with stop below 0.9500

On the weekly chart, although the greenback dropped again last week to as low as 0.9552, dollar needs to penetrate support at 0.9550 to retain bearishness and extend the decline from 1.0344 to 0.9500, then towards another previous support at 0.9444, however, loss of near term downward momentum should prevent sharp fall below 0.9400 and reckon 0.9350 would hold from here, risk from there has increased for a rebound later.
On the upside, although initial recovery to 0.9700 and then 0.9735-40 cannot be ruled out, reckon resistance at 0.9808 would limit upside and bring another decline. A weekly close above the Tenkan-Sen (now at 0.9826) would defer and risk a stronger rebound to 0.9940-50 but 1.0007 (previous resistance) should limit upside and price should falter well below 1.0100, bring another selloff later. Above 1.0100 would signal low is formed instead and suggest the aforesaid decline from 1.0344 has ended, bring test of 1.0171 resistance next.
GBP/USD Daily Outlook
Daily Pivots: (S1) 1.2904; (P) 1.2963; (R1) 1.2996; More...
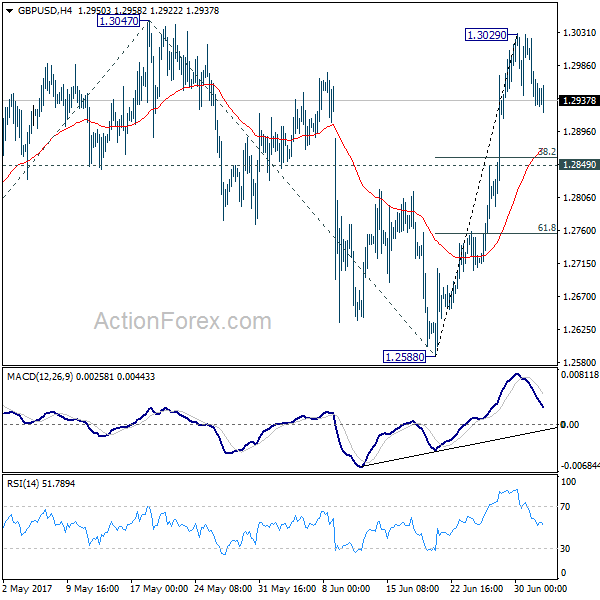
Intraday bias in GBP/USD remains neutral as consolidation from 1.3029 continues. At this point, deeper retreat cannot be ruled out. But downside should be contained above 1.2849 support to bring rise resumption. Break of 1.3029 should then send GBP/USD through 1.3047 to 61.8% projection of 1.2108 to 1.3047 from 1.2588 at 1.3168 next.
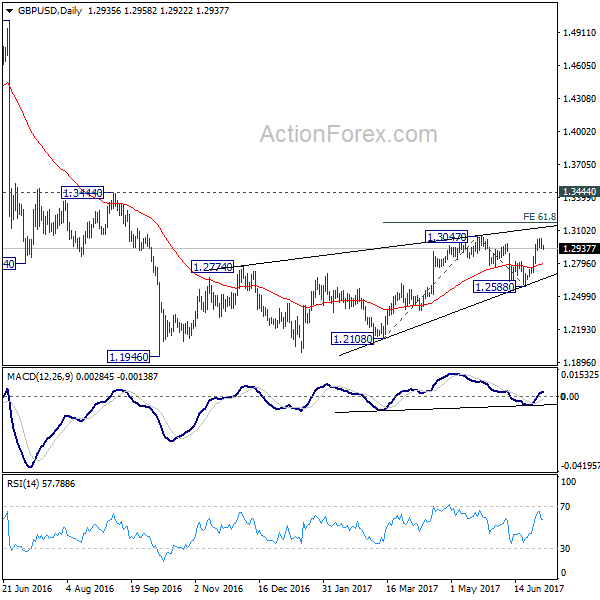
In the bigger picture, overall, price actions from 1.1946 medium term low are seen as a corrective pattern that is still in progress. While further upside is now in favor, overall outlook remains bearish as long as 1.3444 key resistance holds. Larger down trend from 1.7190 is expected to resume later after the correction completes. And break of 1.2588 will indicate that such down trend is resuming.
USD/CHF Daily Outlook
Daily Pivots: (S1) 0.9590; (P) 0.9616; (R1) 0.9661; More......
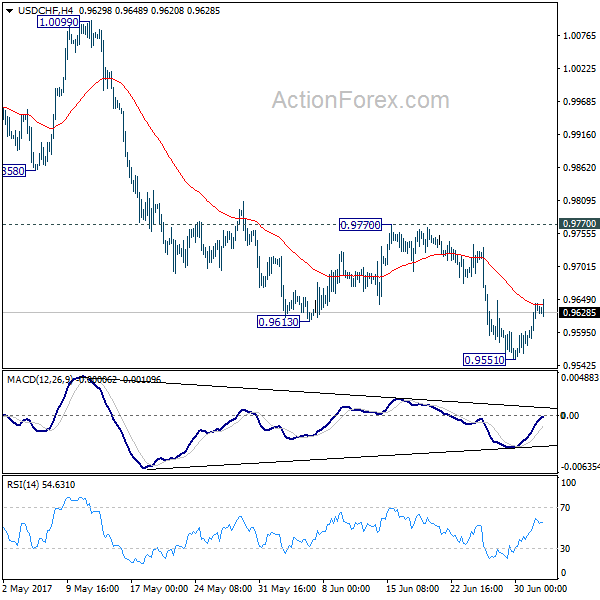
USD/CHF's recovery is still in progress and is pressing 4 hour 55 EMA. Further rise cannot be ruled out, but still, upside of recovery should be limited below 0.9770 resistance and bring resumption. Below 0.9551 will extend the decline from 1.0342 to 0.94443 key support level. At this point, we'd expect strong support from there to bring rebound.
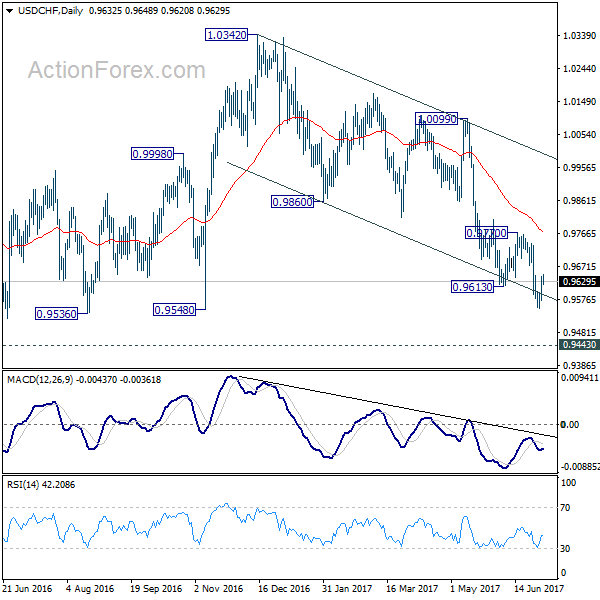
In the bigger picture, USD/CHF is still bounded in medium term range of 0.9443/1.0342 for the moment. Consolidative trading would likely continue and medium term outlook remains neutral. Break of 1.0342 key resistance is needed to confirm underlying bullish momentum in the pair. Meanwhile, downside attempts should be contained by 0.9443 key support level. However, sustained break of 0.9443 will carry larger bearish implication and target 0.9 handle.
USD/JPY Daily Outlook
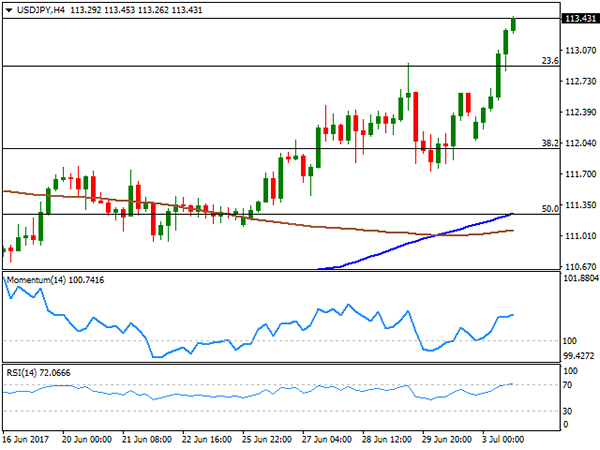
Daily Pivots: (S1) 112.46; (P) 112.97; (R1) 113.88; More...
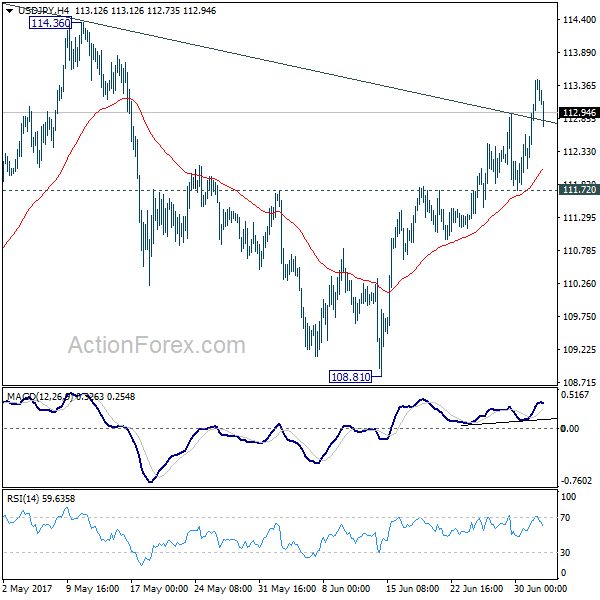
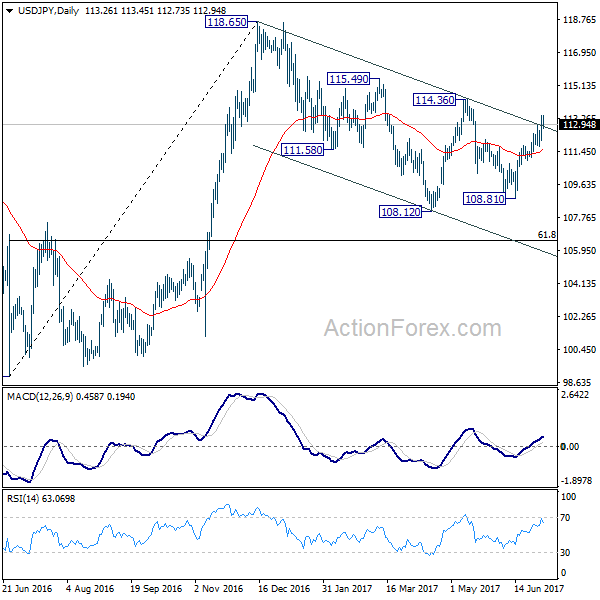
With 111.72 minor support intact, near term outlook is USD/JPY remains bullish for further rise to 114.36 resistance. Current development suggest that whole corrective pull back from 118.65 has completed at 108.12 already. Break of 114.36 will confirm this bullish view and target 118.65 again. On the downside, break of 111.72 support is needed to indicate short term topping. Otherwise, outlook will remain bullish in case of retreat.
In the bigger picture, the corrective structure of the fall from 118.65 suggests that rise from 98.97 is not completed yet. Break of 118.65 will target a test on 125.85 high. At this point, it's uncertain whether rise from 98.97 is resuming the long term up trend from 75.56, or it's a leg in the consolidation from 125.85. Hence, we'll be cautious on topping as it approaches 125.85.