Sample Category Title
WTI Oil Drifts Lower But Strong Support Below
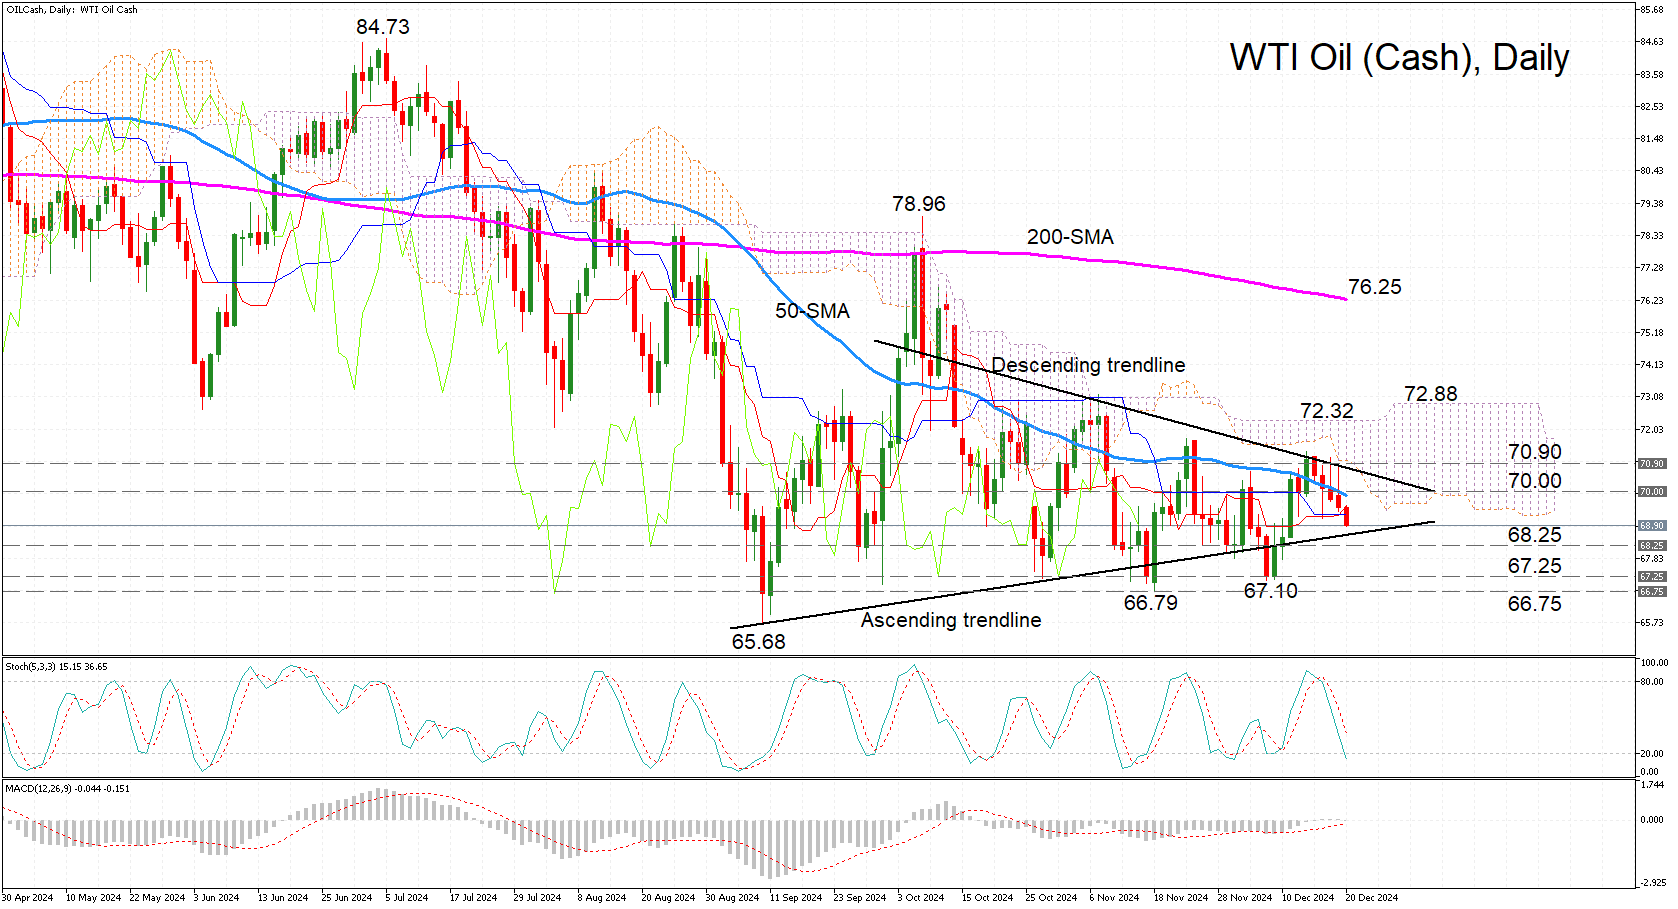
- WTI Oil continues to trade sideways, but bias is bearish
- Price remains constrained between key resistance and support levels
WTI Oil (Cash) is headed for a fifth straight day of declines, slipping below 69.00 and widening the gap with the Ichimoku cloud. The technical indicators are bearish, but to a varying extent. The stochastic oscillator is diving towards the oversold region, suggesting that an upside correction could be on the cards soon. However, the MACD is only marginally negative and remains above its red signal line, pointing to some bullish support as well as scope for greater losses.
In the immediate term, the main challenge for the bears is the ascending trendline that stands ready to defend the price at 68.60. But the fight doesn’t stop there. The 68.25, 67.25 and 66.75 regions have acted as strong barriers over the past few months. If these fail, the final test will be the September low of 65.68. Breaching this too would signal the resumption of the longer-term downtrend.
To the upside, the 50-day simple moving average (SMA) just below the 70.00 mark is the first major hurdle for the bulls. Higher up, the descending trendline and the bottom of the Ichimoku cloud pose a problem in the 70.90 zone. But for any positive momentum to gain traction, the price would need to climb above the shifting cloud tops of 72.32 and 72.88, before setting sights on the 200-day SMA around 76.25. However, for a stronger confirmation of a switch to a bullish outlook, the price needs to additionally surpass the October high of 78.96.
But for now, further consolidation is likely in the coming sessions.
Nasdaq 100 Technical: At Risk of Staging a Multi-Week Corrective Decline
- A transition from a Fed “dovish pivot” to a “normalization” pivot may put a halt to this year-end seasonal “Santa Rally” on the US stock indices.
- Nasdaq 100 momentum and market breadth have weakened which supports a potential medium-term (multi-week) corrective decline sequence.
- Watch the 20,790 downside trigger level of the Nasdaq 100.
The Nasdaq 100 has reversed its bullish momentum where at the start of this week, it was the sole major US benchmark stock index to print a fresh all-time high of 22,133 on Monday, 16 December.
The ex-post release of the US Federal Reserve monetary policy’s latest “dot plot” and Fed Chair Powell’s press conference on Wednesday, 18 December, have spooked the US stock market. The Fed has indicated the prospect of lesser interest rate cuts in 2025 due to the risk of inflationary pressure resurgence (some Fed officials have taken into account the effects of the incoming Trump administration’s “America First” policy).
The heightened prospect of a transition from a Fed “dovish pivot” to a “normalization” pivot in 2025 is likely the narrative at this juncture that may dim the hopes of the seasonal “Santa Rally” for this year-end.
The higher beta Nasdaq 100 recorded a loss of 4% from 18 December to 19 December (open to close) ex-post FOMC, the second worst performer among the four major US stock indices; Russell 2000 (-5.3%), S&P 500 (-3%), Dow Jones Industrial Average (-2.6%).
Several technical elements have now flashed out an increasing odd of a medium-term (multi-week) correction on the Nasdaq 100
Weak market breadth
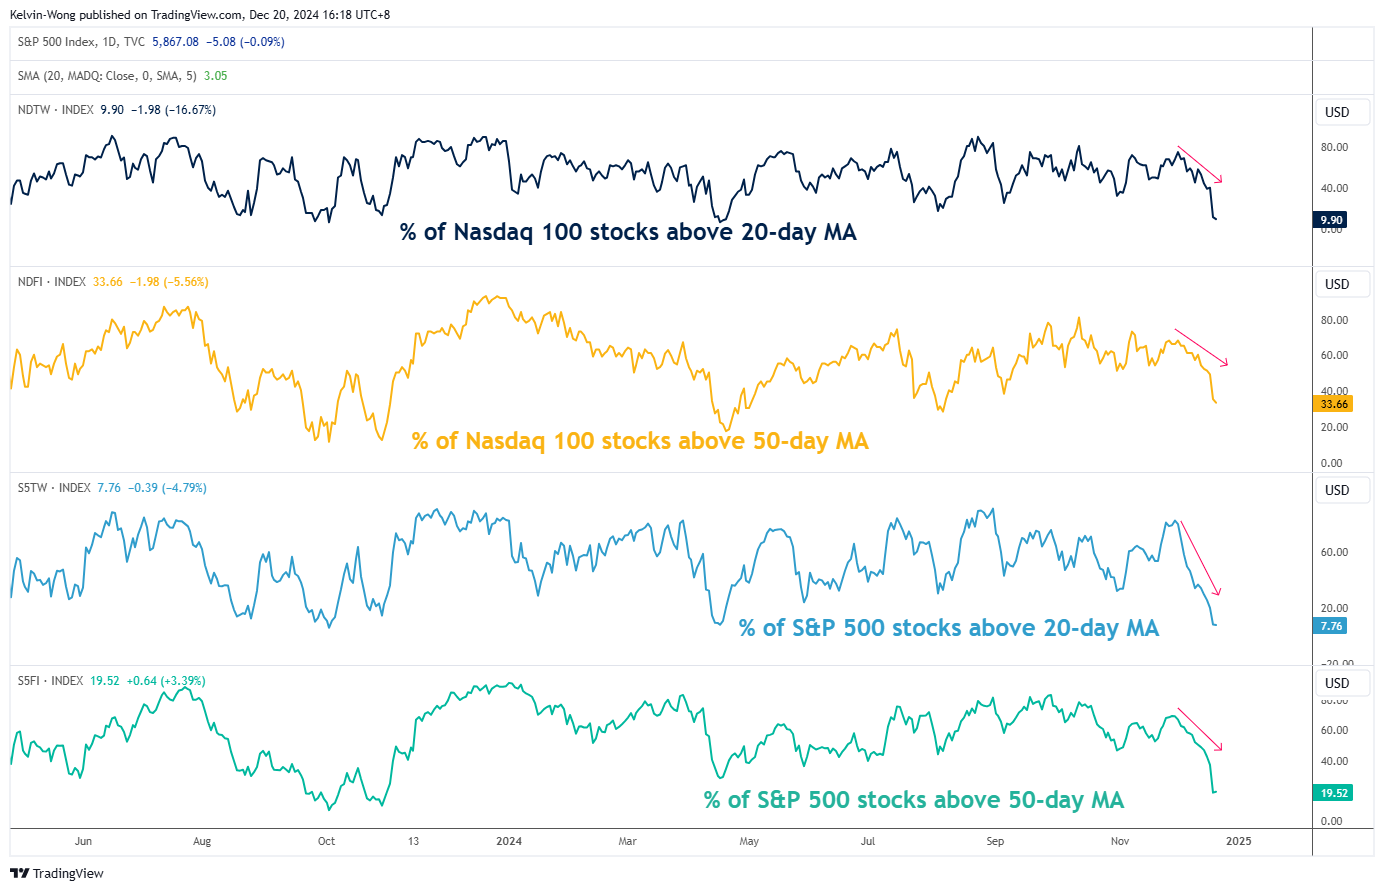
Fig 1: Percentage of Nasdaq 100 and S&P 500 component stocks above 20-day & 50-day moving averages as of 19 Dec 2024 (Source: TradingView, click to enlarge chart)
Since the start of December 2024, the percentage of Nasdaq 100 component stocks trading above their respective 20-day and 50-day moving averages has fallen. In contrast, the price actions of the Nasdaq 100 have kept rocketing upwards to print record highs in the recent two weeks.
Right now, the percentage of Nasdaq 100 component stocks trading above their respective 20-day moving averages have plummeted to 9.9% as of 19 December. Also, the Nasdaq 100 component stocks above their respective 50-day moving averages have declined to 33.7% (see Fig 1).
20,790 is the last line of defense for the Nasdaq 100
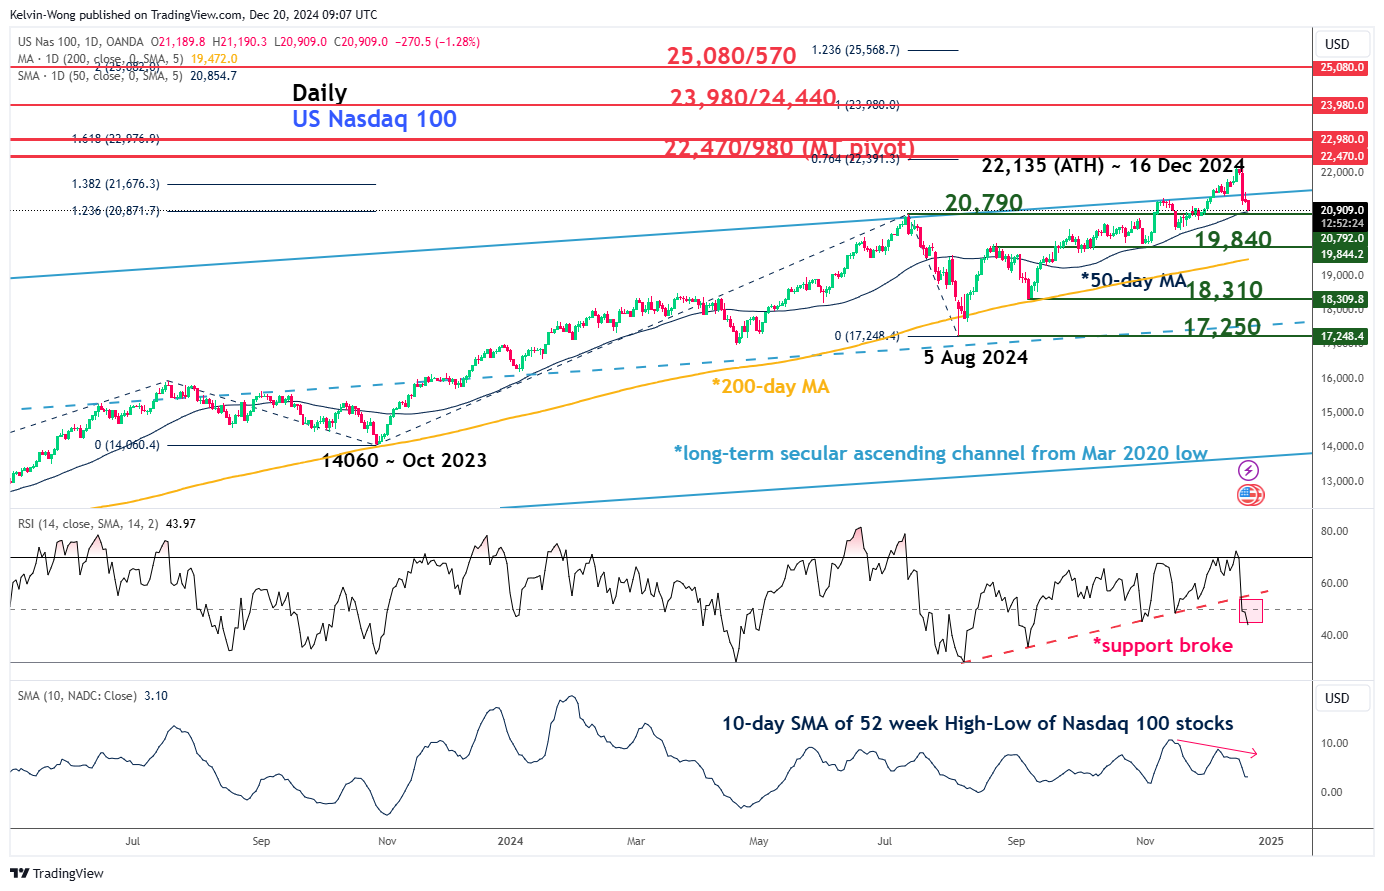
Fig 2: Nasdaq 100 CFD major & medium-term trends as of 20 Dec 2024 (Source: TradingView, click to enlarge chart)
The recent past three days of price actions of the Nasdaq 100 CFD Index (a proxy of Nasdaq 100 E-mini futures have reintegrated below the upper boundary of its long-term secular ascending channel from the March 2020 low. This observation suggests the bullish breakout seen on 4 December is a failure acceleration move.
Since its all-time high on 16 December, it has declined by 5.5%. It is now hovering right above its 50-day moving average, which is acting as key intermediate support at 20,790.
The latest reading seen from the daily RSI momentum indicator suggests that the 20,790 key intermediate support is likely to be a “weak support” as the RSI has broken below a parallel ascending trendline support and breached below the 50 level that indicates a revival of medium-term bearish momentum (see Fig 2).
In addition, fewer Nasdaq 100 component stocks managed to record new 52-week highs since 14 November 2024 as the 10-day moving average of the difference between new 52-week highs minus 52-week lows has shaped a lower high.
Hence, a break with a daily close below the 20,790 key intermediate support may trigger a multi-week corrective decline sequence to expose the medium-term supports of 19,840 and 18,310 in the first step.
On the other hand, clearance above the 22,470/980 medium-term pivotal resistance zone invalidates the bearish scenario for the continuation of its impulsive upmove sequence for the next medium-term resistances to come in at 23,980/24,440 and 25,080/570.
British Pound Stabilizes as Retail Sales Edge Up
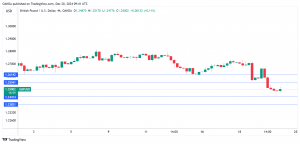
The British pound has steadied on Friday, after sliding 1.6% in the past two days. In the European session, GBP/USD is trading at 1.2510, down 0.10% on the day at the time of writing.
Retail sales point to weak Christmas spending
UK retail sales posted a small gain of 0.2% m/m in November. This was a rebound from the 0.7% decline in October but missed the market estimate of 0.5%. Retail sales growth was hampered by weak clothing sales, which fell to their lowest volume since January 2022, as well as the wet weather. Annually, retail sales rose 0.5%, following a downwardly revised 2% gain in October and below the market estimate of 0.8%.
The weak retail sales report indicate that consumers are being cautious during the key Christmas shopping period, which is dampening economic activity. The ‘tax and spend’ Autumn budget hasn’t improved consumer confidence, as consumers remain squeezed by high prices and elevated interest rates.
UK inflation rose to 2.6% y/y in November from 2.3% a month earlier. This was an eight-month high and has raised concerns that the economy will enter a “stagflation” phase in the new year, which is marked by low growth and high inflation. The economy has contracted for two straight months and the Bank of England is projecting that inflation will keep rising and moved closer to 3% in 2025.
The BoE maintained the cash rate at 4.75% on Thursday, as expected. The BoE monetary policy summary said that policy would need to remain restrictive until the upside risk to inflation had eased and that the central bank would take a “gradual” approach to easing policy. This could mean a rate cut at the next meeting in February, but that would be contingent on inflation moving lower, closer towards to BoE 2% inflation target.
GBP/USD Technical
- There is resistance at 1.2554 and 1.2614
- 1.2442 and 1.2382 are the next support levels
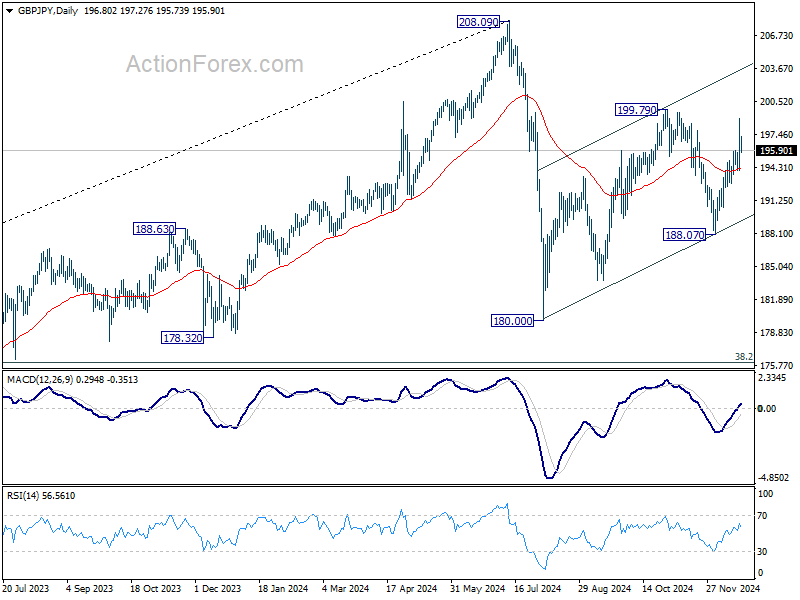
GBP/JPY Daily Outlook
Daily Pivots: (S1) 194.27; (P) 196.61; (R1) 199.16; More...
GBP/JPY retreated ahead of 199.79 resistance and intraday bias is turned neutral first. Further rally will remain in favor as long as 194.04 support holds. Corrective pattern from 180.00 is extending, and break of 199.79 will target channel resistance (now at 202.84).
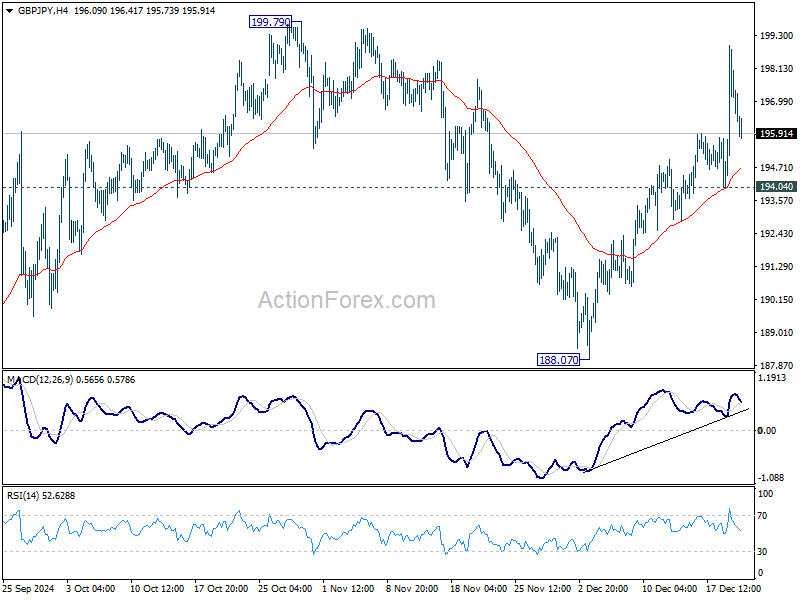
In the bigger picture, price actions from 208.09 are seen as a correction to whole rally from 123.94 (2020 low). The range of consolidation should be set between 38.2% retracement of 123.94 to 208.09 at 175.94 and 208.09. However, decisive break of 175.94 will argue that deeper correction is underway.
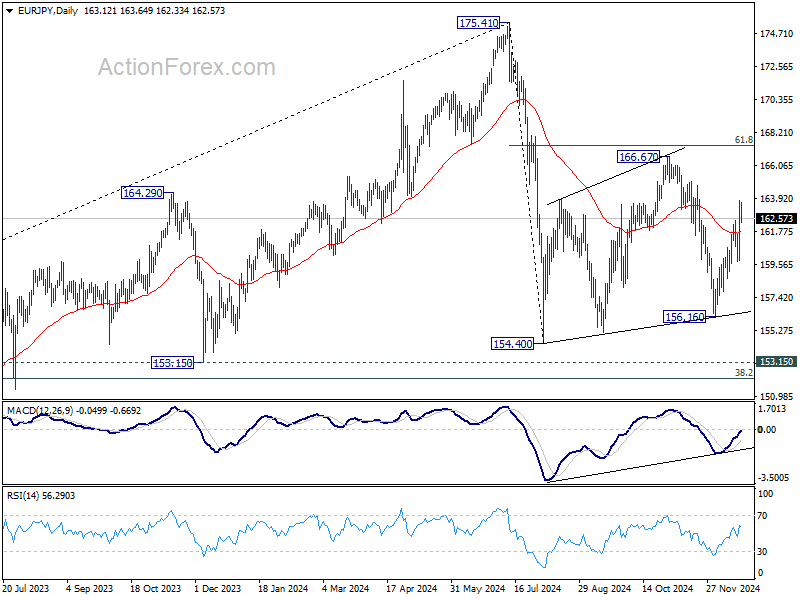
EUR/JPY Daily Outlook
Daily Pivots: (S1) 160.74; (P) 162.27; (R1) 164.69; More...
Intraday bias in EUR/JPY stays on the upside as rise from 156.16 is in progress. Corrective pattern from 154.40 is extending with another up-leg. Further rise should be seen to 166.67 resistance and possibly above. For now, risk will stay on the upside as long as 159.79 support holds, in case of retreat.
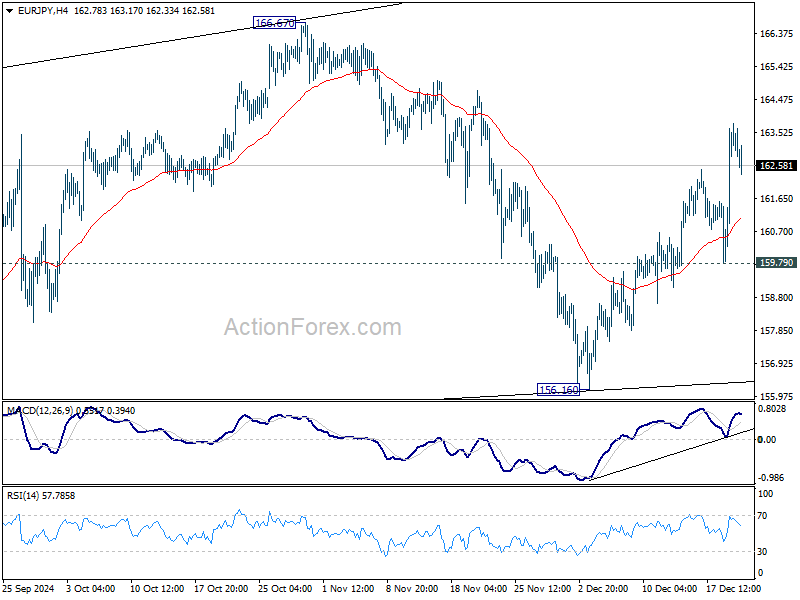
In the bigger picture, price actions from 175.41 are seen as correction to rally from 114.42 (2020 low). The range of consolidation should have been set between 38.2% retracement of 114.42 to 175.41 at 152.11 and 175.41 high. However, decisive break of 152.11 would argue that deeper correction is underway.
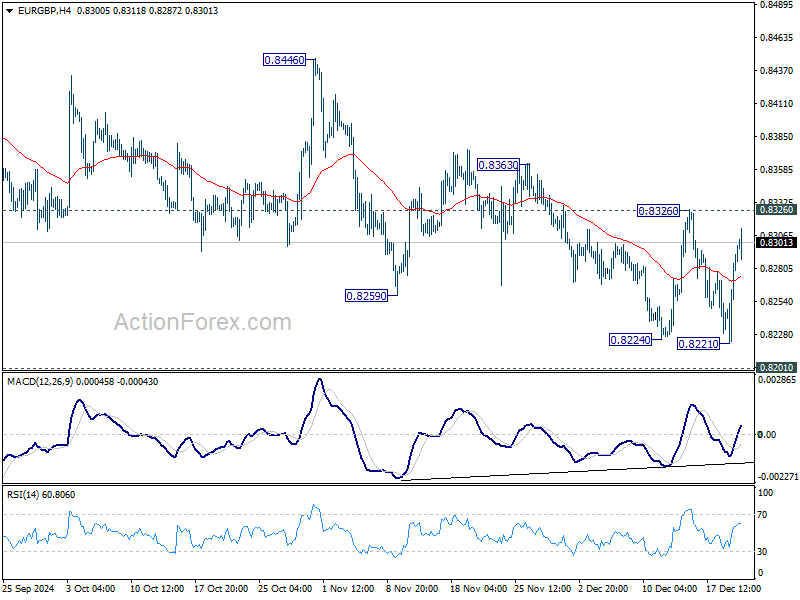
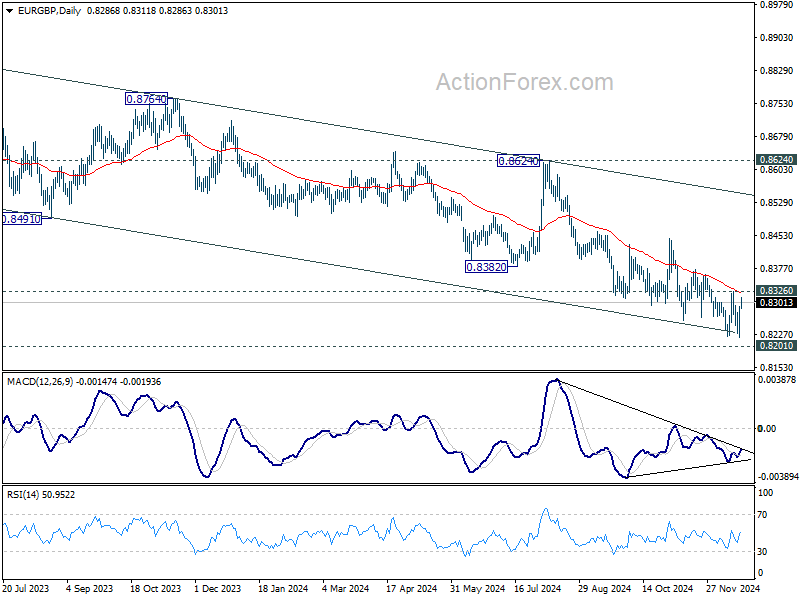
EUR/GBP Daily Outlook
Daily Pivots: (S1) 0.8244; (P) 0.8269; (R1) 0.8314; More...
EUR/GBP rebounded strongly again ahead of 0.8201 key support and intraday bias is turned neutral. On the upside, break of 0.8326 resistance will indicate short term bottoming, on bullish convergence condition in 4H MACD. Intraday bias will be turned back to the upside for 0.8446 structural resistance next.
In the bigger picture, focus is now on whether 0.8201 key support (2022 low) is strong enough to complete the whole down trend from 0.9267 (2022 high). In any case, medium term outlook will be neutral at best until decisive break of 0.8624 key resistance. Otherwise, risk will stay on the downside even in case of strong rebound.
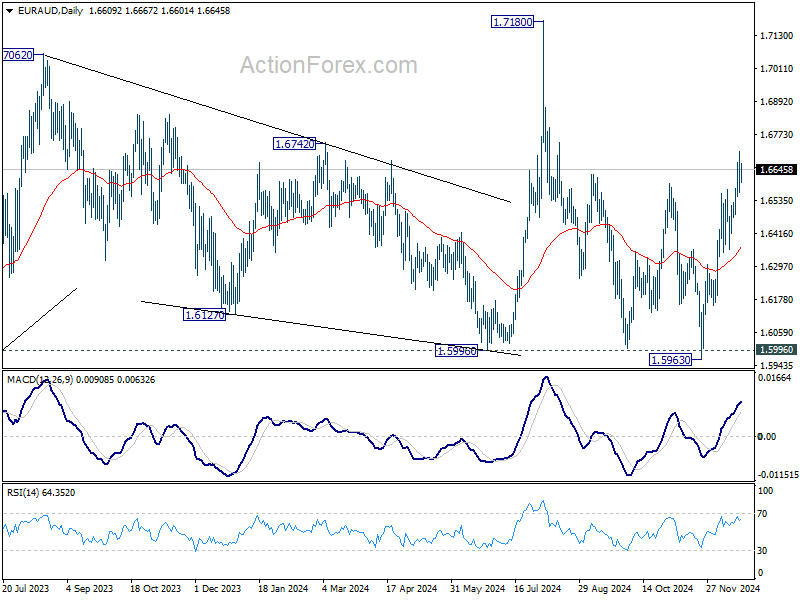
EUR/AUD Daily Outlook
Daily Pivots: (S1) 1.6547; (P) 1.6631; (R1) 1.6696; More...
Breach of 1.6579 minor support suggests temporary topping at 1.6712 and intraday bias in EUR/AUD is turned neutral. Some consolidations would be seen first. On the upside, break of 1.6712 will resume the rally from 1.5693 to retest 1.7180 high next.
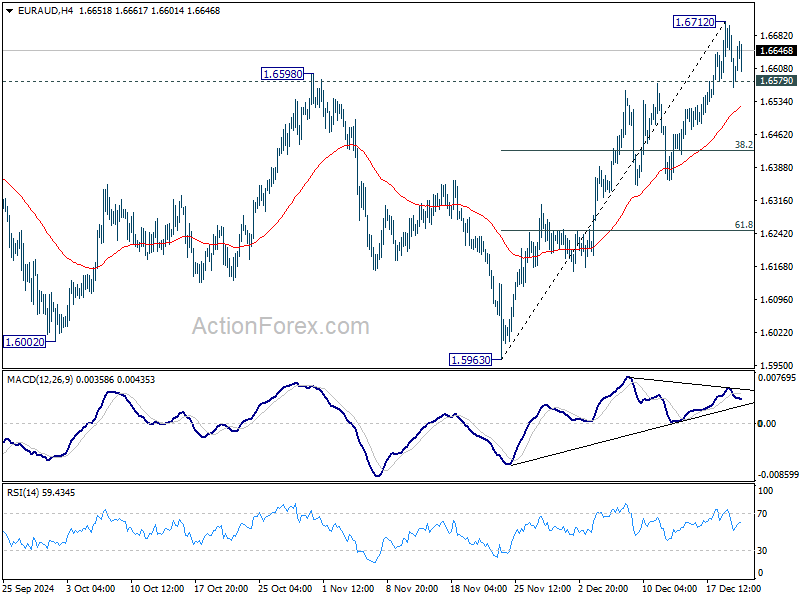
In the bigger picture, EUR/AUD is holding on to 1.5996 key support despite brief breach. Larger up trend from 1.4281 (2022 low) is still in favor to resume through 1.7180 at a later stage. Nevertheless, sustained break of 1.5995 will indicate that such up trend has completed. Deeper decline would be seen to 61.8% retracement of 1.4281 to 1.7180 at 1.5388, even as a correction.
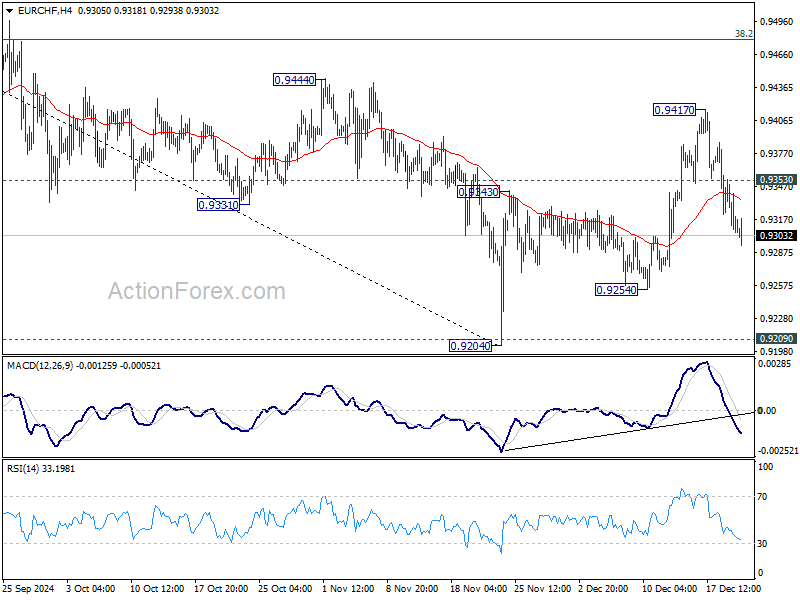
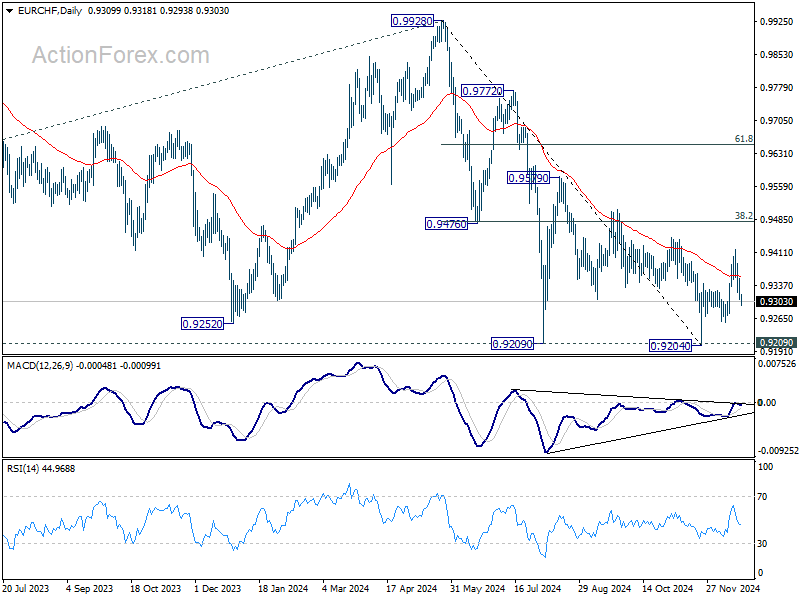
EUR/CHF Daily Outlook
Daily Pivots: (S1) 0.9296; (P) 0.9325; (R1) 0.9344; More....
Intraday bias in EUR/CHF remains on the downside for the moment. Corrective rebound from 0.9204 could have completed with three waves up to 0.9417. Deeper fall would be seen to 0.9254 support first. Firm break there will bring deeper fall to 0.9209 key support again. On the upside, above 0.9353 minor resistance will turn intraday bias neutral first.
In the bigger picture, a medium term bottom is probably in place at 0.9204. More consolidations would be seen above there with risk of stronger rebound to 38.2% retracement of 0.9928 to 0.9204 at 0.9481. But outlook will remain bearish as long as 0.9481 holds and another fall through 0.9204 to resume larger down trend is in favor.
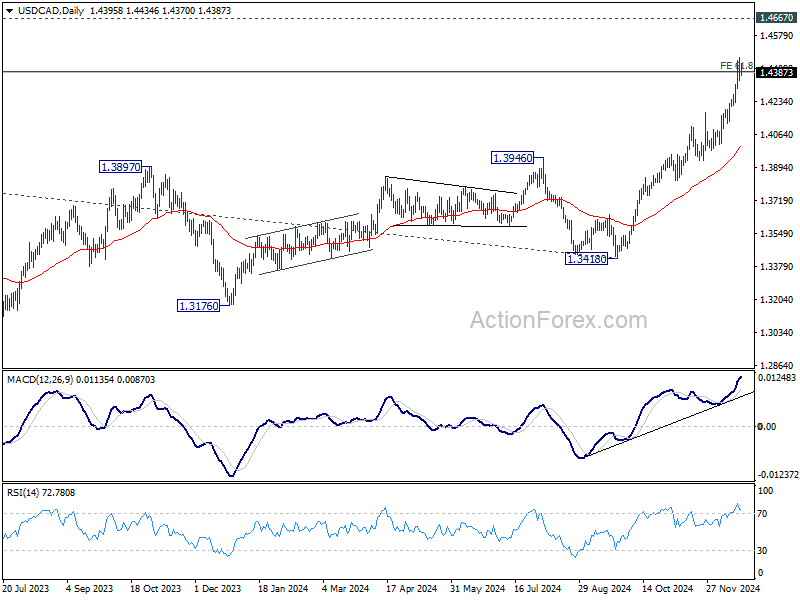
USD/CAD Daily Outlook
Daily Pivots: (S1) 1.4341; (P) 1.4404; (R1) 1.4463; More...
Intraday bias in USD/CAD stays on the upside at this point. Current rally is part of the larger up trend. Sustained trading above 1.4391 projection level will pave the way to 1.4667 long term resistance. On the downside, below 1.4304 minor support will turn intraday bias neutral and bring consolidations first.
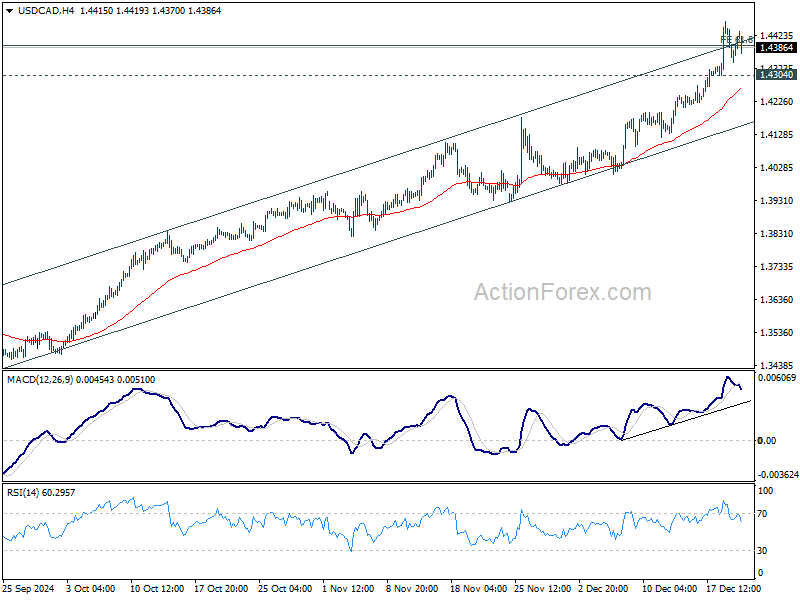
In the bigger picture, up trend from 1.2005 (2021) is in progress and met 61.8% projection of 1.2401 to 1.3976 from 1.3418 at 1.4391 already. Sustained trading above there will pave the way to 1.4667/89 key resistance zone (2020/2015 highs). Medium term outlook will remain bullish as long as 55 W EMA (now at 1.3706) holds, even in case of deep pullback.
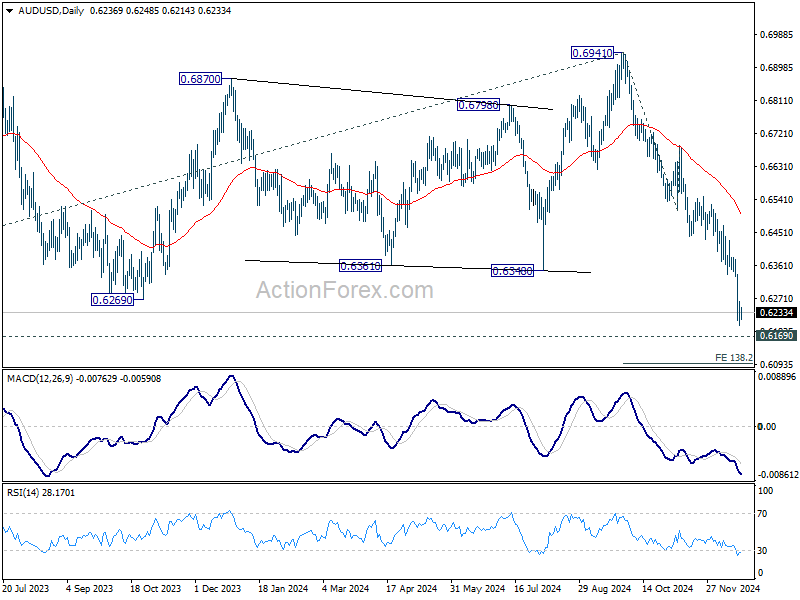
AUD/USD Daily Report
Daily Pivots: (S1) 0.6203; (P) 0.6234; (R1) 0.6269; More...
Intraday bias in AUD/USD remains on the downside for the moment as fall from 0.6941 is still in progress. Firm break of 0.6169 key support will confirm larger down trend resumption. Next near term target is 138.2% projection of 0.6941 to 0.6511 from 0.6687 at 0.6074. On the upside, above 0.6298 minor resistance will turn intraday bias neutral first.
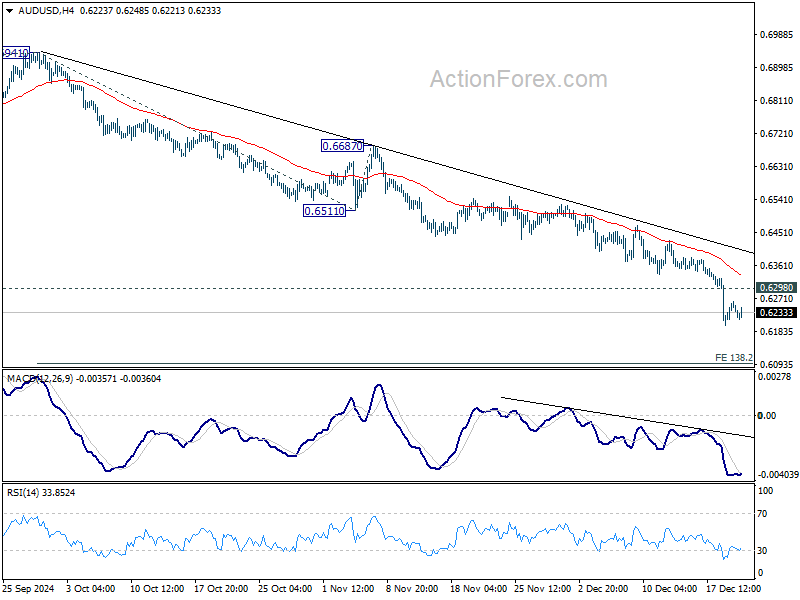
In the bigger picture, price actions from 0.6169 (2022 low) are seen as a medium term consolidation to the down trend from 0.8006. More sideway trading could be seen above 0.6169, but overall outlook will stay bearish as long as 0.6941 resistance holds. Firm break of 0.6169 will resume the down trend to 61.8% projection of 0.8006 to 0.6169 from 0.6941 at 0.5806 next.