
Sample Category Title
May Stays (For Now) Due To Brexit Uncertainties
Theresa May stays as PM throughout Brexit negotiations
Theresa May's meeting with the influential 1922 committee yesterday went very well, as she left the meetings with applause. Theresa May told Conservative MPs that she will get the party out of the ‘mess' she created by calling for the snap election. She admitted mistakes were made during the campaign and that she was sorry for colleagues losing their seats.
May said she will stay as Prime Minister as long as the party wants her to – senior Conservative MPs said they will keep her at least until the UK formally exits the EU by the end of March 2019. The reason is that the 1922 committee does not want to increase political uncertainty further by throwing the party into a new leadership contest – political uncertainty is already high as the Brexit clock is ticking (March 2019 is a sharp deadline). Also, some of the MPs fear losing further seats in an early election.
Apparently, Gavin Barwell, a moderate Conservative and May's new Chief of Staff, received a very warm welcome by the committee.
Queen's speech postponed as no deal with DUP is reached yet
The Queen's Speech (a speech held by the Queen but written by the government laying out its legislative agenda for the election term) is postponed, as no deal between Theresa May and the Democratic Unionist Party (DUP) has been reached yet.
Brexit negotiations were set to start on Monday but they are likely to be postponed to later in June. There are hints that the UK will now accept the phased approach (first discuss the withdrawal terms, then the future relationship). Despite the wish for a softer Brexit from Scottish Conservatives (single market access more important than curbing immigration), Brexit Secretary David Davis has indicated that the government will proceed with its hard Brexit approach.
We still think it is difficult to say what the UK election result means in terms of Brexit. No doubt the minority government is weak, as it only has a few seats majority including DUP seats. Also, Theresa May remains weak despite her support at the meeting in the 1922 committee. It seems like the probability of both a softer Brexit and a clash/no deal Brexit have increased (so basically more probability mass in the two tails) and it will be important to follow how the negotiations proceed when they start later this month (not least how the perception is in the UK). The front page of The Telegraph suggests that Labour and the Conservatives may try to cooperate to get a softer Brexit (see tweet). A deal between the two parties will make it more likely for a deal to pass Parliament, but the two parties are not used to cooperating on big political issues.
UK Inflation Data Eyed Ahead Of BoE Thursday
- Europe rebounds after tech sell-off and UK election weighs on indices;
- UK CPI key ahead of Thursday's BoE decision;
- UK politics continues to drag on GBP which looks vulnerable to further downside.
European equity markets are expected to bounce back after a disappointing start to the week, with futures pointing to a slightly higher open on Tuesday.
The quiet start to the week in terms of news flow and economic data combined with the UK election result didn't provide much reason for optimism on Monday, although it was the sell-off in tech that appeared to be the greatest drag. Whether this is a temporary correction in a sector that has performed extraordinarily this year or something more is yet to be seen but nothing suggests to me that the latter is the case.
While the bulk of this week's key events kick of tomorrow with the Federal Reserve announcing its latest monetary policy decision – and most likely its second rate hike of the year – there are some notable releases today that could shake things up a little. UK CPI inflation for May will certainly be of interest ahead of Thursday's monetary policy decision, even if any change in interest rates appears extremely unlikely.
Given the political uncertainty hanging over the UK as it prepares to begin Brexit negotiations with the EU, it seems very unlikely that policy makers would deem it an appropriate time to add a rate hike into the equation unless it deemed it absolutely necessary. It's given the impression in the past that it's willing to look beyond any minor overshoots in inflation driven by a weaker currency and higher oil prices but with headline inflation seen remaining at 2.7% and core at 2.4%, you have to wonder how much more they'll stomach. Any surprise increases could give policy makers something to think about in the months ahead.
The political situation in the UK will likely remain at the forefront of people's minds today. While Prime Minister Theresa May appears determined to move past the humiliation of election night and get on with forming a government and beginning Brexit negotiations, and many lawmakers appear to support her in public at least, I think there's some way to go before people believe the country has anything that resembles stable leadership. While that uncertainty hangs over the country, the pound may continue to look vulnerable as it lingers around its post-election lows. A break below 1.26 against the dollar could trigger another decline in the pair, with 1.24 perhaps being its next notable level.
Forex Technical Analysis: EUR/USD, USD/JPY, GBP/USD
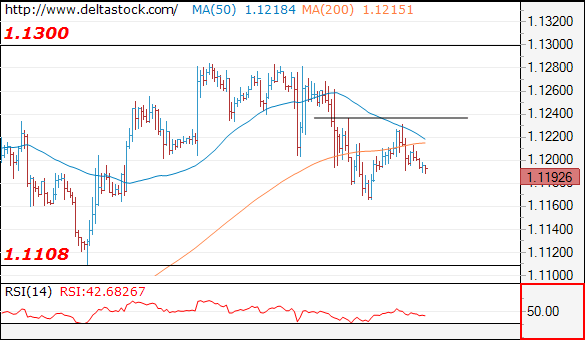
EUR/USD
Current level - 1.1192
The outlook here is negative below 1.1240 resistance, for a slide towards 1.1108 low.
| Resistance | Support | ||
| intraday | intraweek | intraday | intraweek |
| 1.1240 | 1.1360 | 1.1165 | 1.1022 |
| 1.1300 | 1.1610 | 1.1109 | 1.0838 |
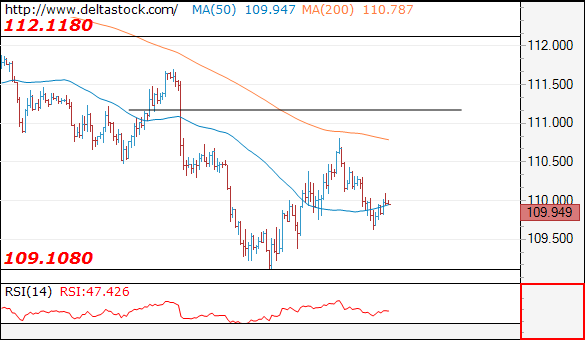
USD/JPY
Current level - 109.94
The intraday hurdle at 110.15 still caps the upside and the latter should provoke another slide towards 109.40 area.
| Resistance | Support | ||
| intraday | intraweek | intraday | intraweek |
| 110.15 | 112.10 | 109.65 | 109.08 |
| 110.80 | 114.30 | 109.08 | 108.12 |
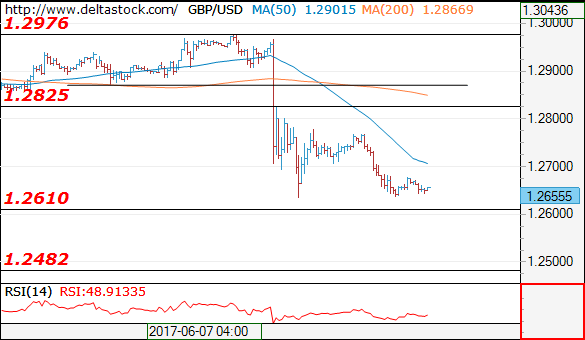
GBP/USD
Current level - 1.2655
The outlook is bearish, as the pair is struggling above 1.2610 major support area. A break through the latter will signal a dip to 1.2480. Initial intraday resistance lies at 1.2710.
| Resistance | Support | ||
| intraday | intraweek | intraday | intraweek |
| 1.2710 | 1.2970 | 1.2610 | 1.2610 |
| 1.2830 | 1.3050 | 1.2530 | 1.2480 |
Crude Oil Faces A Declining Channel
Key Points:
- Crude oil trending within a relatively strong bearish channel.
- Price action has discovered some support and RSI is now trending higher.
- Watch for a breakout of the descending channel in the week ahead.
Global crude oil prices have seen plenty of volatility over the past month as the commodity has faced a variety of fundamental and technical pressures. In particular, an ongoing schism between Qatar and Saudi Arabia kicked off mounting speculation that the OPEC production cut agreement could be in trouble following sanction levying. Subsequently, WTI prices have dived of late with the oil benchmark having recently reached a low at $45.19 before rising to trade around its current level at $46.25 a barrel. However, it remains to be seen if crude prices can maintain some buoyancy in the face of a strongly descending channel.
Taking a look at the commodities current technical factors shows the decision that the market is presently facing. WTI's price action has been relatively strongly depressed over the past few weeks and has been, subsequently, trending lower within a strongly bearish channel. However, the commodity appears to have bounced back from a recent low and the RSI Oscillator is now rising away from oversold levels.
Regardless, crude oil is likely facing an uphill battle given the strength of the descending channel and the fundamental bearishness that is swirling around the commodity. However, on a brighter note, the recent low at $45.19 occurred within a key reversal area and price action is now trending towards the upper channel constraint. Subsequently, if crude prices can break above the $46.75 mark we are likely to see some gains back towards the $48.00 handle.
In fact, there are already some fundamentally bullish moves occurring with the latest U.S. Inventory figures showing declines and news that Sinopec (amongst other nations) is considering output drops to curb the current glut. In addition, lower Saudi exports are likely to have an impact on global markets in the coming week which adds to the sense that we may see a fundamental rise in prices.
Ultimately, there is still plenty of selling present and an ongoing bearish appetite for the commodity. However, it appears we might have currently plumbed the short term lows and the most likely scenario is now a move to the upside and towards $48.00 a barrel in the coming days. Therefore, monitor the WTI prices closely for a break above the descending channel to signal the start of the move.
Loonie In For A Choppy Few Weeks
Key Points:
- Long-term trend line is now in danger of being broken.
- A head and shoulders pattern is becoming apparent.
- Rate hike expectations could assist the near-term recovery.
The Loonie took a rather spectacular, if unexpected, plunge last week which has taken the pair back below its 100 day EMA. This has cast some doubt on earlier expectations of continued upsides and might even suggest that the long-term ascending trend line is in danger of being broken. However, the bulls out there shouldn't be too worried just yet as it looks as though we may have to wait some time for such a breakout to occur.
As shown below, whilst selling pressure has been notably intense – thereby raising concerns of a downside breakout – we still have some ways to go before the long-term trend is in danger of ending. Indeed, we may actually see a reversal quite shortly as a result of both the stochastics moving into oversold and the presence of a historical reversal zone. Regardless, even if we do see such a shift in momentum, we can't quite rule out seeing a breakout within the next few weeks.
Specifically, a reversal within the next session or two would suggest that the Loonie is well on the way to forming a long-term head and shoulders structure. Of course, we would likely need to see the pair recover to around the 1.3515 handle before really committing to the forecast but a rally up to this level is not entirely unreasonable given the chances of us seeing a US rate hike in the near-term.
If we do end up seeing the above forecasted recovery, the subsequent decline could be rather substantial. Firstly, the USDCAD could fall as low as the 1.3290 mark before even running into support courtesy of that long-term trend line as there is little in the way of support prior to this point. Nevertheless, this may only be half of the story as losses may even extend somewhere into the realm of the 1.30 handle. However, this would require breaking through the trend line which may require some bearish fundamentals.
Ultimately, the Loonie could be in for a bit of a bumpy ride in the coming weeks which could even result in the bears upending a yearlong trend. However, watch out for a near-term recovery before jumping into bed with those looking to send the Loonie lower as they may be hamstrung by rate hike speculation moving forward. Furthermore, pay particular attention to the technical readings as the pair moves to complete the final leg of the right shoulder as these could determine whether or not we see the final push back to the 1.30 handle or not.
Australia’s NAB Business Confidence Deteriorated In May
For the 24 hours to 23:00 GMT, the AUD rose 0.19% against the USD and closed at 0.7544.
LME Copper prices rose 0.2% or $13.0/MT to $5752.0/MT. Aluminium prices declined 0.7% or $13.5/MT to $1888.0/MT.
In the Asian session, at GMT0300, the pair is trading at 0.7559, with the AUD trading 0.2% higher against the USD from yesterday's close.
Early morning data indicated that Australia's NAB business confidence index sharply dropped to a level of 7.0 in May, following a reading of 13.0 in the prior month. Moreover, the nation's NAB business conditions index eased to a level of 12.0 in May, compared to a level of 13.0 in the prior month.
The pair is expected to find support at 0.7532, and a fall through could take it to the next support level of 0.7506. The pair is expected to find its first resistance at 0.7575, and a rise through could take it to the next resistance level of 0.7592.
Going ahead, traders will keep a close watch on Australia's Westpac consumer confidence index for June, scheduled to release overnight.
The currency pair is trading above its 20 Hr and 50 Hr moving averages.

Euro Trading Lower, Ahead Of The ZEW Survey Data Across The Euro-Zone
For the 24 hours to 23:00 GMT, the EUR traded flat against the USD and closed at 1.1201.
In economic news, French business sentiment index remained unchanged at a level of 105.0 in May, at par with market expectations.
Separately, Italy's seasonally adjusted industrial production unexpectedly eased 0.4% on a monthly basis in April, defying market expectations for an advance of 0.2%. In the prior month, industrial production had registered a rise of 0.4%.
Macroeconomic data indicated that the US posted a budget deficit of $88.4 billion in May, while markets expected the nation to post a deficit of $87.0 billion. In the previous month, the nation had posted a budget surplus of $182.4 billion.
In the Asian session, at GMT0300, the pair is trading at 1.1194, with the EUR trading 0.06% lower against the USD from yesterday's close.
The pair is expected to find support at 1.1179, and a fall through could take it to the next support level of 1.1163. The pair is expected to find its first resistance at 1.1221, and a rise through could take it to the next resistance level of 1.1247.
Moving ahead, all eyes will be on the release of ZEW economic sentiment index for June across the Euro-zone, scheduled in a few hours. Additionally, the US NFIB small business optimism index for May, will attract market attention.
The currency pair is trading below its 20 Hr and 50 Hr moving averages.

Election Result Threatens UK’s Credit Rating: Moody’s And S&P
For the 24 hours to 23:00 GMT, the GBP declined 0.58% against the USD and closed at 1.2669, as investors were still spooked by the outcome of last week's snap election in the UK that resulted in a hung parliament.
Losses in the Pound deepened, after two of the most influential ratings agencies, Moody's and S&P, warned that the inconclusive outcome of Britain's snap election will probably delay Brexit negotiations and may also result in credit rating downgrade.
Meanwhile, the British Prime Minister, Theresa May, was seeking a deal with a small Northern Ireland's Democratic Unionist Party (DUP) in order to overcome the problems of a hung parliament.
In the Asian session, at GMT0300, the pair is trading at 1.2653, with the GBP trading 0.13% lower against the USD from yesterday's close.
The pair is expected to find support at 1.2605, and a fall through could take it to the next support level of 1.2556. The pair is expected to find its first resistance at 1.2736, and a rise through could take it to the next resistance level of 1.2818.
Ahead in the day, market participants will focus on UK's crucial inflation figures for May.
The currency pair is trading below its 20 Hr and 50 Hr moving averages.

Japanese Yen Trading Lower This Morning
For the 24 hours to 23:00 GMT, the USD declined 0.39% against the JPY and closed at 109.85.
On the data front, Japan’s flash machine tool orders rose 24.4% on an annual basis in May, after recording a gain of 34.7% in the prior month.
In the Asian session, at GMT0300, the pair is trading at 109.98, with the USD trading 0.12% higher against the JPY from yesterday’s close.
Overnight data indicated that Japan’s BSI large manufacturing index fell to a level of -2.9 in 2Q 2017. The index had climbed 1.1 in the previous quarter.
The pair is expected to find support at 109.63, and a fall through could take it to the next support level of 109.29. The pair is expected to find its first resistance at 110.32, and a rise through could take it to the next resistance level of 110.67.
Going ahead, investors will await the release of Japan’s industrial production for April, scheduled tomorrow.
The currency pair is trading between its 20 Hr and 50 Hr moving averages.

Swiss Franc Trading On A Weaker Footing In The Asian Session
For the 24 hours to 23:00 GMT, the USD marginally declined against the CHF and closed at 0.9688.
In economic news, Switzerland’s total sight deposits inched up to a level of CHF576.4 billion in the week ended 09 June, from CHF576.1 billion recorded in the previous week.
In the Asian session, at GMT0300, the pair is trading at 0.9694, with the USD trading 0.06% higher against the CHF from yesterday’s close.
The pair is expected to find support at 0.9677, and a fall through could take it to the next support level of 0.9659. The pair is expected to find its first resistance at 0.9705, and a rise through could take it to the next resistance level of 0.9715.
The currency pair is trading above its 20 Hr moving average and showing convergence with its 50 Hr moving average.
