

Sample Category Title
Loonie Extends Its Gains In The Morning Session
For the 24 hours to 23:00 GMT, the USD declined 0.94% against the CAD and closed at 1.3319.
The Canadian Dollar gained ground, after hawkish comments by a senior Bank of Canada (BoC) official sparked hopes that the BoC could move to raise its benchmark interest rates for the first time in nearly seven years.
The BoC's Senior Deputy Governor, Carolyn Wilkins, stated that Canadian first-quarter growth was “pretty impressive” and would lead the central bank to consider whether current low rates would still be required.
In the Asian session, at GMT0300, the pair is trading at 1.329, with the USD trading 0.22% lower against the CAD from yesterday's close.
The pair is expected to find support at 1.3219, and a fall through could take it to the next support level of 1.3149. The pair is expected to find its first resistance at 1.3415, and a rise through could take it to the next resistance level of 1.3541.
In absence of any major economic releases in Canada today, trading trend in the CAD is expected to be determined by global macroeconomic news.
The currency pair is trading below its 20 Hr and 50 Hr moving averages.

Daily Technical Outlook And Review: EUR/USD, GBP/USD, AUD/USD, USD/JPY, USD/CAD, USD/CHF, DOW 30, GOLD
A note on lower timeframe confirming price action...
Waiting for lower timeframe confirmation is our main tool to confirm strength within higher timeframe zones, and has really been the key to our trading success. It takes a little time to understand the subtle nuances, however, as each trade is never the same, but once you master the rhythm so to speak, you will be saved from countless unnecessary losing trades. The following is a list of what we look for:
- A break/retest of supply or demand dependent on which way you're trading.
- A trendline break/retest.
- Buying/selling tails ... essentially we look for a cluster of very obvious spikes off of lower timeframe support and resistance levels within the higher timeframe zone.
- Candlestick patterns. We tend to only stick with pin bars and engulfing bars as these have proven to be the most effective.
We typically search for lower-timeframe confirmation between the M15 and H1 timeframes, since most of our higher-timeframe areas begin with the H4. Stops are usually placed 1-3 pips beyond confirming structures.
EUR/USD
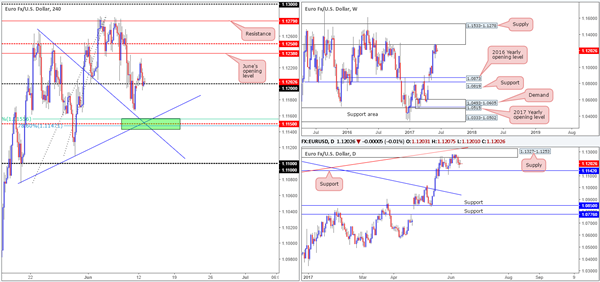
Using a top-down approach this morning, we can see that the single currency remains trading around the underside of a major weekly supply at 1.1533-1.1278. Managing to cap upside since May 2015, this is certainly not an area one should overlook. Looking down to the daily timeframe, however, the candles are now seen sandwiched between supply coming in at 1.1327-1.1253 and support pegged at 1.1142.
Swinging over to the H4 timeframe, the buyers and sellers are currently battling for position around the 1.12 handle. Directly overhead we have June’s opening level at 1.1238, followed closely by the mid-level resistance at 1.1250. Below 1.12, there’s little support until price connects with the mid-level barrier at 1.1150.
Our suggestions: Based on the above notes our desk has shown interest around the 1.1150 neighborhood, due to the base converging with the following structures (green area):
- A H4 trendline support taken from the high 1.1268.
- A H4 trendline support etched from the low 1.1075.
- A H4 61.8% Fib support at 1.1155 drawn from the low 1.1074.
- A H4 78.6% retracement level pegged at 1.1147 penciled in from the low 1.1109.
- A daily support level seen at 1.1142.
Seeing as how this zone is rather small, we will not be placing pending buy orders here. Instead, we’ve chosen to wait for a reasonably sized H4 bull candle to form, preferably a full-bodied candle. This will help prove buyer interest exists here which IS needed due to where price is trading from on the weekly chart right now.
Data points to consider: German ZEW economic sentiment at 10am. US PPI at 1.30pm GMT+1.
Levels to watch/live orders:
- Buys: 1.1150 region ([waiting for a reasonably sized H4 bull candle – preferably a full-bodied candle – to form before pulling the trigger is advised] stop loss: ideally beyond the candle’s tail).
- Sells: Flat (stop loss: N/A).
GBP/USD
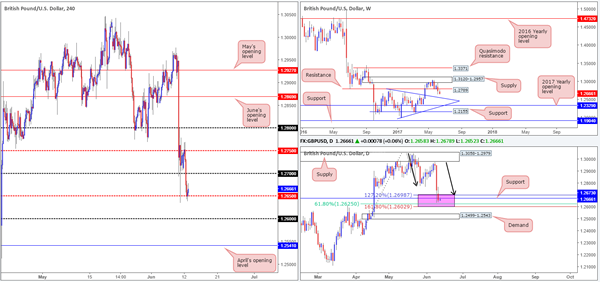
Beginning with the daily timeframe this morning, we’ve underlined a particularly interesting zone marked in pink. Comprised of a support level coming in at 1.2673, a 61.8% Fib support at 1.2625 (taken from the low 1.2365) and an AB=CD (black arrows) 127.2/161.8% ext. completion point seen at 1.2602/1.2698 (drawn from the high 1.3047), this is a possible zone of interest for the bulls. Below the area, nonetheless, is a demand located at 1.2499-1.2543, which happens to intersect beautifully with a weekly trendline support taken from the high 1.2774.
As we write, the H4 candles are bouncing off the mid-level support at 1.2650. This hurdle held nicely on Friday, despite the market’s bearish tone following the UK elections. Above this level we have the 1.27 handle, while below we see the 1.26 level (1.26 essentially denotes the lower edge of the daily zone highlighted above).
Our suggestions: This is a challenging market to trade at the moment. On the one hand we have the daily picture indicating that buying could be on the cards, and on the other hand the weekly chart shows room to move beyond the daily zone. So therefore, it’s hard to place trust in the H4 mid-level support at 1.2650 for a long trade.
Data points to consider: UK inflation figures at 9.30am. US PPI at 1.30pm GMT+1.
Levels to watch/live orders:
- Buys: Flat (stop loss: N/A).
- Sells: Flat (stop loss: N/A).
AUD/USD
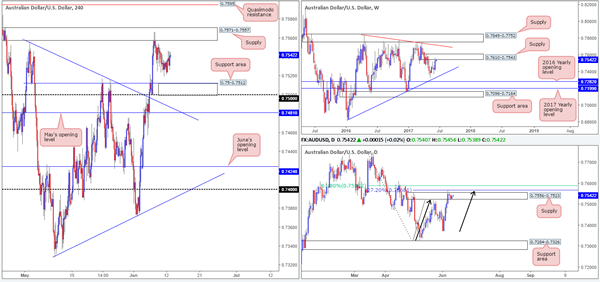
In view of weekly price recently shaking hands with supply coming in at 0.7610-0.7543, the sellers could very well make an appearance from here this week. In conjunction with weekly flow, daily action also recently whipsawed above supply formed at 0.7556-0.7523 and touched base with an AB=CD 127.2% completion point (see black arrows) at 0.7568 (taken from the low 0.7328). This move likely took out a truckload of buy stops from above the said supply and thus provided enough liquidity for the big boys to sell into.
Moving across to the H4 candles, price failed to reconnect with the support area formed at 0.75/0.7512 on Friday and instead found active bids nearby the 0.7520 neighborhood. With the higher timeframes indicating lower prices are likely on the cards, the supply base at 0.7571-0.7557 has been noted as a possible sell zone today given how well it held last week.
Our suggestions: Although the H4 zone essentially has the backing of higher-timeframe supplies, we would still highly recommend waiting for the H4 candles to show seller interest before pulling the trigger (a full-bodied bearish candle would be ideal). The first take-profit target, assuming a trade comes to fruition, would be the aforementioned H4 support zone.
Data points to consider: US PPI at 1.30pm GMT+1.
Levels to watch/live orders:
- Buys: Flat (stop loss: N/A).
- Sells: 0.7571-0.7557 ([waiting for a reasonably sized H4 bear candle – preferably a full-bodied candle – to form before pulling the trigger is advised] stop loss: ideally beyond the candle’s wick).
USD/JPY
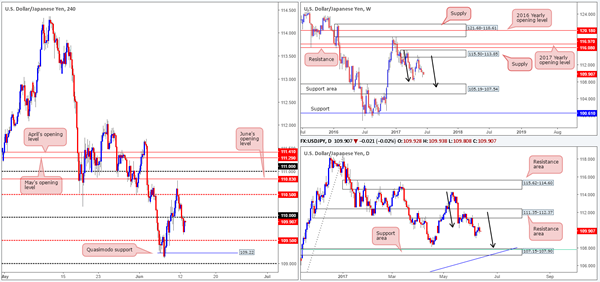
Weekly bears continue to remain in a relatively strong position after pushing aggressively lower from supply registered at 115.50-113.85. We know there’s a fair bit of ground to cover here, but this move could possibly result in further downside taking shape in the form of a weekly AB=CD correction (see black arrows) that terminates within a weekly support area marked at 105.19-107.54 (stretches all the way back to early 2014). In conjunction with weekly flow, daily price also shows a potential AB=CD correction in the works taken from the high 114.36, which could see price drive lower to 107.15-107.90: a support zone that’s glued to the top edge of the said weekly support area.
With the bigger picture in mind, the only thing we see of interest on the H4 timeframe at the moment is a short trade on any retest at the 110 handle.
Our suggestions: To prove seller interest around the 110 vicinity, however, we would advise waiting for a reasonably sized H4 bearish candle to take shape, preferably a full-bodied candle.
Data points to consider: US PPI at 1.30pm GMT+1.
Levels to watch/live orders:
- Buys: Flat (stop loss: N/A).
- Sells: 110 region ([waiting for a reasonably sized H4 bear candle – preferably a full-bodied candle – to form before pulling the trigger is advised] stop loss: ideally beyond the candle’s wick).
USD/CAD
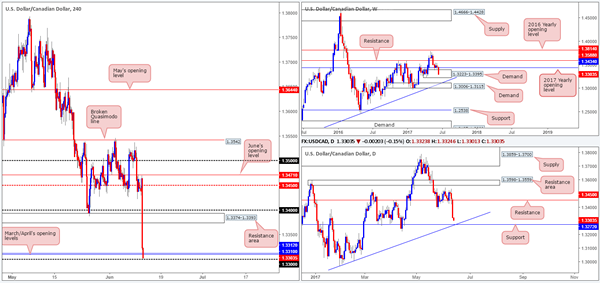
In recent hours, we’ve seen the USD/CAD plummet, with little to no reaction seen over in the oil market. At the time of writing, H4 price is trading around March/April’s opening levels at 1.3310/1.3312 and the 1.33 handle. Should the bears continue to push south, the next downside target in range is the H4 support base coming in at 1.3263. Located nearby is also a daily support level pegged at 1.3272 that intersects beautifully with a trendline support etched from the low 1.2968. Also of interest is the weekly demand at 1.3223-1.3395. Although the zone is under pressure at the moment, there’s still a chance, technically speaking, that bids will hold this area steady.
Our suggestions: Given the bearish momentum in play right now, we feel it will not be too long before the H4 support level mentioned above at 1.3263 is in view. With this line being positioned deep within the current weekly demand and being located so close to daily support at 1.3272, our team will be looking to buy this market from this region.
Data points to consider: US PPI at 1.30pm GMT+1.
Levels to watch/live orders:
- Buys: 1.3263 region ([waiting for a reasonably sized H4 bull candle – preferably a full-bodied candle – to form before pulling the trigger is advised] stop loss: ideally beyond the candle’s tail).
- Sells: Flat (Stop loss: N/A).
USD/CHF
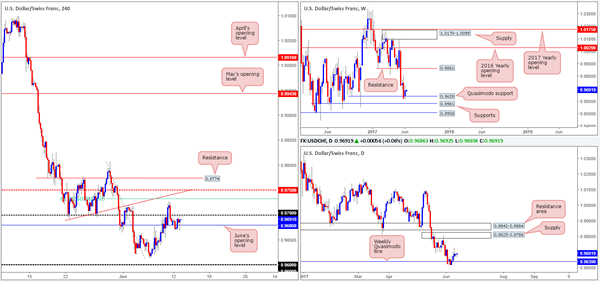
USD/CHF prices are effectively unchanged this morning, with the unit spending the majority of yesterday seesawing around June’s opening level at 0.9680. Before one can look ahead, however, there’s not only the nearby 0.97 handle to contend with, but also a H4 61.8% Fib resistance plugged at 0.9732, followed closely by the H4 mid-level resistance at 0.9750.
Having seen the weekly Quasimodo support level at 0.9639 hold steady, this could encourage further buying in this market, at least until we reach the daily supply pegged at 0.9825-0.9786.
Our suggestions: Despite the higher timeframes indicating that further buying may be at hand, the H4 chart, as we pointed out above, is just a minefield of resistances at the moment! Therefore, we have come to the conclusion that remaining on the sidelines may be the better bet for now.
Data points to consider: US PPI at 1.30pm GMT+1.
Levels to watch/live orders:
- Buys: Flat (stop loss: N/A).
- Sells: Flat (stop loss: N/A).
DOW 30
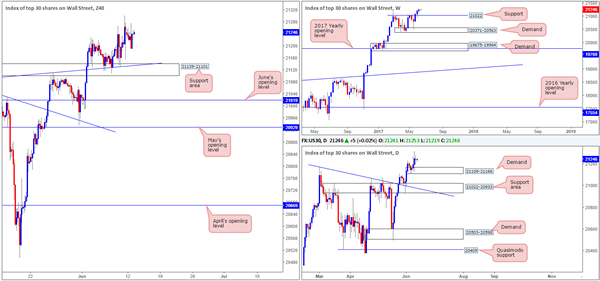
For those who have been following our reports over the past few days you may recall that our desk had recently taken a small long position at 21164 and placed stops below the H4 support area (21139-21101) at 21097. The position is still active, but we have liquidated 50% of the trade around the 21234 neighborhood. We have also reduced risk to breakeven and are now looking for the index to punch to fresh highs sometime this week.
Our suggestions: Essentially, what we’re looking for here is trend continuation. Given that there are no higher-timeframe resistances ahead, we’re looking to trail the remainder of our current position behind H4 supports. Once/if H4 price advances north, we will look to place stops below Monday’s session low (21192) at 21188.
Data points to consider: US PPI at 1.30pm GMT+1.
Levels to watch/live orders:
- Buys: 21164 ([live] stop loss: breakeven).
- Sells: Flat (stop loss: N/A).
GOLD
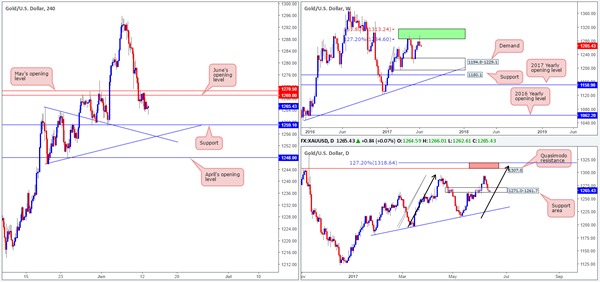
In current trading, June’s opening level at 1269.0, shadowed closely by May’s opening level at 1270.5, did a fantastic job of holding price lower during yesterday’s segment. The next area of interest seen below comes in at 1259.1: a support level that’s located relatively close to two H4 trendline supports (1245.8/1260.0).
Over on the bigger picture, nevertheless, bullion continued to drive lower from an area comprised of two weekly Fibonacci extensions 161.8/127.2% at 1313.7/1285.2 taken from the low 1188.1 (green zone) last week. Bouncing down to the daily timeframe, the support area at 1271.0-1261.7 was recently brought into the picture, and is just showing signs of bullish interest. Having seen this area cap upside nicely between mid-May right up until the end of June, this base is likely to offer support.
Our suggestions: This market is a challenge to trade at the moment with neither a long nor short looking attractive right now. The weekly picture indicates further selling could be upon us, while daily price is trading within a buy zone. All of this coupled with H4 price currently loitering between May and June’s opening levels and the said H4 support, makes this, at least for us, a difficult market to read at this time.
Levels to watch/live orders:
- Buys: Flat (stop loss: N/A).
- Sells: Flat (stop loss: N/A).
Daily Technical Analysis: EUR/USD Building Gradually Reversal But Key Support Remains Intact
Currency pair EUR/USD
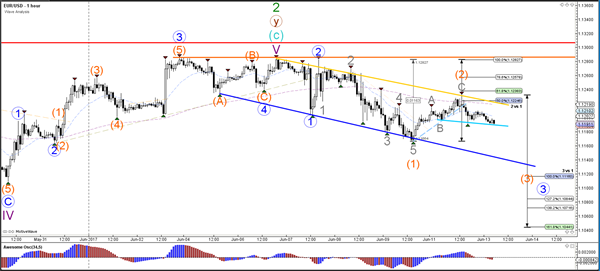
The EUR/USD seems to be slowing turning from an uptrend to a downtrend. A break above the 100% Fib resistance level at 1.13 (red line) however would invalidate the reversal whereas a break below support (blue) would increase the chance of a wave 3 (blue) indeed unfolding.
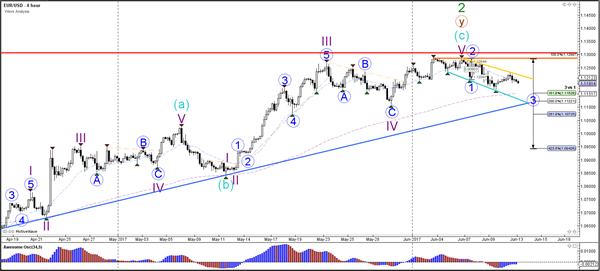
The EUR/USD invalidates wave 2 (orange) if price manages to break above the 100% Fib level.
Currency pair GBP/USD
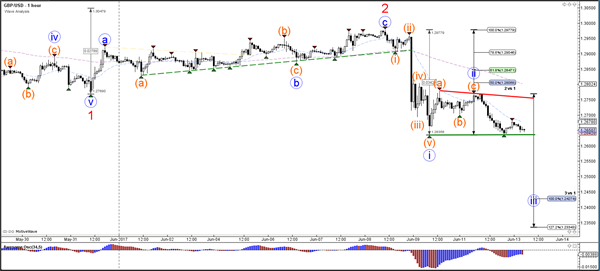
The GBP/USD is now challenging a key support trend line (blue). A bounce in this zone could see an expansion of wave 2 (blue) whereas a bearish breakout could confirm wave 3 (blue/red).
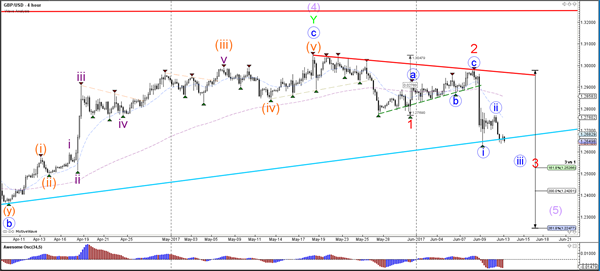
The GBP/USD wave 2 is invalidated if price breaks above the 100% Fibonacci level.
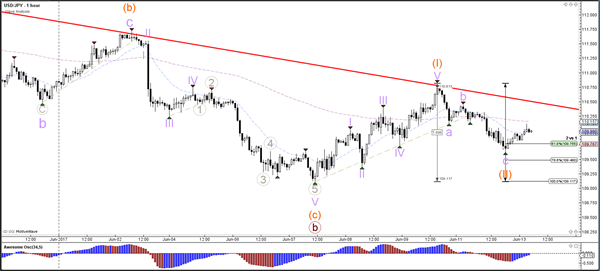
Currency pair USD/JPY
The USD/JPY is testing both support Fibonacci levels of wave 2 (orange) and resistance trend lines (red). A break above resistance could see price challenge the Fibs of wave 3 (orange).
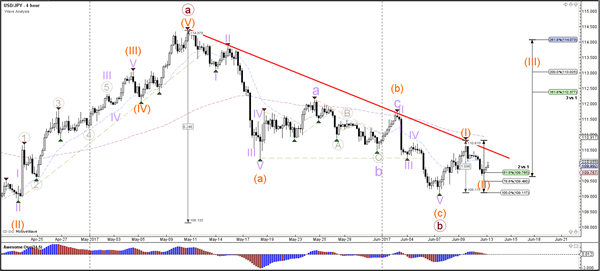
The USD/JPY would invalidate the wave 2 (orange) if price breaks below the 100% Fibonacci level.
European Open Briefing: Asian Stock Markets Recovered Overnight
Global Markets:
- Asian stock markets: Nikkei up 0.05 %, Shanghai Composite gained 0.40 %, Hang Seng rose 0.60 %, ASX 200 rallied 1.15 %
- Commodities: Gold at $1268 (-0.05 %), Silver at $16.86 (-0.50 %), WTI Oil at $46.25 (+0.40 %), Brent Oil at $48.50 (+0.40 %)
- Rates: US 10-year yield at 2.21, UK 10-year yield at 0.96, German 10-year yield at 0.25
News & Data
- Australia NAB Business Confidence 7.0 vs 13.0 previous
- Australia NAB Business Survey 12.0 vs 14.0 previous
- Japan Large Manufacturing Conditions -2.9 vs 1.5 expected
- Asia stocks shake off U.S. tech slump, loonie jumps on rate hike prospect – RTRS
- Dollar steadies ahead of central bank meetings; C$ hits two-month high – RTRS
- Oil edges up on Saudi pledge to make real supply cuts – RTRS
Markets Update:
Asian stock markets recovered overnight, despite the sell-off in Europe and the US yesterday. USD/JPY followed stocks higher, and rose from 109.80 to 110.10. Further consolidation seems likely ahead of the FOMC, with strong resistance at 110.50 and solid support at 109.40/50. Generally, volatility in FX is likely to remain low ahead of the Fed rate decision.
EUR/USD is consolidating around 1.12. The ECB was not really dovish enough last week to push the Euro lower, and the pair remains well bid on dips. The charts suggest further gains are ahead, but much depends on the Fed now.
The British Pound remains under pressure amid the political uncertainty in the UK, and that is unlikely to change soon. After the break below 1.27 support, a move towards 1.25 is likely in the near-term.
The Canadian Dollar rallied yesterday, following surprisingly hawkish comments from a senior Bank of Canada official. USD/CAD is likely to test 1.32 soon. Should it break below that support level as well, the pair will likely reach 1.30 soon.
Upcoming Events:
- 07:00 BST – German WPI
- 09:30 BST – UK CPI
- 10:00 BST – German ZEW Economic Sentiment
- 10:00 BST – Euro Zone ZEW Economic Sentiment
- 13:30 BST – US PPI
- 23:45 BST – New Zealand Current Account
USD/CAD Daily Outlook
Daily Pivots: (S1) 1.3271; (P) 1.3371; (R1) 1.3422; More....
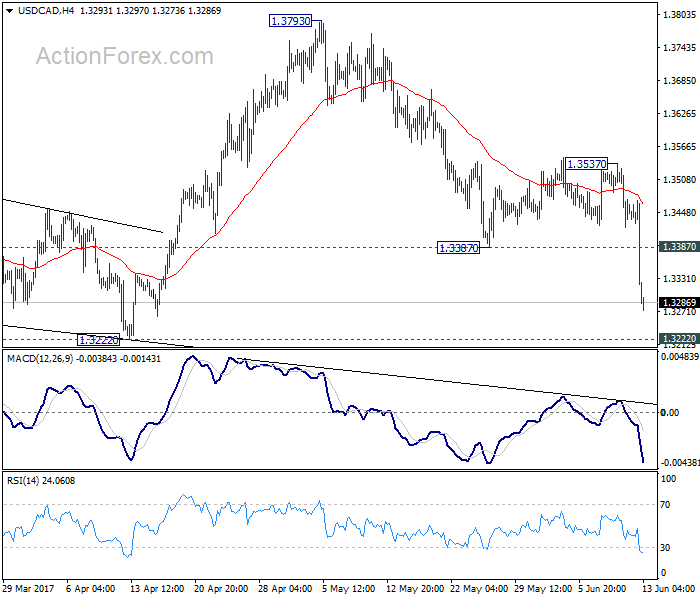
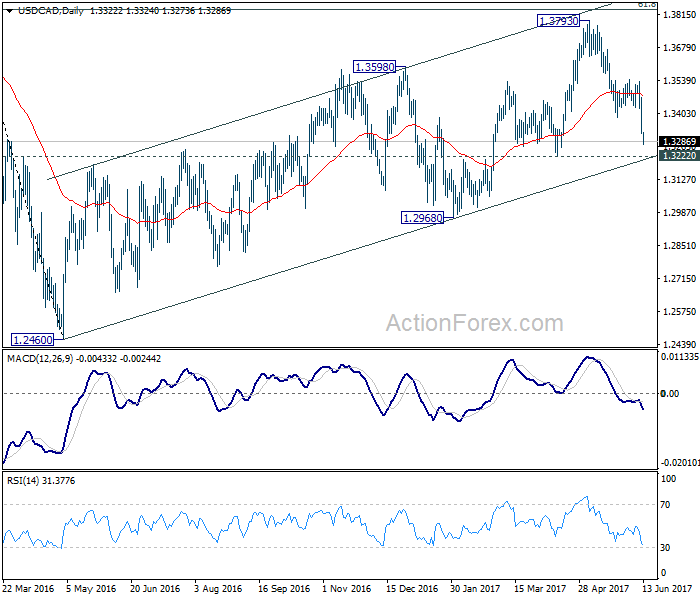
USD/CAD's decline from 1.3793 resumed by taking out 1.3387 and reaches as low as 1.3273 so far. Intraday bias is back on the downside for 1.3222 support next. We'd holding on to the view that whole choppy rise from 1.2460 has completed at 1.3793. Break of 1.3222 will affirm our bearish view and target 1.2968 key support for confirmation. On the upside, above 1.3387 support turned resistance will turn intraday bias neutral. But recovery should be limited well below 1.3537 resistance to bring fall resumption.
In the bigger picture, price actions from 1.4689 medium term top are seen as a correction pattern. The first leg has completed at 1.2460. Rise from 1.2460 is seen as the second leg and could have completed at 1.3793, ahead of 61.8% retracement of 1.4689 to 1.2460 at 1.3838. Break of 1.3222 should indicate the start of the third leg while further break of 1.2968 should confirm. Nonetheless, sustained trading above 1.3838 would pave the way to retest 1.4689 high.
Canadian Dollar Surges as Top BoC Official Signals Next Move is Hike
Canadian Dollar jumps sharply overnight as boosted by comments from a top BoC official that raises prospect of a rate hike. Senior Deputy Governor Carolyn Wilkins said in a speech that adjustment to lower oil prices was "largely behind us" with help of the rate cuts in 2015. And, there are "encouraging signs" of broadening growth across regions and sectors. Meanwhile, there is "significant monetary policy stimulus in the system". And, she noted that "as growth continues and, ideally, broadens further, Governing Council will be assessing whether all of the considerable monetary policy stimulus presently in place is still required." This is seen by the markets as an indication that the door for further rate cut from the current 0.50% is closed. And the next move would be a hike.
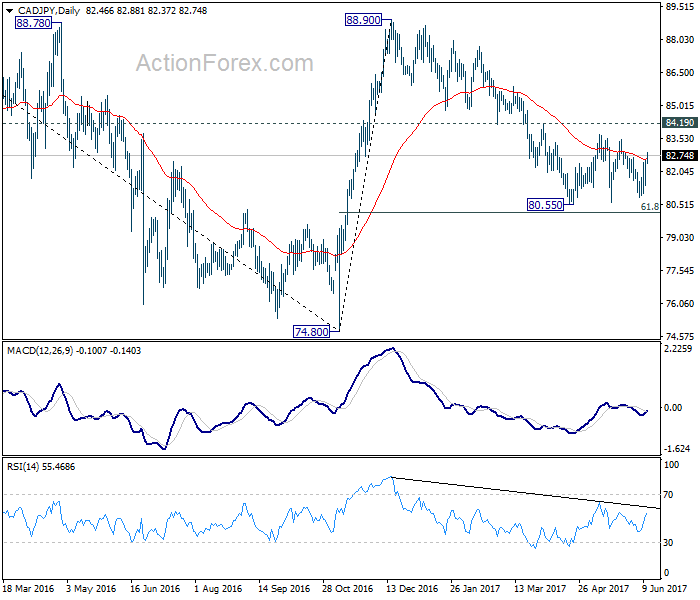
USD/CAD finally resumed recent fall from 1.3793 by breaking 1.3273 so far. The pair should test 1.3222 support in near term. We're favoring the case of medium term reversal in USD/CAD and break of 1.3222 will affirm our view and target 1.2968 support next. EUR/CAD also drops sharply to as low as 1.4856, comparing to this month's high at 1.5257. But EUR/CAD has been rather resilience due to strength in Euro. And outlook in EUR/CAD will stay mildly bullish as long as 1.4823 support holds. CAD/JPY also rebounds strongly but it's held in range above 80.55 short term bottom. Outlook is a bit mixed and we'll stay neutral on the cross first. Break of 81.49 will indicate near term reversal for 88.90. Meanwhile, break of 80.55 will pave the way to test 74.80 low.
US Treasury recommends over 100 changes to financial regulation
In US, the stock markets some what stabilized. NASDAQ dipped initially to as low as 6110.66 but pared back much losses to close at 6175.46, just down -0.52%. DOW closed down -0.17% at 21235.67 while S&P 500 closed down -0.1% at 2429.39. 10 year yield rose slightly by 0.014 to 2.213 but is kept well below near term resistance at 2.297. It is reported that US President Donald Trump's Treasury is calling for scaling back some of the post 2008 financial crisis regulations. A near 150-page report was produced and there were recommendations of over 100 changes to financial rules. But the report stopped short of calling for the repeal of the so called Dodd-Franck financial regulation law, which Trump called a "disaster". Treasury Secretary Steven Mnuchin said that the focus of the report was "what are the things that we can do to unlock burdensome regulations and overlapping regulations and work with the regulators?"
Conservative and Labour in private talks for softer Brexit
In UK, it's reported that Conservative and Labour MPs have met in closed door talks regarding the country's Brexit negotiation stance. The Cabinet ministers are believed to be trying to secure support from Labour MPs for a softer Brexit that gives UK access to the Single Market. Also, the Parliament would try to assert its maximum influence to shape the negotiation with EU, rather than letting the Government to do it on its now. Meanwhile, some centrist Labours are believed to be willing to put aside party differences to get the best Brexit deal. But in any case, it's now believed that Prime Minister Theresa May's "no deal is better than a bad deal" stance won't be adopted after the disastrous election.
BoJ official said slower bond purchase due to falling yields
In Japan, BoJ's executive director on monetary policy told the Parliament that the pace of bond purchases slowed since US yields have fallen. Masayoshi Amamiya said that "the slowdown came as a result of our policy of guiding yields at appropriate levels:. And BoJ will "continue to take necessary steps to stabilize prices, while keeping an eye on how they affect its financial health". BoJ will announce monetary policy decision on Friday and it's widely expected to keep everything unchanged.
On the data front
Japan BSI large industry index dropped to -2.9 in Q2. Australia NAB business confidence dropped to 7 in May. UK CPI will be the major focus in European session. Downside surprise there could build up selling pressure in Sterling again ahead of BoE meeting. Eurozone will also release ZEW economic sentiment. From US, PPI is the only major data release.
USD/CAD Daily Outlook
Daily Pivots: (S1) 1.3271; (P) 1.3371; (R1) 1.3422; More....
USD/CAD's decline from 1.3793 resumed by taking out 1.3387 and reaches as low as 1.3273 so far. Intraday bias is back on the downside for 1.3222 support next. We'd holding on to the view that whole choppy rise from 1.2460 has completed at 1.3793. Break of 1.3222 will affirm our bearish view and target 1.2968 key support for confirmation. On the upside, above 1.3387 support turned resistance will turn intraday bias neutral. But recovery should be limited well below 1.3537 resistance to bring fall resumption.
In the bigger picture, price actions from 1.4689 medium term top are seen as a correction pattern. The first leg has completed at 1.2460. Rise from 1.2460 is seen as the second leg and could have completed at 1.3793, ahead of 61.8% retracement of 1.4689 to 1.2460 at 1.3838. Break of 1.3222 should indicate the start of the third leg while further break of 1.2968 should confirm. Nonetheless, sustained trading above 1.3838 would pave the way to retest 1.4689 high.
Economic Indicators Update
| GMT | Ccy | Events | Actual | Forecast | Previous | Revised |
|---|---|---|---|---|---|---|
| 23:50 | JPY | BSI Large All Industry Q/Q Q2 | -2.9 | 1.5 | 1.3 | |
| 1:30 | AUD | NAB Business Confidence May | 7 | 13 | ||
| 8:30 | GBP | CPI M/M May | 0.20% | 0.50% | ||
| 8:30 | GBP | CPI Y/Y May | 2.70% | 2.70% | ||
| 8:30 | GBP | Core CPI Y/Y May | 2.30% | 2.40% | ||
| 8:30 | GBP | RPI M/M May | 0.30% | 0.50% | ||
| 8:30 | GBP | RPI Y/Y May | 3.50% | 3.50% | ||
| 8:30 | GBP | PPI Input M/M May | -0.40% | 0.10% | ||
| 8:30 | GBP | PPI Input Y/Y May | 13.40% | 16.60% | ||
| 8:30 | GBP | PPI Output M/M May | 0.10% | 0.40% | ||
| 8:30 | GBP | PPI Output Y/Y May | 3.60% | 3.60% | ||
| 8:30 | GBP | PPI Output Core M/M May | 0.20% | 0.50% | ||
| 8:30 | GBP | PPI Output Core Y/Y May | 2.80% | |||
| 8:30 | GBP | House Price Index Y/Y Apr | 3.70% | |||
| 9:00 | EUR | German ZEW (Economic Sentiment) Jun | 21.8 | 20.6 | ||
| 9:00 | EUR | German ZEW (Current Situation) Jun | 83.9 | |||
| 9:00 | EUR | Eurozone ZEW (Economic Sentiment) Jun | 37.2 | 35.1 | ||
| 12:30 | USD | PPI M/M May | 0.00% | 0.50% | ||
| 12:30 | USD | PPI Y/Y May | 2.50% | 2.50% | ||
| 12:30 | USD | PPI Core M/M May | 0.20% | 0.40% | ||
| 12:30 | USD | PPI Core Y/Y May | 2.00% | 1.90% |
Elliott Wave View: GBPJPY Extension Lower
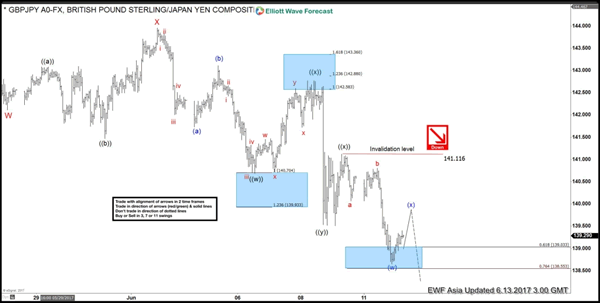
Short term GBPJPY Elliott Wave view suggests the decline from 5/10 high shows a 5 swing sequence, thus favoring more downside. Decline from 5/10 high is unfolding as a double three Elliott Wave structure. Down from 5/10 peak (148.11), Minor wave W ended at 141.47 and Minor wave X ended at 143.96. Minor wave Y is currently in progress and has scope to retest 4/16 low (135.58). Support can be seen at 135.7 – 137.3 area for at least 3 waves bounce.
Subdivision of Minor wave Y is proposed to be unfolding as a triple three Elliott Wave structure. Down from 6/1 peak (143.96), Minute wave ((w)) ended at 140.68, Minute wave ((x)) ended at 142.77, Minute wave ((y)) ended at 139.52 and Minute second wave ((x)) ended at 141.11. Near term, while Minutte wave (x) bounce stays below 141.11, and more importantly below 143.95, expect pair to extend lower. We don’t like buying the proposed bounce.
GBPJPY 1 Hour Elliott Wave Chart
Market Morning Briefing: All Eyes Remain Glued On The Three Central Bank Meetings This Week
STOCKS
Overall stocks are stable and could either remain ranged or move up in the near term
Dow (21235.67, -0.17%) is slowly inching up towards 21600 and could possibly test 21400 on the upside this week. Support remains at 21000 and while the index is trading above 21000, the trend remains bullish.
Dax (12690.44, -0.98%) fell sharply yesterday instead of breaking above 12850. We could possibly see some trade within the 12650-12850 region in the near term before testing 13000.
Shanghai (3138.67, -0.04%) has enough scope on the upside towards 3160-3170 for the next couple of sessions.
Nikkei (19885.72, -0.11%) is holding above 19825 and could move up towards 20000 in the coming sessions. Near term looks bullish.
Nifty (9616.40, -0.54%) has been fluctuating within the 9700-96500 region and could possibly continue to do so for some more sessions. Immediate support is seen near 9600 which could extend to 9550 on the downside. Overall the index could be ranged sideways before rallying to higher levels.
COMMODITIES
Muted price action had been seen in Gold (1264) as it remains in a slow corrective move which may take it to the support of 1242 but if the support holds, a quick bounce towards 1307can’t be ruled out. Silver (16.88) also moved lower in line with our expectation. A close below 16.80 could open up 16.50 as well. We might see less volatility in the market ahead of FOMC meeting (on 14th June 2017), which may add some directional clarity.
Copper (2.62) is trading within the narrow range of 2.56-2.68. Only above 2.68, higher resistances of 2.84 can come into consideration. We will remain bullish on copper while it is trading above 2.55 regions.
Nothing new to add as market is waiting for tomorrow’s U.S FOMC as well as weekly crude inventory data. Brent (48.47) and WTI (46.30) is trading above their respective supports of 47.40 and 44.20 to keep the upside possibility of 50.22 (Brent) and 47.50 (WTI) open. If Brent and WTI manage to close above 50.30 and 47.50 in the next couple of sessions, another attempt for 52 and 49.55 can be seen. Bearish possibilities will come in consideration in case 47.40 for Brent and 44.20 for WTI break down.
Gold/WTI ratio (27.59) found resistance at 28 levels and might come down towards 26.50-27 levels.At the same time Brent-WTI 3day spread (2.22) had bounced from its support near 2.00 levels and could move up towards 3.00-3.25 regions within a few days of time.
FOREX
All eyes remain glued on the three central bank meetings this week - FOMC on 14th, BOE on 15th and BOJ on 16th, among which BOE and BOJ are expected to keep the rates unchanged but the Fed is expected to hike.
Dollar Index (97.22) is taking a comfortable pause after the sharp rally from 96.50 to 97.30 last week and may resume the rally for 97.70-80 after the FOMC conclusion tomorrow. A sustained break above 97.80 may open the door for further upside towards 100.00.
Euro (1.1191) remains weak and may test the immediate support area in 1.1140-00 in the next couple of sessions. If 1.1100 fails to hold in the near term, the downside risk for Euro may increase considerably.
A bit of risk aversion is driving money into Yen and pushing Dollar-Yen (109.98) lower. If the FOMC policy decision looks favorable to the market tomorrow, then Dollar may strengthen and pull Dollar Yen up but it needs a break above 110.60 as the initial signal for an upside reversal.
Contrary to expectations, Pound (1.2646) is in a free fall towards 1.2600 and may test the long term support of 1.2560-40 by the end of the week if the current bearish momentum persists. Some amount of short covering can be expected near 1.2560-40 if Pound declines that far. The trend remains firmly down below 1.2800.
Aussie (0.7558) is stalling near the previous week’s high of 0.7567 and may rise to 0.7590-0.7610 yet but it may be the time for caution as a short term correction can be expected from anywhere in the area of 0.7570-0.7610.
Dollar-Rupee (64.44) closed above 64.40 yesterday moving in line with our expectation. The rise may extend towards 64.50/60 in the coming sessions from where a pulll back to current levels is possible.
INTEREST RATES
The US yields continue to rise and look bullish in the near term. The 10Yr (2.21%) could head towards 2.28% while the 30YR (2.87%) could move up to 2.90% but there could be a small dip before moving up.
The Japan-US 10YR (2.15%) has bounced from immediate support and could test 2.2% in the near term taking up Dollar Yen a bit. Overall the yield spread looks bullish for the near term.
The German-US 10Yr (-1.96%) has broken below the immediate support near -1.95% mentioned yesterday and while the yield spread continues to move lower, Euro could come off sharply. The German-US 2Yr (-2.11%) had given an initial indication of a fall in the yield spreads and the Euro. The 2YR yield spread could possibly pause before moving to lower levels in the next couple of sessions.
The UK-US 10YR (-1.24%) has come off sharply in the last few sessions and is testing support near current levels. If the yield spread bounces back from support, it could move back towards -1.18%. In that case the Pound could remain stable for at least 1-2 sessions.
FOMC Preview: Expectations Are High But Data Do Not Justify A Hike Yet
- We stick to our view that the Fed will skip hiking at the upcoming meeting and instead announce the triggers for quantitative tightening (QT), as a datadependent Fed should wait at least one meeting to confirm that recent weakness is only temporary.
- However, given the high expectations of a June hike, the Fed may have painted itself into a corner, as high expectations have weighed on the Fed's decision before.
- If the Fed hikes in June, we do not expect an announcement on QT. Instead, we expect it to be postponed until the September meeting. We still think the third hike is most likely in December.
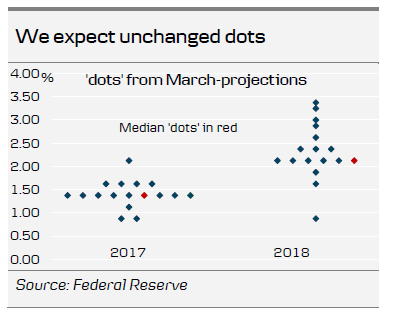
- We expect unchanged 'dots' signalling three hikes per year and see limited chance of a hawkish surprise.
- We target EUR/USD at 1.09 in 3M and expect only modest impact on Treasury yields from QT.
Unchanged dots
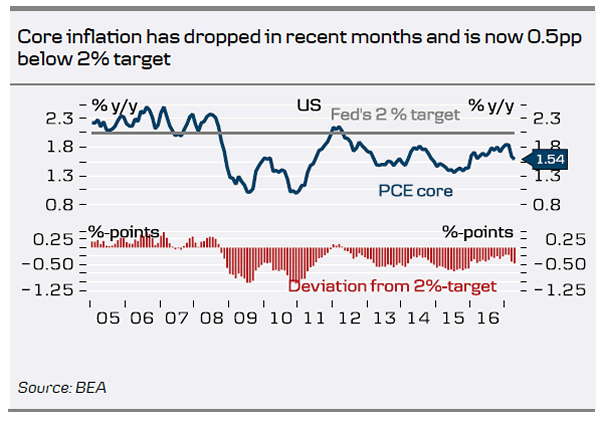
Next week's meeting is one of the so-called big meetings, which means that we get updated projections and there will be a press conference after the meeting. We will pay particular attention to the 'dots'. We believe the 'dots' will be unchanged signalling a hiking pace of three hikes per year, which is also part of the reason why we do not think the Fed will want to hike at this meeting since it would signal four hikes this year – more on this below. Furthermore, we believe the estimate of the long-run interest rate will be 3%. NAIRU and inflation estimates are also interesting. The NAIRU estimate is interesting, as the Fed's latest estimate of NAIRU was 4.7% and the unemployment rate has recently hit 4.3%. The projection for inflation is interesting given the recent sharp fall in inflation
Data-dependent Fed should wait at least one meeting
For a long time we have held the view the Fed would skip hiking in June and instead announce the triggers for quantitative tightening. One reason has been the Fed's desire to start quantitative tightening this year while avoiding a new round of 'taper tantrum', meaning the FOMC members want to announce the details well in advance. Another was that the hiking cycle would be smoother by waiting until July, assuming the Fed wants to hike three times this year as signalled both in December and in March (by hiking in both March and June, the Fed has hiked every other meeting since December, implying a hike pace of four per year). However, given the high expectations of the Fed delivering, it may have painted itself into a corner, as high expectations have weighed on the Fed's decision before although we do not expect a possible June hike to be unanimous.
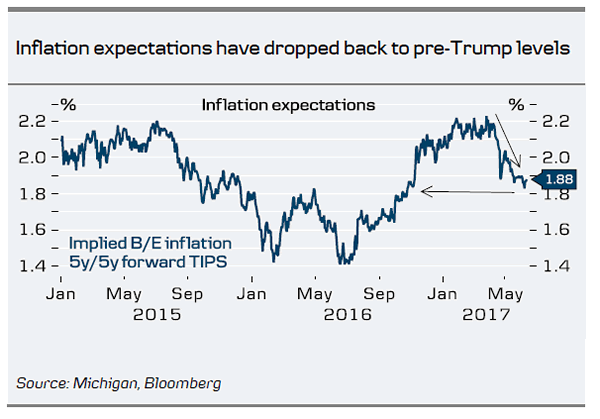
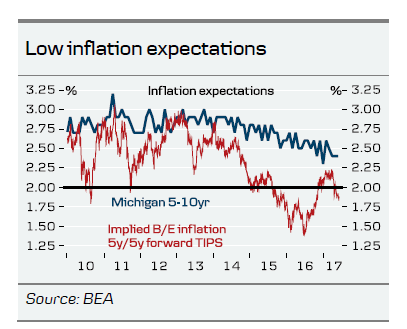
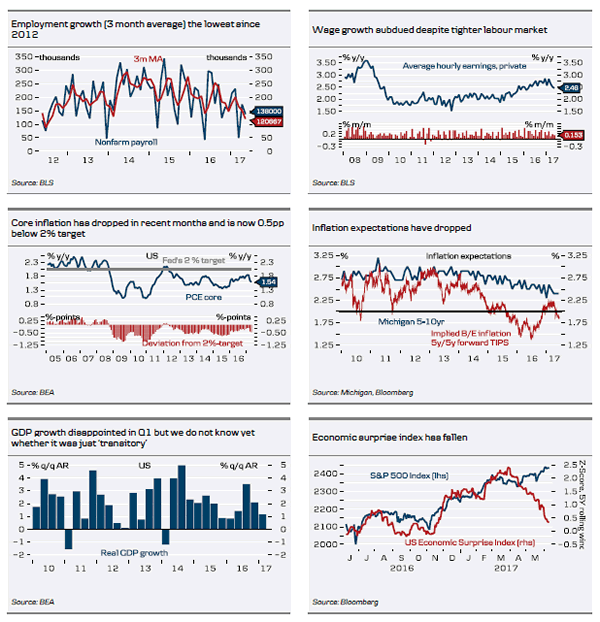
We are a bit worried about the Fed hiking already again here in June (especially after the hike in March, which came out of the blue), as we do not think the data support it. While the unemployment rate fell to a new cycle low of 4.3% in May, it was for the wrong reason, as the labour force fell – employment growth has declined to the lowest level since 2012. Inflation has disappointed in recent months, inflation expectations have declined since the March meeting and wage growth is still missing despite the tighter labour market. The US surprise index has fallen back to neutral. GDP growth disappointed in Q1, possibly partly due to negative residual seasonality, but we do not know whether growth has accelerated here in Q2. Also, it seems less likely that Trump will deliver on his promises on tax reform and infrastructure investments, meaning that growth will not be boosted by Trumponomics. Although most FOMC members have not incorporated more expansionary fiscal policy in their projections (some have partly), sentiment has begun to decline again both among consumers and businesses.
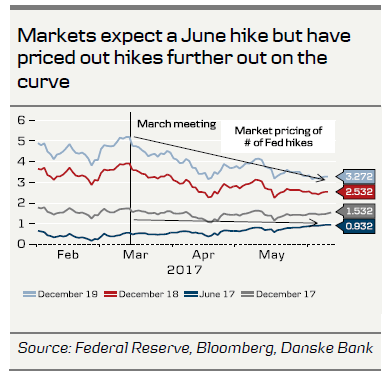
A Fed hike in June would mean that it is not as data dependent as we thought or the Fed puts more weight on the unemployment rate than we estimated. By waiting until July the FOMC members will get a few more data points to support their views that the recent weakness is temporary and additionally they show markets that every meeting is in fact live, although even July may turn out to be soon. While markets seem convinced the Fed is going to hike in June, it is interesting investors have priced out the number of hikes further out even since the surprising hike in March. By hiking this fast, there is a risk that the Fed may need to pause its hiking cycle and we think risks are skewed towards fewer hikes than the three hikes per year regime, which is our current base case.
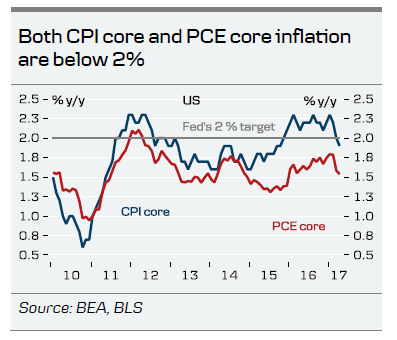
In the statement from the May meeting, the Fed communicated that 'ahead of future adjustments to the target range for the federal funds rate, the Committee will assess realized and expected economic conditions relative to its objectives of maximum employment and 2 percent inflation'. If the Fed is serious about this, the recent, and rather significant, decline in PCE inflation speaks in favour of postponing a hike and seeing whether this downtick is temporary or permanent before continuing to hike. EUR/USD: Fed to fuel a negative summer cocktail
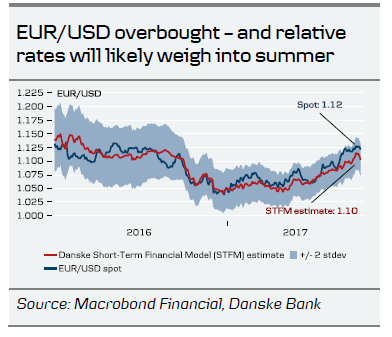
With a Fed that is poised to confirm its determinedness to move on with both hikes and balance-sheet reduction - irrespective of whether a June hike is delivered or not - we expect dollar strength to return temporarily into the summer as the market is currently priced very soft beyond 2017. Although the Fed may eventually have to slow down on its proposed tightening package, we deem that complacency in US rates recently makes for a period of upside to USD crosses from a relative-rate angle.
Ample USD liquidity following the US Treasury Q1 cash deluge has also led to narrowing of the EUR/USD XCCY basis – a factor we reckon has been supportive for EUR/USD during H1 this year. However, with the Fed likely to make an announcement, or at least provide further details, on its planned reduction of its balance sheet focus in the market will return to USD liquidity which is prone to become scarcer during H2. In Research US - Fed's regulatory hurdle for starting quantitative tightening we highlighted an optimistic scenario for reducing the balance sheet to be one which targets a total reduction of around USD1,700bn over five years that would amount to an average monthly reduction of USD30bn. We stick to that view, which means that if the Fed presents something along those lines we see a risk of the start of an unwarranted tightening of USD liquidity over the coming 3-12M depending on the timing of the start of the reduction. That should widen the EUR/USD XCCY basis and be a negative contributing factor for EUR/USD. In particular, if reductions to a greater extent target Fed's holdings of mortgage-backed securities.
For EUR/USD, a hawkish stance from the Fed would come at a time where the ECB has admittedly moved a tad closer to 'neutral' on rates but at the same time laid out an inflation outlook that deters Draghi and co from looking for an easing exit any time soon. In our view, this makes for a period where EUR/USD could move to the lower end of its newfound 1.08-1.13 range. Should the Fed refrain from hiking in June, the knee-jerk reaction will most likely be to send EUR/USD higher, but we do not expect a move much above the 1.13 level. However, in our base case that a summer hike will come – if not June, then July – we think that as markets digest the boldness with which we think the FOMC will move near term, USD strength will materialise for a while. Add the risk of a slowing eurozone growth momentum in coming months and you have a EUR/USD negative summer cocktail. We remain tactically short the pair in the Danske FX Trading Portfolio and target EUR/USD at 1.09 in 3M. That said, we still see levels below 1.10 as attractive for positioning for a renewed uptick towards the end of the year.
We expect modest spill-over to Treasury yields from QT
The latest minutes stated that quantitative tightening will be conducted 'in a gradual and predictable manner'. The staff proposes that the FOMC announces a set of gradually increasing caps/limits on the dollar amounts of bonds that will be allowed to run off each month and only reinvest the amounts that exceeded the caps each month. The caps will be set at low levels and then raised every three months (corresponding to every other meeting, although the Fed will likely not vote on this every month, as many FOMC members have argued it should run in the background). When the final values of the caps are reached, the caps will be maintained and the balance sheet will continue to shrink until the target is reached. In the minutes, it was also noted that the approach would 'likely be fairly straightforward to communicate'. Besides, the ongoing caps/limits 'could help mitigate the risk of adverse effects on market functioning or outsized effects on interest rates'.
In our view, the spill-over to Treasury yields from a reduction in the Federal Reserve's balance sheet by phasing out or ceasing reinvestments of the MBS prepayments and/or scheduled repayment of principals should be modest. That said, the potential steepening pressure induced by phased out or ceased reinvestments of maturing Treasuries relies heavily on the Treasury's issuance pattern going forward, but should be moderate compared to the 'taper tantrum' in 2013. Besides, a too excessive quantitative tightening could lead to temporary tightening of financial conditions, offsetting a potential steepening pressure (for more see Fed's 'Quantitative Tightening' Fixed Income Implications, 6 April 2017).
Bank Of Canada’s Wilkins Hints At Hikes And Drops USD/CAD As A Result
But it wasn't even the Queen's birthday, I hear you say?
'The day has been celebrated since 1788, when Governor Arthur Phillip declared a holiday to mark the birthday of King George III. Until 1936 it was held on the actual birthday of the Monarch, but after the death of King George V it was decided to keep the date at mid-year.'
Ah yes, of course…
Even the most hardened Australian republican enjoys being part of the British Commonwealth when they're so generously gifted a long weekend.
God Save the Queen!
Now moving onto markets and speaking of British Commonwealth countries, it was the Canadian Dollar making headlines with a rip in Asia today. It was the Bank of Canada's Carolyn Wilkins that hit the newswires with a speech that wasn't even marked on a lot of forex calendars and she had USD/CAD in the firing line.
'…BoC would need to take appropriate action.'
That's all that forex markets needed to hear and is a clear hawkish shift by the BoC moving forward.
Goodbye USD/CAD.
USD/CAD 5 Minute:
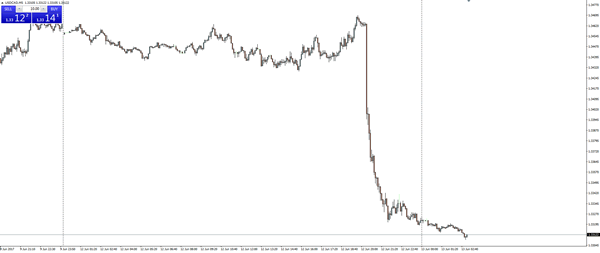
Now with today's comments not being scheduled on most economic calendars, there will be plenty of you (including myself), who missed the early boat on any potential shorts.
This is where looking for areas of interest on pullbacks comes into play.
USD/CAD 4 Hour:
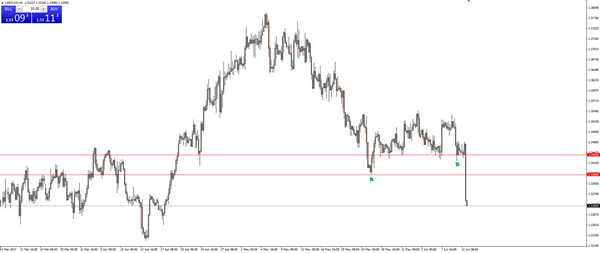
On the above 4 hour chart, I've marked a couple of these areas to watch out for, if price does in fact pull back.