
Sample Category Title
DAX Drops as US Technical Stocks Take a Tumble
The DAX index has lost ground in the Monday session, dropping 0.91 percent. The index is currently at 12,700.50 points. On the release front, there are no German or Eurozone events. On Tuesday, Germany and the Eurozone will release ZEW Economic Sentiment reports, and Germany will also publish WPI.
The German stock markets are down on Monday, following sharp losses on the Nasdaq, which dropped 1.8% on the Friday session. Major technology stocks such as Facebook, and Google were all down by more than 3 percent, and Apple led the downturn with losses of close to 4 percent. German financial stocks were lower on Monday – Deutsche Bank is down 1.23%, while Commerzbank has dropped to 1.03 percent.
In contrast to the election shocker in the UK, there was little suspense in the first round of French parliamentary elections, as President Emmanuel Macron led with 28% of the vote. Voters will determine the makeup of the 577 seats in the National Assembly, with Macron expected to win a huge majority in the second round. Macron is expected to put forward legislation to revamp labor laws, which will not sit well with the powerful labor unions. Any changes to France's generous employment benefits is bound it be contentious, but a strong majority in parliament will make it easier for Macron to push through reforms.
As expected, the ECB did not announce any changes to monetary policy at its June meeting. However, the ECB did tweak its language in the rate statement and in Mario Draghi's follow up comments. The ECB kept the benchmark rate pegged at 0.00% and maintained its asset-purchase plan (QE) of EUR 60 billion/month. The cautious ECB did, however, remove its guidance on rate cuts, as the ECB rate statement said that it expected interest rates to remain at "present levels" for an extended period of time. This was slightly more hawkish than the April statement, which said that policymakers expected rates to remain at present or lower levels" for an extended period. As well, Draghi characterized risks to the economy as "broadly balanced", compared to previous warnings that risks were "tilted to the downside. The subtle nuance in wording appears to be a nod to improving economic conditions in the euro-area, and could be a sign that the ECB may look to wind up its stimulus program before it terminates in December, if the economy continues to improve. The ECB has revised upwards its growth forecast for 2017 and 2018, although it has lowered its inflation forecast.
GBP/JPY Mid-Day Outlook
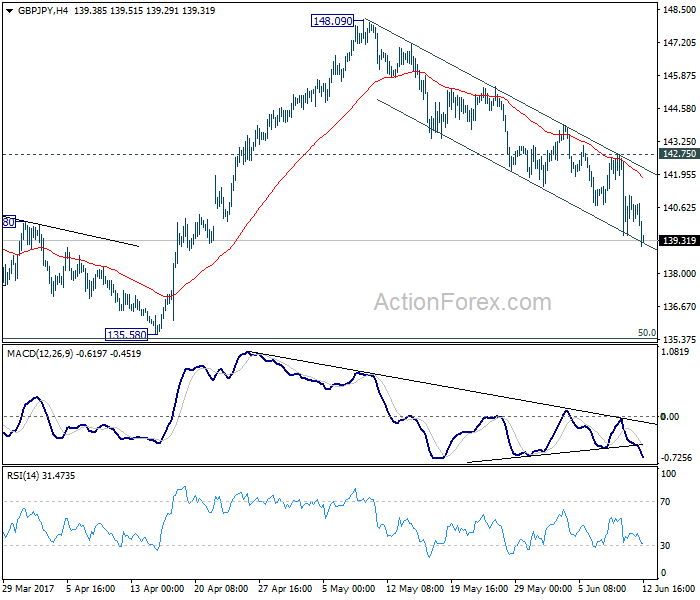
Daily Pivots: (S1) 139.21; (P) 140.86; (R1) 142.22; More....
GBP/JPY's fall continues today and reaches as low as 139.08 so far. Intraday bias stays on the downside for 135.58 support. As it's also close to 135.39 fibonacci level, we'd look for bottoming signal around there to bring rebound. However, break of 142.75 resistance is needed to indicate completion of fall from 148.09. Otherwise, near term outlook will say mildly bearish in case of recovery.
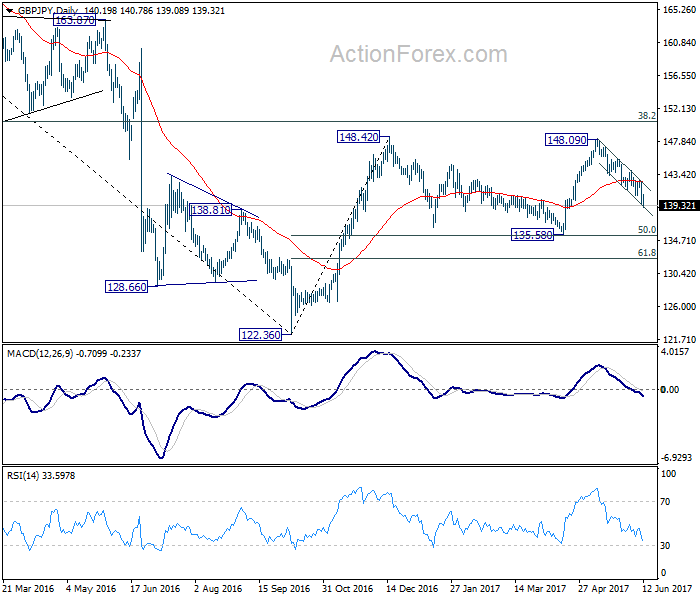
In the bigger picture, while the fall from 148.09 is deeper than expected, we're not bearish in the cross yet. Price action from 148.42 is possibly developing into a sideway pattern with fall from 148.09 as the third leg. Deeper decline could be seen but we're looking for strong support from 135.58 and 50% retracement of 122.36 to 148.42 at 135.39 to contain downside. Rise from 122.36 is still mildly in favor to resume at a later stage. However, sustained break of 135.58/39 will confirm reversal and target a retest on 122.36 low.
Yen Jumps Broadly on Risk Aversion, Sterling Under Renewed Pressure
The Japan Yen surges broadly today on risk aversion as last week's selloff in NASDAQ is spreading over. At the time of writing, DAX is trading down -0.9% while CAC is down -1.0%. FTSE is down a mere -0.1% as helped by renewed selling in Sterling. While DOW opens nearly flat, NASDAQ is losing another -1% in early trading. Elsewhere, the Pound is under some pressure again as it breaches last week's low against Euro and Yen. Dollar is also trading softer as despite firm expectation of an FOMC rate hike later in the week.
In US, the political drama surround US President Donald Trump continued. Republicans called Trump to clear the air regarding any recordings on his conversations with former FBI Director James Comey. And they urged Trump to provide them to Congress if he does. Attorney General Jeff Sessions will testify before Senate on Tuesday regarding the firing of Comey. Meanwhile, it's reported that attorney generals of Maryland and Washington D.C. are filing a lawsuit today against Trump alleging that foreign payments to his businesses violate the Constitution.
Fed is widely expected to raise interest by another 25bps to 1.00-1.25%. Fed fund futures are pricing in 95.8% chance of that. The biggest question in traders mind is whether Fed is still ready to hike another time in September, to make a total of three hikes. There are doubts on whether the US economy could withstand that. And the new economic projections to be released with the rate announcement should shed some lights on policy makers' mind on it.
A softer Brexit is now possible but negotiation might be delayed
Credit rating agency Moody's said in a report that the inconclusive election in UK now increases the chance of a "softer" form of Brexit. That would likely include access to the EU single market Also, "while the economic impact of such an outcome would be significantly less severe than the 'hard' Brexit pursued so far, it is still far from clear whether these are indeed realistic scenarios." But it also pointed out that the elections result could now "complicate and probably delay Brexit negotiations". And it maintained there are still risks of a "sudden exit".
Talking about delaying Brexit negotiation, UK Brexit Minister David Davis said today that the formal negotiation with EU may not start as scheduled next week on June 19 as scheduled. Davis said that he's taking with EU on the details. But he pointed out it may not be next Monday "because we've also got the Queen's Speech that week and I will have to speak in that and so on".
Meanwhile, EU's chief negotiator Michel Barnier insisted on the approach that the divorce bill, citizens rights and border of Ireland should be settled first. Then, discussions on trade agreement could start. An unnamed EU official warned that if UK don't accept this "phased negotiations", it could take "a year" to draw up a new set of negotiating guidelines for Barnier.
Macron's LREM to get overwhelm majority in parliament
In France, President Emmanuel Macron's centrist party looks set to take an overwhelming majority in parliament after the first round of election yesterday. The new La Republique En Marche and its ally MoDem won 32.32% of votes in the first round, well ahead of rival Les Republicain's alliance at 21.56%. The far-right Front National got 13.2% while Socialist got 9.5%. Based on current estimations, the La Republique En March could get up to 430 seats in the 577 seat parliament after the final round on June 18. And if that happens, it would be a boost for Macron to implement his center right policies including loosing up labor laws and reforming the welfare system.
German Chancellor Angel Merkel expressed her "heartfelt congratulations" to Macron on the "great success" of the party in its first ballot. She hailed that the result was a "strong vote for reforms" that could strengthen the German-French alliance. Both expressed common goal to develop a roadmap to strengthen EU and the Eurozone when they met in Berlin last month. And Macron is clear about his wish to push for reforms in EU, strengthening of Eurozone with a common budget and introduce new executive power in Eurozone with a Euro chamber and a Euro commissioner.
GBP/JPY Mid-Day Outlook
Daily Pivots: (S1) 139.21; (P) 140.86; (R1) 142.22; More....
GBP/JPY's fall continues today and reaches as low as 139.08 so far. Intraday bias stays on the downside for 135.58 support. As it's also close to 135.39 fibonacci level, we'd look for bottoming signal around there to bring rebound. However, break of 142.75 resistance is needed to indicate completion of fall from 148.09. Otherwise, near term outlook will say mildly bearish in case of recovery.
In the bigger picture, while the fall from 148.09 is deeper than expected, we're not bearish in the cross yet. Price action from 148.42 is possibly developing into a sideway pattern with fall from 148.09 as the third leg. Deeper decline could be seen but we're looking for strong support from 135.58 and 50% retracement of 122.36 to 148.42 at 135.39 to contain downside. Rise from 122.36 is still mildly in favor to resume at a later stage. However, sustained break of 135.58/39 will confirm reversal and target a retest on 122.36 low.
Economic Indicators Update
| GMT | Ccy | Events | Actual | Forecast | Previous | Revised |
|---|---|---|---|---|---|---|
| 23:50 | JPY | Machine Orders M/M Apr | -3.10% | 0.60% | 1.40% | |
| 23:50 | JPY | Domestic CGPI Y/Y May | 2.10% | 2.20% | 2.10% | |
| 6:00 | JPY | Machine Tool Orders Y/Y May P | 24.40% | 34.70% | ||
| 18:00 | USD | Monthly Budget Statement May | -87.3B | 182.4B |
Trade Idea Update: GBP/USD – Target met and stand aside
GBP/USD - 1.2673
Original strategy :
Sold at 1.2760, met target at 1.2660
Position : - Short at 1.2760
Target : - 1.2660
Stop : -
New strategy :
Look to sell again higher
Position : -
Target : -
Stop : -
As the British pound has retreated after faltering below indicated resistance at 1.2780, adding credence to our bearish view that the rebound from 1.2635 has ended at 1.2780 (our short position entered at 1.2760 just met our downside target at 1.2660 with 100 points profit) and bearishness remains for retest of said support at 1.2635, however, break there is needed to confirm recent decline has resumed for weakness to 1.2616 (previous resistance turned support) and possibly towards 1.2575-80 but reckon downside would be limited to 1.2550.
As we have taken profit on our short position entered at 1.2760, would not chase this fall here and would be prudent to stand aside for now. Above 1.2710-15 would prolong consolidation and risk recovery to 1.2745-50 but said resistance at 1.2780 should limit upside and bring another decline. Above 1.2780 would defer and risk a stronger rebound to 1.2800-05 but break there is needed to signal a temporary low has been formed, bring further gain to 1.2830-35 but price should falter below 1.2870-75 and bring another decline later.

Trade Idea Update: EUR/USD – Hold short entered at 1.1230
EUR/USD - 1.1216
Original strategy :
Sold at 1.1230, Target: 1.1130, Stop: 1.1265
Position : - Short at 1.1230
Target : - 1.1130
Stop : - 1.1265
New strategy :
Hold short entered at 1.1230, Target: 1.1130, Stop: 1.1265
Position : - Short at 1.1230
Target : - 1.1130
Stop : - 1.1265
Although the single currency rebounded after falling to 1.1166 on Friday and initial upside risk is seen for this rebound to extend gain to 1.1237 (previous resistance), however, reckon 1.1250 would hold, bring retreat later, below 1.1180 would bring retest of 1.1166 but break there is needed to extend the fall from 1.1285 top for retracement of early upmove to 1.1145-50 and then towards 1.1120 but support at 1.1109 should hold from here.
In view of this, we are holding on to our short position entered at 1.1230. Above 1.1265-70 would abort and bring retest of 1.1285, only break there would revive bullishness and confirm recent upmove has resumed and extend further gain to previous chart resistance at 1.1300, break there would encourage for headway to 1.1340-45 and later towards chart point at 1.1366.

Trade Idea Update: USD/JPY – Stand aside
USD/JPY - 110.00
New strategy :
Stand aside
Position : -
Target : -
Stop : -
Although the greenback jumped to as high as 110.81, lack of follow through buying on break of previous resistance at 110.73 and the subsequent retreat suggest consolidation below 110.81 would be seen and pullback to 109.75 cannot be ruled out, however, break of this support is needed to signal top is formed, bring further fall towards 109.38 but only break there would indicate the rebound from 109.11 has ended at 110.81, bring retest of this level later.
On the upside, above 110.50-60 would bring test of 110.81 but break there is needed to signal the erratic rise from 109.11 low is still in progress for further gain to 111.00 and possibly 111.20-30 but price should falter well below resistance at 111.71, bring retreat later. As near term outlook is mixed, would be prudent to stand aside in the meantime.

GBP/JPY Bears Break Downtrend Line Support
GBP/JPY has seen a substantial 5.7% retracement since May 10th.
The price has been trading above the downside short term major downtrend line support since May 18th.
It has seen a 2% fall since the general election date, caused by the disappointing Hung Parliament outcome.
This morning in early European session, the psychological support line at 140.00 was broken, the bears further broke the downtrend line support and the support line at 139.50 with increased bearish momentum.
The bears are currently edging down with the attempt to test the next psychological support at 139.00.
On the 4-hourly chart, the price is still trading below the downward heading 10-SMA at present, indicating ongoing bearish trend.
In the short term, GBP is likely to remain moderately bearish, as a Hung Parliament will likely weaken the UK's position during the upcoming Brexit negotiations.
The resistance level is at 139.50, followed by 140.00.
The support line is at 139.00, followed by 138.50.
CAC Slips After US Tech Selloff
The CAC index has started the week with losses, dropping 0.89% on Monday. Early in the North American session, the CAC is at 5253.30 points. On the release front, there are no French or eurozone events on the schedule. On Tuesday, France releases Nonfarm Payrolls and the eurozone releases ZEW Economic Sentiment.
European stock markets have sagged on Monday, following sharp losses on the Nasdaq, which dropped 1.8% on the Friday session. Heavyweight technology stocks such as Apple, Facebook, and Google were all down by more than 3 percent. Apple led the downturn with losses of close to 4 percent. On the French stock exchange, BNP Paribas has dropped 1.60%, and Societe Generale is down 1.92 percent. On the political front, there was little suspense in the first round of French parliamentary elections, as President Emmanuel Macron led with 28% of the vote. Macron is expected to win a huge majority in the second round of voting on Sunday, which will determine the makeup of the 577 seats in the National Assembly. Macron, whose party is just a year old, is expected to put forward pro-business legislation, which will not sit well with the powerful labor unions. Macron wants to streamline government and overhaul labor laws, in order to revive a weak economy. Any changes to France's generous employment benefits is bound it be contentious, but a strong majority in parliament will make it easier for Macron to push through reforms.
The ECB meeting did not make any moves at last week's meeting, but it did tweak its monetary stance. The ECB kept the benchmark rate pegged at 0.00% and maintained its asset-purchase plan (QE) of EUR 60 billion/month. The cautious ECB did, however, remove its guidance on rate cuts, as the ECB rate statement said that it expected interest rates to remain at "present levels" for an extended period of time. This was slightly more hawkish than the April statement, which said that policymakers expected rates to remain at present or lower levels" for an extended period. As well, Mario Draghi characterized risks to the economy as "broadly balanced", compared to previous warnings that risks were "tilted to the downside. The subtle nuance in wording appears to be a nod to improving economic conditions in the euro-area, and could be a sign that the ECB may look to wind up its stimulus program before it terminates in December, if the economy continues to improve. The ECB has revised upwards its growth forecast for 2017 and 2018, although it has lowered its inflation forecast, which may have weighed on the euro and prevented any gains following the ECB rate meeting.
EUR/USD – Lack Of Fundamentals Leaves Euro Subdued
The euro has ticked higher in at the start of the week. In Monday’s European session, EUR/USD is trading at 1.1220. There are no major releases out of the eurozone or the US. On Tuesday, Germany releases ZEW Economic Sentiment and the US publishes PPI.
The markets had low expectations going ahead of the ECB meeting last week, so there was some surprise as the central bank did tweak its monetary stance. The ECB kept the benchmark rate pegged at 0.00%, and made no changes to its asset-purchase plan (QE) of EUR 60 billion/month. The cautious ECB did, however, remove its guidance on rate cuts, as the ECB rate statement said that it expected interest rates to remain at “present levels” for an extended period of time. This was slightly more hawkish than the April statement, which said that policymakers expected rates to remain at present or lower levels” for an extended period. As well, Mario Draghi characterized risks to the economy as “broadly balanced”, compared to previous warnings that risks were “tilted to the downside. The subtle nuance in wording appears to be a nod to improving economic conditions in the euro-area, and could be a sign that the ECB may look to wind up its stimulus program before it terminates in December, if the economy continues to improve. The ECB has revised upwards its growth forecast for 2017 and 2018, although it has lowered its inflation forecast, which may have weighed on the euro and prevented any gains following the ECB rate meeting.
There was little suspense in the first round of French parliamentary elections, as President Emmanuel Macron led with 28% of the vote. Macron is expected to win a huge majority in the second round of voting on Sunday, which will determine the makeup of the 577 seats in the National Assembly. Macron, whose party is just a year old, is expected to put forward pro-business legislation, which will not sit well with the powerful labor unions. Macron wants to streamline government and overhaul labor laws, in order to revive a weak economy. Any changes to France’s generous employment benefits is bound it be contentious, but a strong majority in parliament will make Macron’s job easier.
Markets Behaving Calmly As UK Election Aftermath Begins
All major headlines and attention are still surrounding the United Kingdom following the uncertain outcome to the UK election at the end of last week.
The British Pound appears to have stabilized and is trying to maintain its footing around 1.27, after suffering a decline just above 2% at one point following it becoming clear that the UK was heading for a hung parliament. There is a viewpoint that the Pound should remain supported over the near-term despite the uncertainty, due to the likelihood that the forming of a coalition government would encourage Theresa May to cool it down when it came to her previous hardline approach towards the European Union and the imminent Brexit negotiations. The possibility that Theresa May will be left with no choice but to adopt a diplomatic approach towards Brexit is what has been seen as the most supportive factor for the Pound over the near-term. It’s not something that I am buying into however, and I think this might be a short-lived consolidation around 1.27.
I personally still see downside risks for the Sterling and see the potential for the market to become encouraged towards selling in the likelihood that the UK is set to begin negotiations next week and looks very unprepared for such complex negotiations. The whole reason for the UK election in the first place was so that Theresa May would have more powers to influence the Brexit process, but not only has this play backfired, the UK looks more unprepared than ever to go head-to-head with the EU as it currently stands. I personally remain bearish on the Sterling.
What was noticeable when European trading commenced on Monday was that the FTSE dipped lower, which some could attribute to the uncertainty in the aftermath of the UK election. It is also worth pointing however that the FTSE looked under pressure around the same time that the Pound was at that point consolidating a little higher, which could be the inverse Sterling/FTSE relationship that we have talked about in the past. There has been a trend over the past year where increased Sterling purchasing sentiment can encourage selling in the FTSE and selling momentum in the Sterling can support the FTSE, which we saw once again at the end of the UK election. It certainly is a strange correlation, but it is thought to be supported by the mindset that when corporations on the FTSE exchange their earnings back into Sterling they are left with more currency.
While the attention around the United Kingdom is by all accounts going to remain centred around the political uncertainty, there is also key economic data to come out over the week ahead. The latest inflation reading, employment data and BoE interest rate decision are all scheduled to be announced in the next few days. When it comes to the jobs data and inflation numbers, the major headline will be whether further indications are provided that price pressures are increasing at a faster pace than wage growth. This is seen as a crucial factor in the possibility that consumer spending might be pressured over the upcoming months. By most accounts the Bank of England (BoE) is expected to leave interest rates unchanged as they have been for nearly a year, but it will be interesting to see if Governor Carney comments on the current political instability and what it means to the monetary policy outlook for the United Kingdom.
Time for another US interest rate rise?
Away from the United Kingdom and the ongoing political uncertainty that is dominating attention, the Federal Reserve is largely expected to raise US interest rates on Wednesday evening. Most of the expected US interest rate rise has already been priced into the Dollar, but the US currency might find support in the run up to the Federal Reserve decision. Will the probable US interest rate rise direct the Dollar over the longer-term? Not really, and as soon as the Fed most likely pulls the trigger on another rate rise on Wednesday, attention will circle towards when the central bank will next raise interest rates as it’s expected that another oneor two will be announced before the end of the year.
Any hesitance from the Federal Reserve when it comes to providing clarity on its future monetary policy outlook and interest rate circle will likely weigh on the Dollar as investors want clarity.
What about emerging market currencies?
The likelihood that the Federal Reserve will be raising US interest rates this coming week might put a pause to the recent rally we have witnessed in emerging market currencies, like the Malaysian Ringgit and Chinese Yuan.
Whether the emerging market currencies can later brush away the probable US interest rate hike this Wednesday will depend on the timing of the next interest rate rise from the United States, which by most accounts knowing the previous language from the Federal Reserve, will not include precise timing for the next rate increase and later support the emerging currencies. By most accounts the Dollar topped a long time ago, and this means those emerging currencies that were heavily pressured in the six months following US election day can continue to push on and attract buyers.
Update on WTI Oil
After a pressured couple of weeks following the OPEC meeting, WTI Oil has found support at $45 and is expected to attempt a recovery from here. There is still a risk that US inventories/shale production will offset the efforts from OPECNon-members when it comes to trimming the oversupply in the markets, however Oil looks oversold at $45 to my eye until we can see clear signs that there is increased inventories from the United States.