Sample Category Title
Politics Lifts Euro, Dollar Fed Focused
Three more central banks are slated to announce their respective policy decisions this week – the Fed (June 14), the Bank of England (June 15) and Bank of Japan (June 15).
The Fed starts its two-day meeting tomorrow and ends on Wednesday at which it is widely expected to increase its fed funds rate by +25 bps to +1% – +1.25%. The focus is on whether the Fed thinks the U.S. economy is robust enough to withstand further rate increases through this year. U.S policy makers are expected to raise interest rates twice more in 2017, but conviction for a move beyond this week has faded for many, along with the outlook for inflation.
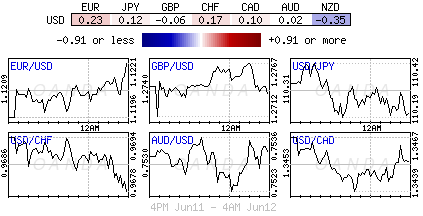
Note: The BoE and BoJ are anticipated to maintain their current policy rates of +0.25% and minus -0.1%.
Price data will also be released in the U.K, the Eurozone and Japan. Both the U.K and Australia will be reporting last months labor stats.
Geopolitical risks again will be an issue this week. Ongoing developments in the U.K following last week's snap election will be keeping U.K capital markets very busy, while Stateside, AG Jeff Sessions will face questions about the firing of FBI Director Comey and undeclared meetings with Russian officials at a U.S Senate hearing tomorrow.
1. Global stocks see 'Tech Red”
In Asia, Japan's Nikkei share average ended lower (-0.5%) overnight, dragged down by declines in technology shares after the Nasdaq 100 -2.4% plunge in Friday afternoons session. The broader Topix was little changed.
In South Korea, the Kospi lost -1%, with Samsung slumping -1.6%. In Hong Kong, the Hang Seng Index declined -1.1% – the most in nearly two months – as tech share selling triggered broader profit-taking in one of the world's best-performing equity markets this year.
In China, the Shanghai Composite Index retreated -0.6%, after a four-day rally, while markets in Australia, Malaysia and the Philippines were closed for holidays.
In Europe, indices trade lower across the board led by the tech sector continuing to see the brunt of the sell off after the sharp sell off in the Nasdaq on Friday – Nasdaq futures are down a further -1% ahead of the U.S open.
U.S stocks are set to open in the ‘red.'
Indices: Stoxx50 -0.9% at 3556, FTSE -0.4% at 7499, DAX -0.6% at 12735, CAC-40 -0.8% at 5256, IBEX-35 -1.2% at 10845, FTSE MIB -0.6% at 20990, SMI -0.3% at 8818, S&P 500 Futures -0.3%.
2. Oil prices supported by future bets, gold shines
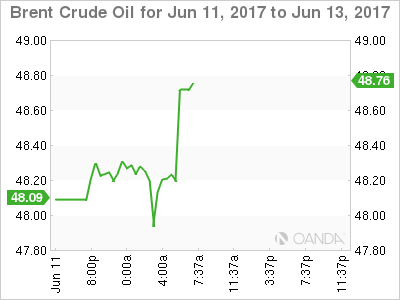
Oil spot prices have rallied overnight as futures traders lay bets that the market may have bottomed after the recent -10% falls, and this despite the physical market remaining bloated, especially from an upticks in U.S production drilling numbers.
Brent crude futures is at +$48.29 per barrel, up +14c, or +0.3% from Friday's close. U.S. West Texas Intermediate (WTI) crude futures is at +$45.95 per barrel, up +12c, or +0.3%.
Note: U.S drillers' added eight oilrigs in the week to June 9, bringing the total count up to +741, the most since April 2015 (Baker Hughes Inc.).
The drive to find new oil has pushed up U.S output by over +10% since mid-2016, to +9.3m bpd. The EIA expects this number to push above the +10m benchmark next year.
For the oil ‘bear' U.S production undermines any effort led by OPEC to cut almost -1.8m bpd of production until the Q1, 2018 in order to prop up global prices.
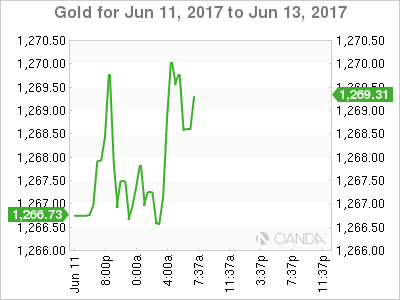
Gold prices (up +0.1% at +$1,266.90 an ounce) have inched up ahead of the U.S open as global stocks fall and as the ‘big' dollar eases ahead of the Fed announcement that many hope will give clues on the pace of interest rate hikes over the rest of the year.
3. U.S yields back up
Friday's sell-off in U.S Treasuries suggests that the market is preparing for a crowded U.S auction calendar this week. Dealers backed up yields to make room to take down 3-, 10- and 30-year debt.
Note: The yield on 10-year U.S Treasuries is heading higher for a fourth day, advancing +2 bps to +2.22%.
The pending Fed rate announcement has also put the U.S short-end under pressure in anticipation of another interest rate increase on Wednesday. Fed fund futures are pricing in a +93% chance of a rate hike. The markets focus will be on rhetoric that may give a clue on the pace of future rate hikes.
Dollar ‘bulls' are concerned that the Fed could come across as ‘dovish' at this week's meeting given the lack of domestic wage and inflation pressure.
Elsewhere, U.K Gilt yields are flat (+0.97%) after dropping -3 bps on Friday. French (OAT's) yields fell -2 bps to +0.60%, while German Bunds are little changed (+0.24%).
4. 'Big' dollar's mixed results
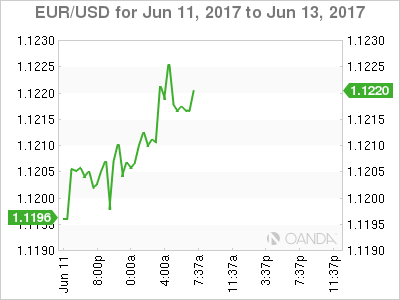
The EUR is firmer outright (+0.2% at €1.1222) as regional geopolitical concerns ease a little over the weekend.
In France, President Macron's La Republique en Marche made big gains in the first round of parliamentary elections on Sunday (see below), while in Italy, the anti-establishment 5-Start Movement suffered setbacks in municipal elections.
The focus this week is on a likely U.S Fed rate rise on Wednesday. However, this is widely expected and with investors looking towards the prospect of the ECB scaling back monetary easing, immediate dollar gains are being considered somewhat limited.
In the U.K, 'uncertainty” is expected to dominate the various asset prices with risks looking tilted towards further downside pressure for the pound (£1.2700) as investors wait for clues on what might happen next.
The outcome of the election is likely to change U.K Brexit policies now that PM May is trying to enter a coalition with Ulster's DUP.
USD/JPY continues to straddle atop of the psychological ¥110.00 handle. Ahead of this week's Bank of Japan (BoJ) meeting, overnight tier II data (May preliminary machine tool orders y/y- 24.4% vs. 34.7% prior) continues to give little justification for rumored discussion about their QE exit process.
5. President Macron wins handily, but on low turnout
A first-round French parliamentary election result is promising President Macron a crushing majority in parliament, however, the result appears on the back of the lowest voter turnout in modern history.
Pollsters said Macron was on course to win as much as three quarters of National Assembly seats in the June 18 second round after +28% of those who voted in first round chose his Republic on the Move (LREM) party.
It's expected to be France's biggest majority in decades, and according to analysts it effectively leaves only the trade union movement as a potential obstacle to the Macron's pro-business he has promised to introduce in a bid to boost domestic growth and jobs.
GOLD Trading Lower Within Uptrend Channel, SILVER Lack Of Follow-Through, CRUDE OIL Bearish Momentum Is Fading.
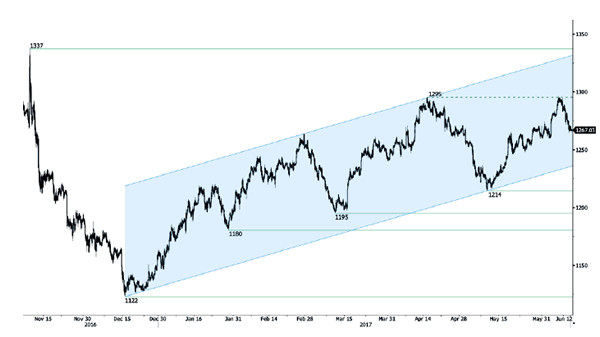
GOLD Trading lower within uptrend channel.
Gold is consolidating within uptrend channel. Hourly support is located at 1246 (18/05/2017 low). Stronger support is given at 1195 (10/03/2017 low). Expected to show renewed upside pressures.
In the long-term, the technical structure suggests that there is a growing upside momentum. A break of 1392 (17/03/2014) is necessary ton confirm it, A major support can be found at 1045 (05/02/2010 low).
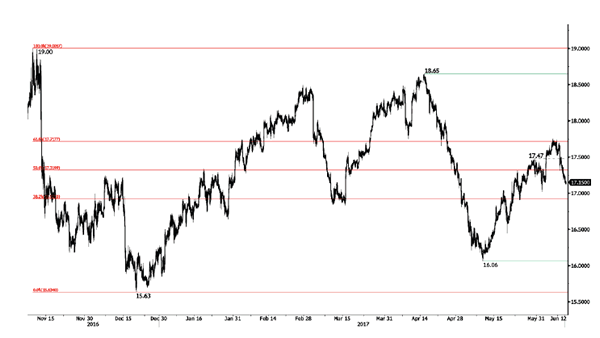
SILVER Lack of follow-through.
Silver declines. Closest support is given at 16.20 (04/05/2017 low). Strong support is given at 15.63 (20/12/2017 low). Key resistance is given at a distance at 19.00 (09/11/2017 high). Expected to push back towards 61.8% Fibonacci retracement around 17.75.
In the long-term, the death cross indicates that further downsides are very likely. Resistance is located at 25.11 (28/08/2013 high). Strong support can be found at 11.75 (20/04/2009).
CRUDE OIL Bearish momentum is fading.
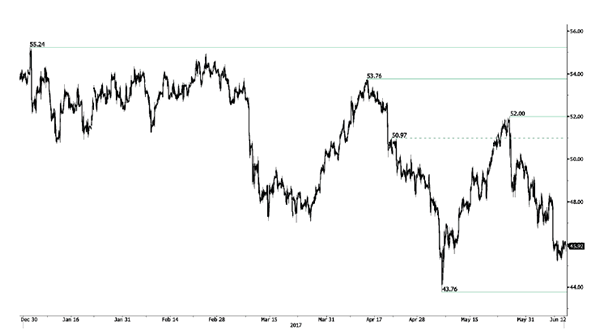
Crude Oil 's decline is stopping since the recent collapse from $52. Support is given at a distance 43.76 (05/05/2017 low). The technical structure suggests further weakness towards 43.76.
In the long-term, crude oil has recovered after its sharp decline last year. However, we consider that further weakness are very likely. Strong support lies at 24.82 (13/11/2002) while resistance can now be found at 55.24 (03/01/2017 high)
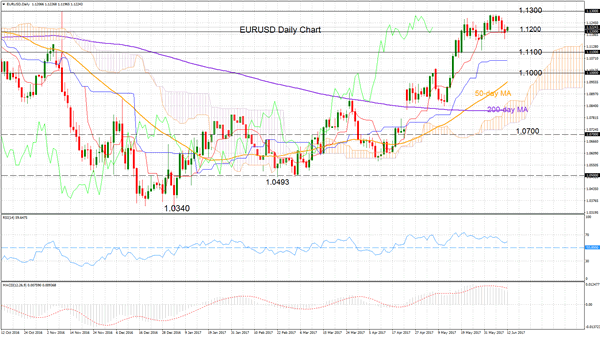
EURUSD Consolidating after Pausing Uptrend Below 1.1300
EURUSD is consolidating after pausing its recent uptrend. The market was unable to rise above the key 1.1300 level and has now found support around another important psychological level at 1.1200. This support area is also highlighted by the tenkan-sen line.
The bullish market structure that has been in place since the rise from the January 3 low of 1.0340 to the six-month high of 1.1284 is still intact. Upside pressure has faded and this is indicated by the RSI which has turned back down. The MACD has also stopped rising. This has resulted in a neutral bias in the near-term.
A daily close below 1.1200 would target further support at 1.1100 and 1.1000. Below this, the bias to the downside could gain momentum with scope for prices to fall to the 200-day moving average around 1.0817. A break below this would change the bigger picture and the medium-term trend would shift to neutral from bullish.
The market would have to rise above 1.1300 to resume the uptrend and target 1.1400. the bullish crossover of the 50-day moving average above the 200-day MA and the rising ichimoku cloud are supporting the bullish outlook for now. Meanwhile, the RSI and MACD remain in bullish territory.
UK Politics Stay In The Spotlight
After the Conservatives defeat in Thursday's UK election, the main question on most investors' mind is: What happens next and how will this affect the Brexit negotiating process? On Saturday morning, PM May's office said it had agreed an outline deal with Northern Ireland's Democratic Unionist Party, in which the DUP would support the Tories on some key votes. Nevertheless, hours after the announcement, May's office admitted that the accord is not yet finalized.
Meanwhile, the leader of the Labour Party, Jeremy Corbyn noted that he will put forward an alternative government program and invite lawmakers to vote for it, hoping that MPs will vote down the Queen's Speech, which is scheduled on the 19th of June (the same day as UK-EU negotiations are set to begin).
'I think it's quite possible there'll be an election later this year or early next year, and that might be a good thing because we cannot go on with a period of great instability', Corbyn also noted.
The defeat of Theresa May and the Conservatives may be seen as a rejection of her 'hard Brexit' stance by the British people. As such, she may have to soften her approach. If so, something like that could be interpreted as positive for the pound, but given the current uncertainty surrounding the agreement with the DUP and the Queen's speech, we expect sterling to remain under pressure in the short run.
GBP/USD rebounded from slightly above the 1.2615 (S1) support zone on Friday, after it collapsed from near 1.2960 on the election's first exit poll. At the time of writing, the pair is testing the 1.2770 (R1) as a resistance, where a decisive break may open the way for the 1.2850 (R2) territory. Nevertheless, given that the pair is now trading back below the key hurdle of 1.2850 (R2), and also below the downside resistance line taken from the peak of the 18th of May, we would treat any possible intraday recovery as a corrective phase. We expect the bears to take the reins again soon, and perhaps drive the battle back down near the 1.2700 (S1) support. A dip below that level, may set the stage for a test at the next support of 1.2615 (S2).
CAD strengthens on stellar employment gains
On Friday, Canada's employment report showed that the economy added 54.5k jobs in May, beating estimates of 11k. The employment gains were driven by the 77k increase in full-time jobs, which more than offset the 22k slide in part-time employment. The unemployment rate ticked up to 6.6% from 6.5% in April, but this was due to the entry of 78.4k people into the labor force.
USD/CAD slid on the release as these encouraging news increase the likelihood for the BoC to maintain its balanced tone at its upcoming policy gathering, on the 12th of July. The pair fell below the support (now turned into resistance) of 1.3485 (R1), to stop once again near the 1.3420 (S1) zone. The pair has been trading within a sideways range between that level and the resistance of 1.3540 (R2) since the 25th of May and as such, we consider the short-term outlook to be flat for now. However, given that the rate is trading below the important territory of 1.3600 (R3), we see the likelihood for the pair to trend lower again in the foreseeable future. A dip below 1.3420 (S1) could confirm the case and may initially aim for our next obstacle of 1.3380 (S2).
As for today, we have a relatively quiet day, with no major events or indicators due to be released.
As for the rest of the week:
On Tuesday, we get the UK CPI data for May. Also, the new UK Parliament meets for the first time. On Wednesday, all eyes will be on the FOMC policy decision. The Fed is almost certain to hike rates and thus, the focus will be on any signals regarding the pace of future hikes. As for the data, we get US CPI and retail sales for May. The UK employment report is also coming out. On Thursday, the BoE and the SNB hold their meetings. Neither Bank is expected to alter its monetary policy. On the indicators' front, we get New Zealand's GDP for Q1, Australia's employment figures for May, and UK retail sales for the same month. Finally on Friday, we have a BoJ gathering. The Bank could shift to a slightly more upbeat tone given the recent improvement in Japan's economic data.
GBP/USD
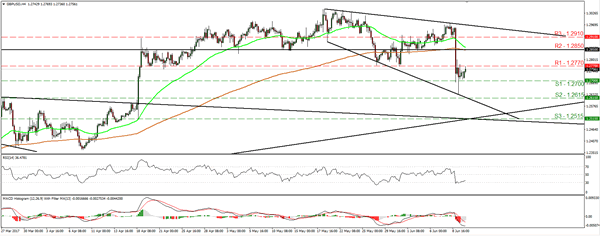
Support: 1.2700 (S1), 1.2615 (S2), 1.2515 (S3)
Resistance: 1.2770 (R1), 1.2850 (R2), 1.2910 (R3)
USD/CAD
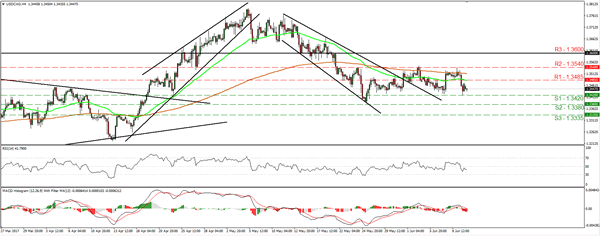
Support: 1.3420 (S1), 1.3380 (S2), 1.3335 (S3)
Resistance: 1.3485 (R1), 1.3540 (R2), 1.3600 (R3)
EUR/JPY Fading Momentum, EUR/GBP Volatility Declines, EUR/CHF Pausing On Short-Squeeze.
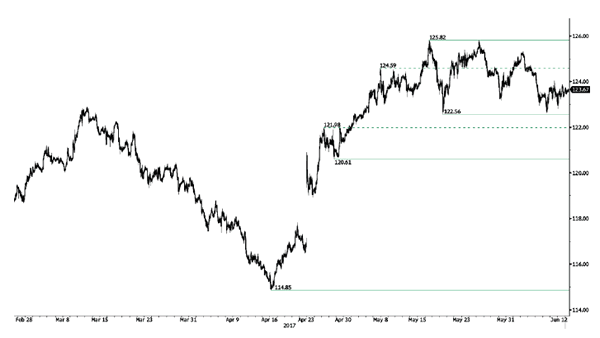
EUR/JPY Fading momentum.
EUR/JPY is trading lower. Hourly support is given at 122.56 (18/05/2017 low). Hourly resistance can be found at 125.82 (16/05/2017 high). Major support is given at 114.90 (18/04/2017low).
In the longer term, the technical structure validates a medium-term succession of lower highs and lower lows. As a result, the resistance at 149.78 (08/12/2014 high) has likely marked the end of the rise that started in July 2012. Strong support at 94.12 (24/07/2012 low) looks nonetheless far away.
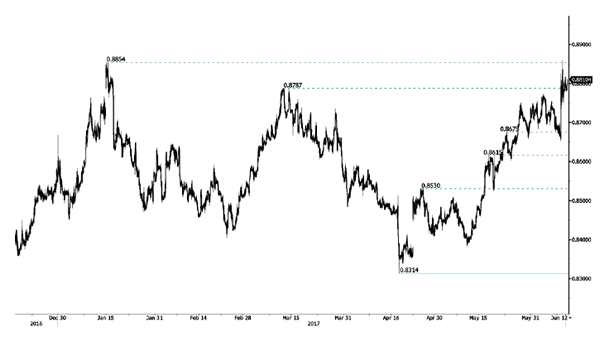
EUR/GBP Volatility declines.
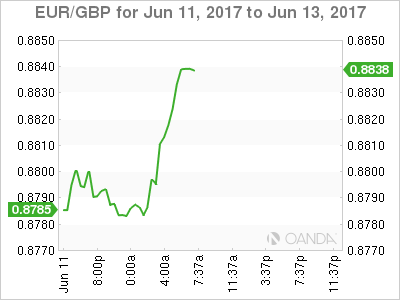
EUR/GBP has broken resistance at 0.8787 (13/03/2017 high). The pair keeps on going higher. Strong support can be found at 0.8304 (05/12/2017 low).
In the long-term, the pair has largely recovered from recent lows in 2015. The technical structure suggests a growing upside momentum. The pair is trading above from its 200 DMA. Strong resistance can be found at 0.9500 psychological level.
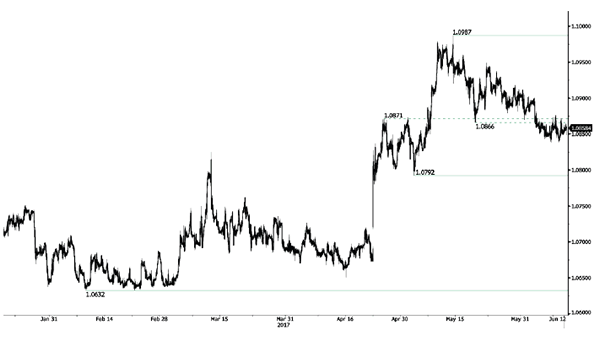
EUR/CHF Pausing on short-squeeze.
USD/CHF is trading lower. The pair has broken support given at 1.0866 (18/05/2017 low). We believe that the medium-term pattern suggests us to see continued bearish pressures towards hourly support that can be found at 1.0792 (03/05/2017 low).
In the longer term, the technical structure is mixed. Resistance can be found at 1.1200 (04/02/2015 high). Yet,the ECB's QE programme is likely to cause persistent selling pressures on the euro, which should weigh on EUR/CHF. Supports can be found at 1.0184 (28/01/2015 low) and 1.0082 (27/01/2015 low).
USD/CHF Back To Bearish, USD/CAD Trading Mixed, AUD/USD Short-Term Consolidation.
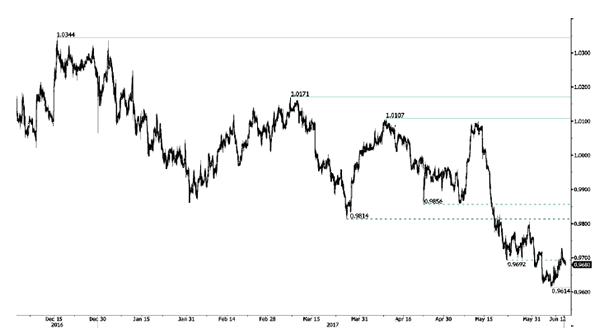
USD/CHF Back to bearish.
USD/CHF continues its decline despite some ongoing consolidation. Hourly resistance can be found at 0.9808 (30/05/2017 high). Strong resistance is given at 1.0107 (10/04/2017 high). Expected to show continued weakness towards strong support at 0.9550 (09/11/2017 low).
In the long-term, the pair is still trading in range since 2011 despite some turmoil when the SNB unpegged the CHF. Key support can be found 0.8986 (30/01/2015 low). The technical structure favours nonetheless a long term bullish bias since the unpeg in January 2015
USD/CAD Trading mixed.
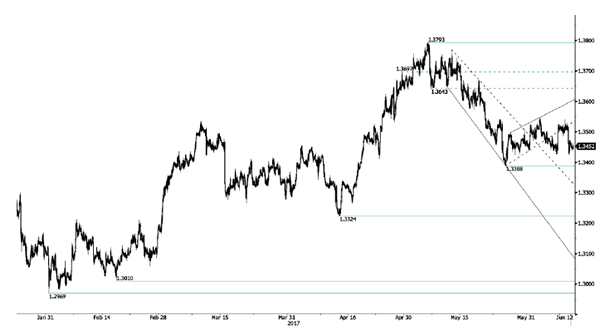
USD/CAD is trading sideways. Hourly support can be found at 1.3388 (25/01/2017 high). Expected to show continued weakness.
In the longer term, there is now a death cross with the 50 dma crossing below the 200 dma indicating further downside pressures. Strong resistance is given at 1.4690 (22/01/2016 high). Long-term support can be found at 1.2461 (16/03/2015 low
AUD/USD Short-term consolidation.
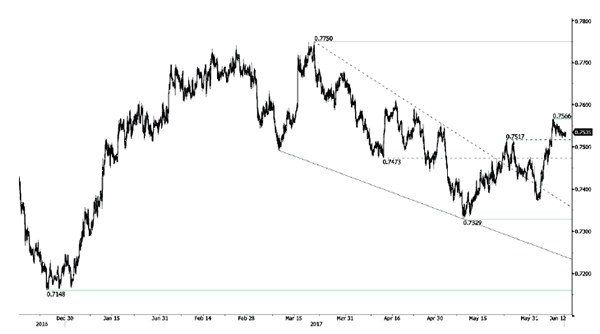
AUD/USD is pushing higher since the pair has failed to reach hourly support given at 0.7329 (09/05/2017 low). As long as prices remain below resistance at 0.7608 (17/04/2017 high), there are nonetheless strong downside risks.
In the long-term, we are waiting for further signs that the current downtrend is ending. Key supports stand at 0.6009 (31/10/2008 low) . A break of the key resistance at 0.8295 (15/01/2015 high) is needed to invalidate our long-term bearish view.
EUR/USD Sideways Price Action, GBP/USD Consolidating, USD/JPY Bearish Pressures Arise.
EUR/USD Sideways price action.
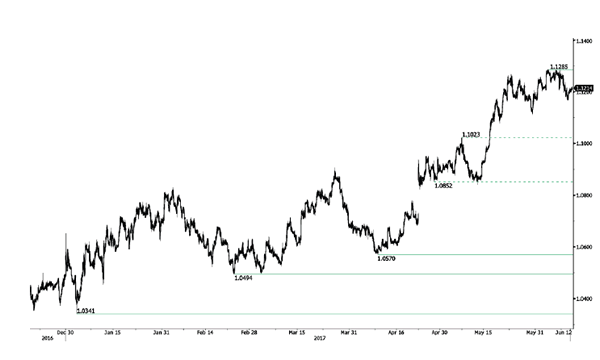
EUR/USD is trading mixed below strong resistance given at 1.1300 (09/11/2017 high). Hourly support is given at 1.1110 (22/05/2017 low) has been broken. Stronger support lies at 1.0842 (11/05/2017 low) and key support is given at 1.0494 (22/02/2017 low). Expected to show renewed bullish pressures.
In the longer term, the death cross late October indicated a further bearish bias. The pair has broken key support given at 1.0458 (16/03/2015 low). Key resistance holds at 1.1714 (24/08/2015 high). Expected to head towards parity.
GBP/USD Consolidating.
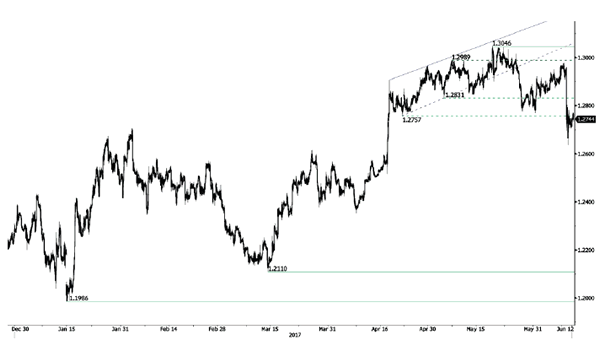
GBP/USD is now consolidating around former hourly support given at 1.2757 (21/04/2017 low). Hourly resistance lies at 1.3046 (18/05/2017 high). Expected to show further decline.
The long-term technical pattern is even more negative since the Brexit vote has paved the way for further decline. Long-term support given at 1.0520 (01/03/85) represents a decent target. Long-term resistance is given at 1.5018 (24/06/2015) and would indicate a long-term reversal in the negative trend. Yet, it is very unlikely at the moment.
USD/JPY Bearish pressures arise.
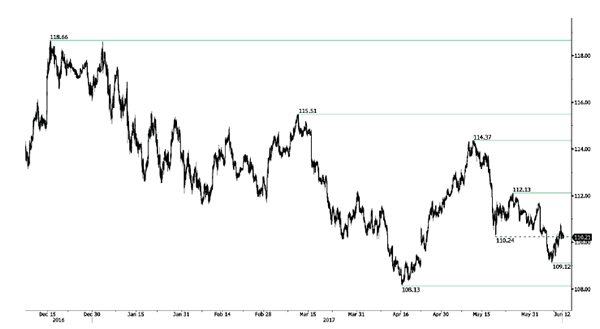
USD/JPY's short-term bearish pressures are back. The pair is bouncing lower. Hourly support can be found at 109.12 (07/06/2017 high). Strong support is located at 108.13 (17/04/2017 low). Hourly resistance is given at 112.13 (24/05/2017 high). Other key supports lie at a distance 106.04 (11/11/2016 low). Wide-open for further decline.
We favor a long-term bearish bias. Support is now given at 96.57 (10/08/2013 low). A gradual rise towards the major resistance at 135.15 (01/02/2002 high) seems absolutely unlikely. Expected to decline further support at 93.79 (13/06/2013 low).
Technical Outlook: Spot Gold – Near-Term Bears Are Taking A Breather, Eyes Are On Fed
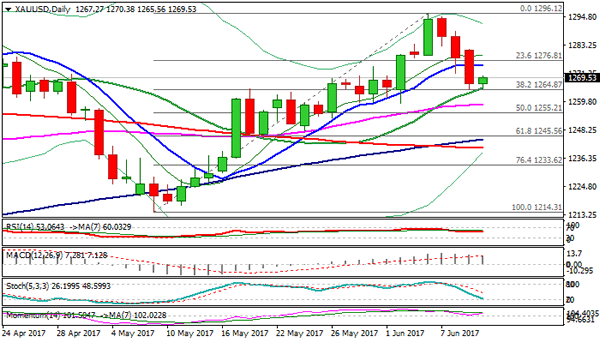
Spot Gold bounced to $1270 high on Monday after last week's strong three-day acceleration from $1295 high found support at $1264 (Fibo 38.2% of $1214/$1296, 09 May/06 June rally, reinforced by rising 20SMA).
Correction from $1295 should be ideally contained here in order to keep overall bulls intact for fresh attempts towards psychological $1300. Traders keep an eye on the UK, as increased political uncertainty may increase demand for safe haven gold.
But ob the other side, rising pressure come from widely expected Fed's rate hike on Wednesday, when FOMC two-day meeting ends that may put gold price, sensitive on changes of US interest rates, under increased pressure.
Loss of $1264 handle would expose supports at $1258 (55SMA), $1255 (50% retracement) and $1245 (Fibo 61.8% of $1214/$1296).
Limited correction is expected with 10SMA/daily Tenkan-sen ($1275/$1277) expected to cap.
Res: 1270, 1275, 1277, 1281
Sup: 1264, 1258, 1255, 1245
Trade Idea: GBP/USD – Sell at 1.2820
GBP/USD – 1.2732
Recent wave: Wave V of larger degree wave (III) has ended at 1.1986 and major correction has commenced from there for gain to 1.3000 and 1.3140-50
Trend: Near term up
Original strategy :
Sell at 1.2800, Target: 1.2600, Stop: 1.2860
Position: -
Target: -
Stop: -
New strategy :
Sell at 1.2820, Target: 1.2620, Stop: 1.2880
Position: -
Target: -
Stop:-
As the British pound recovered after falling to 1.2635 on Friday, suggesting consolidation above this level would be seen and another bounce to 1.2780 cannot be ruled out, however, reckon upside would be limited to 1.2820-30 and bring another decline, below said support at 1.2635 would extend recent decline from 1.3048 for retracement of recent upmove to 1.2600 but near term oversold condition should limit downside to 1.2550 and reckon previous support at 1.2515 would hold from here.
Our preferred count on the daily chart is that cable's rebound from 1.3500 (wave (A) trough) is unfolding as a wave (B) with A ended at 1.7043, followed by triangle wave B and wave C as well as wave (B) has ended at 1.7192, the subsequent selloff is the larger degree wave (C) which is still unfolding with minor wave (III) of larger degree wave 3 ended at 1.1986, hence wave (IV) correction is in progress which could either be a triangle wave (IV) of a complex formation but upside should be limited to 1.3500 and price should falter well below 1.4000, bring another decline in wave (V) of 3 for weakness to 1.1500, then 1.1200.
On the upside, expect recovery to be limited to 1.2780-90 and 1.2830 should hold, bring another decline. Above 1.2860-70 would defer and suggest low is possibly formed instead, risk a stronger rebound towards 1.2900 but price should falter well below this week’s high at 1.2978 and bring another decline later.

EUR/USD Analysis: Near 1.12 Mark On Monday
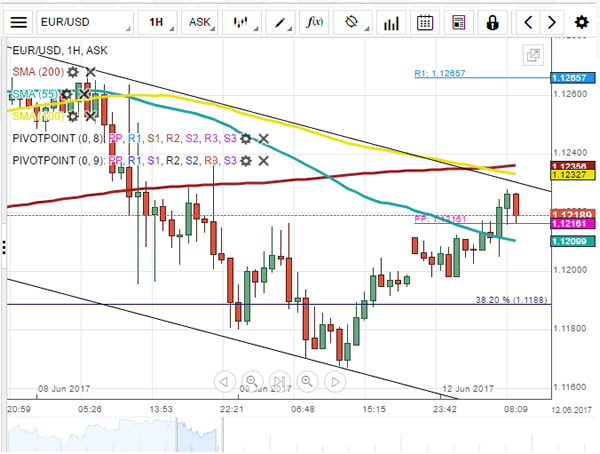
The common European currency rebounded in the second half of Friday's trading against the US Dollar, and the pair extended the gains into Monday's trading. However, various signs are indicating that a reversal of the direction of the currency pair might soon occur. First of all the hourly chart reveals that the Euro has encountered the resistance of the 55-hour SMA at 1.1212 and the newly calculated weekly PP at 1.1216. In addition, a descending short term channel has been identified. In accordance with the pattern even if the rate passes the mentioned resistance levels, it will still face the combined resistance of the channel's upper trend line and the 100 and 200-hour SMAs. All of these resistance levels are slowly moving lower.