Sample Category Title
GBP/USD Daily Outlook
Daily Pivots: (S1) 1.2598; (P) 1.2775; (R1) 1.2915; More...
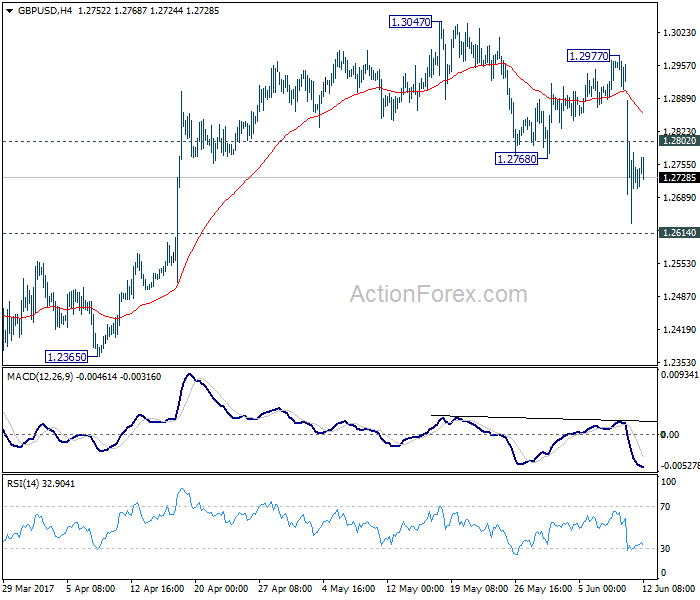
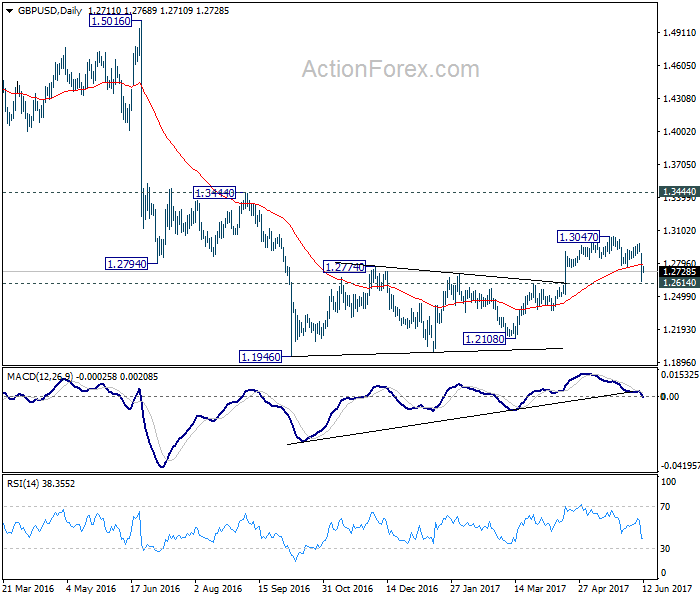
With 1.2802 minor resistance, intraday bias in GBP/USD remains on the downside. We're favoring the case that consolidation pattern from 1.1946 has completed at 1.3047 already. Break of 1.2614 resistance turned support would confirm our bearish view and target a test on 1.1946 low next. On the upside, above 1.2802 will bring turn bias neutral and bring recovery. But outlook will remain bearish as long as 1.2977 resistance holds.
In the bigger picture, fall from 1.7190 is seen as part of the down trend from 2.1161. Price actions from 1.1946 medium term low are seen as a consolidation pattern, which could have completed after hitting 55 week EMA. Break of 1.1946 low will target 61.8% projection of 1.5016 to 1.1946 from 1.3047 at 1.1150 next. In case the consolidation from 1.1946 extends, outlook will stay remain bearish as long as 1.3444 resistance holds.
UK Manufacturing and Industrial Data Miss Expectations, Trade Gap Narrows To £10.4B In April
'The subdued performance in the economy throws the political turmoil of a hung parliament into sharp relief.' — Jagjit Chadha, NIESR
British manufacturing and industrial production rose less than expected in April but broke, following three consecutive months of declines. The Office for National Statistics reported on Friday that manufacturing production climbed 0.2% on a seasonally adjusted basis in April, falling behind expectations for a 0.8% rebound and following the preceding month's drop of 0.6%. On a yearly basis, manufacturing production remained unchanged in the reported month, after climbing 2.2% in March. Friday's report also showed that industrial production in Britain advanced 0.2% month-over-month in April, compared to the previous month's fall of 0.5%, although analysts anticipated an increase of 0.7%. On an annual basis, industrial production declined 0.8% during the reported month, following the preceding month's climb of 1.4%. Other report released by the ONS on Friday showed that the country's goods trade gap narrowed to £10.4B in April, whereas the prior month's trade deficit of £13.4B was revised down to £12.0B. The narrowing of the gap was driven mainly by lower imports that dropped more than 5% in April.
Canadian Employment Data Comes Out Stronger Than Expected
'After a rocking first quarter, it's tough to deny that the Canadian economy is looking much healthier.' — Benjamin Reitzes, BMO Capital Markets
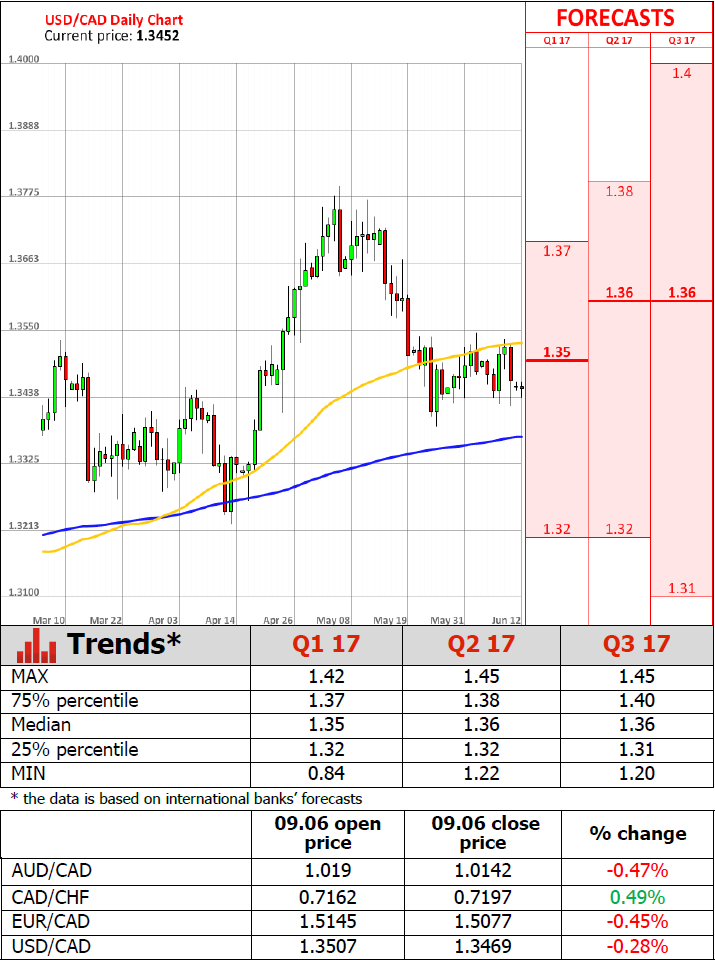
Canadian job growth rose at its fastest pace in eight months in May with the largest gains registered in the manufacturing and professional services sectors, official figures showed on Friday. Statistics Canada reported that employers created 54.5K jobs last month, following April's gain of just 3.2K jobs, whereas analysts anticipated a gain of 11.5K positions in May. Meanwhile, the jobless rate rose to 6.6% during the reported month from April's 6.5%, meeting economists' expectations. The labour force participation rate climbed to 65.8% in May, following the prior month's 65.6%. Average hourly earnings were up 1% year-over-year in the fifth month of the year, compared to the previous month's increase of 0.5%. The wage increase is set to please the Bank of Canada that pointed to subdued wage growth at its latest meeting. The manufacturing sector added 25.3K jobs to the economy in May, the professional and scientific services sector – 25.9K. Overall, the services sector added 31.3K jobs to the economy in May, whereas the goods-producing sectors hired 23.3K people last moth.
Trade Idea: EUR/JPY – Stand aside
EUR/JPY - 123.49
Recent wave: wave v of (C) ended at 94.12 and major correction in wave A has ended at 149.79
Trend: Near term up
New strategy :
Stand aside
Position: -
Target: -
Stop:-
The single currency has remained confined within familiar range and further sideways trading is in store, whilst recovery to 124.10-20 cannot be ruled out, a break of 124.70-75 is needed to signal the retreat from 125.81 has ended, bring a stronger rebound to 125.00 but resistance at 125.31 should remain intact, bring retreat later.
On the downside, below indicated strong support at 122.56-63 would signal another leg of corrective decline from 125.82 top is underway for retracement of early upmove to 122.00, then towards 121.25-30 but oversold condition should limit downside and reckon latter level would remain intact, bring rebound later.
Our latest preferred count is that wave (ii) is ABC-X-ABC which ended at 123.33 and wave (iii) is unfolding with wave iii ended at 100.77, followed by wave iv at 111.57 and wave v as well as the wave (iii) has ended at 97.04, followed by wave (iv) at 111.43 and wave (v) has ended at 94.12 which is also the end of the larger degree v, this also implied the major wave (C) has also ended there, hence major correction has commenced from there with (A) leg unfolding in its lower degree wave c which has possibly ended at 145.69. Under this count, A-B-C wave (B) has commenced with A leg ended at 136.23, wave B at 143.79 and wave C has possibly ended at 149.79.
Our larger degree count is that the decline from 139.26 is wave (C) and is sub-divided into a diagonal triangle i-ii-iii-iv-v with wave i - 105.44, wave ii- 123.33, wave iii - 97.03, wave iv - 111.43, followed by the final wave v as well as the end of wave (C) at 94.12, this also mark the bottom of larger degree wave B. Under this count, major rise in wave C has commenced as an impulsive wave with minor wave III ended at 145.69, wave V is still in progress for further gain to 150.00. Having said that, this so-called wave V could well be the first leg of larger degree 5-waver wave C and this wave C should bring at least a retest of wave A top at 169.97 (July 2008).

USD/CHF Daily Outlook
Daily Pivots: (S1) 0.9654; (P) 0.9690; (R1) 0.9729; More.....
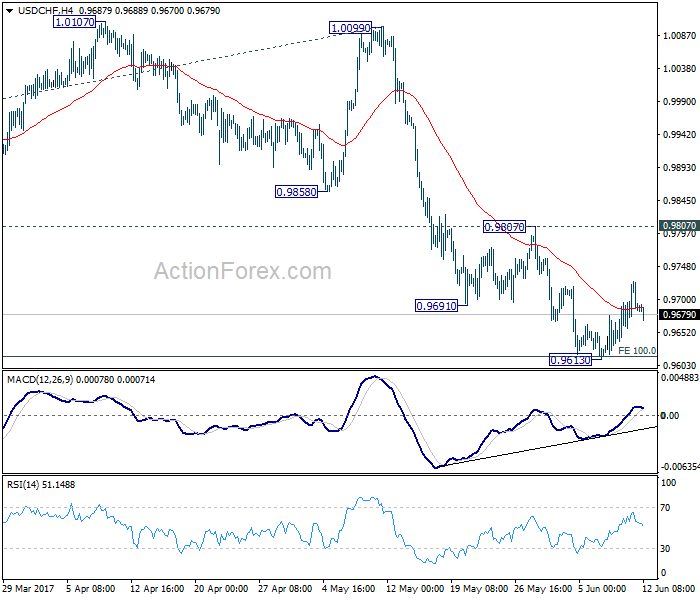
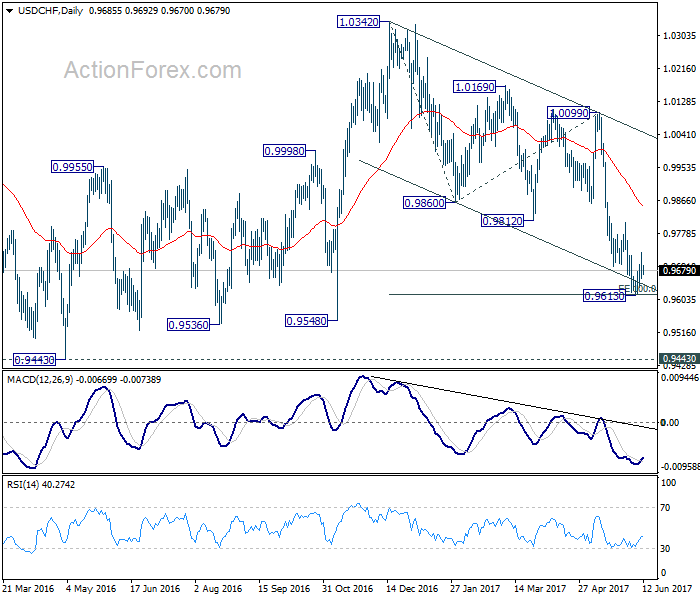
Intraday bias in USD/CHF remains neutral as the correction from 0.9613 is still in progress. With 0.9807 resistance holds, near term outlook remains bearish. Break of 0.9613 will extend the whole fall from 1.0342 to 0.9548 support and below. We'd start to look for bottoming signal again as it approaches 0.9443 key support level. However, considering bullish convergence condition in 4 hour MACD, break of 0.9807 will indicate near term reversal and turn outlook bullish for 1.0099 resistance next.
In the bigger picture, USD/CHF is still bounded in medium term range of 0.9443/1.0342 for the moment. Consolidative trading would likely continue and medium term outlook remains neutral. Break of 1.0342 key resistance is needed to confirm underlying bullish momentum in the pair. Meanwhile, downside attempts should be contained by 0.9443 key support level. However, sustained break of 0.9443 will carry larger bearish implication and target 0.9 handle.
Will A Hung Parliament Lead To A Softer Brexit ?
The outcome of the UK general election turned out to be that the Tories won 318 seats, the Labour 262, the SNP 35, the Lib Dems 12 and the DUP 10. None of the parties won more than 326 seats, indicating a Hung Parliament.
The Tories lost their majority, now having even less seats than they had before the election. Conversely, the Labour Party saw an increase of more than 30 seats, the Labour's dominance in the House of Commons is now expanding. The UK's political climate has been changed from now on.
The Tories are currently seeking a coalition with the DUP (Democratic Unionist Party). The DUP is the biggest party in North Ireland, which won 10 seats after the election. Nevertheless, the coalition is likely to be loose as there are plenty of differences between the two parties' political stances.
Regardless of whether the Tories can successfully form a coalition with the DUP, Theresa May will face continuous pressure of stepping down over the following months, especially from her party, as her gamble resulted in the Tories lost a majority. The uncertainties associated with a Hung Parliament and a prospective change of the Prime Minister, weighing on the UK's political prospects.
The Brexit negotiations are due to start on June 19th. Compared to Theresa May's former statement, “no deal is better than a bad deal”, the Labour leader Corbyn has pledge that a Brexit deal will be done, he also strives to make the UK staying in the single market and custom union. As the Labour's dominance has been increased, it implies the Brexit process will likely to be softer.
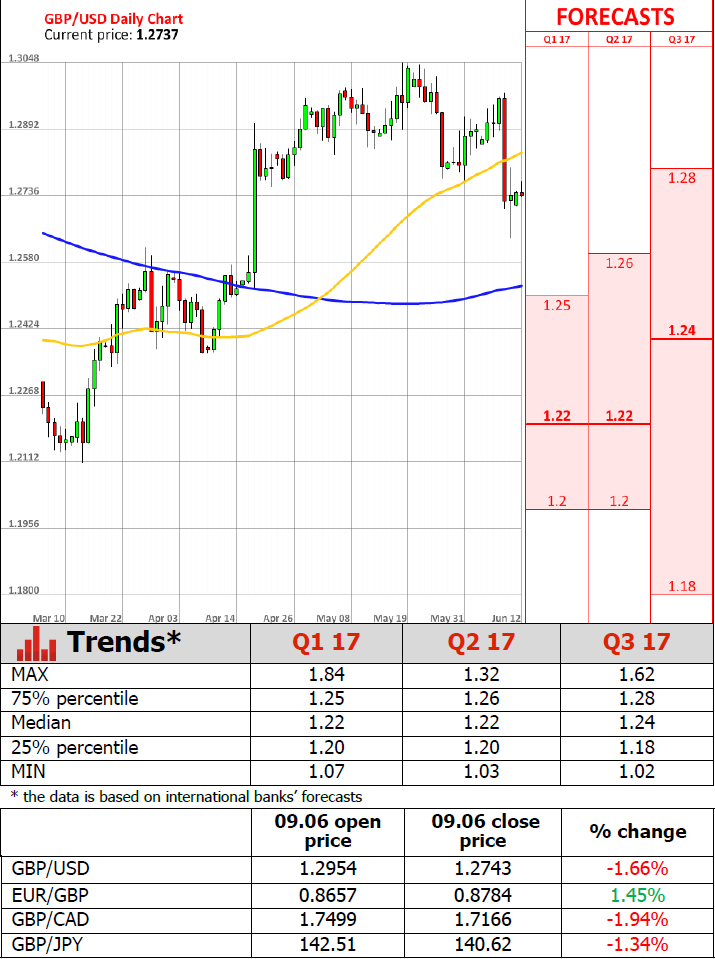
GBP/USD has been consolidating in a range between 1.2700 – 1.2800, after hitting a 7-and-a-half week low of 1.2634 on Friday. EUR/GBP hit a high of 0.8858 on Friday, last seen on November 9th, then it saw a subsequent consolidation in a range between 0.8770 – 0.8820. GBP/JPY hit a low of 139.50, last seen on April 21, then it saw a consolidation, holding above the psychological support line at 140.00.
The UK inflation report hearing will be released at 11:00 BST this morning. The UK inflation data (CPI and PPI) for May will be released at 09:30 BST on Tuesday. it will likely affect GBP crosses.
Technical Outlook: USDJPY – 200SMA Caps Recovery And Keeps Overall Bears Intact
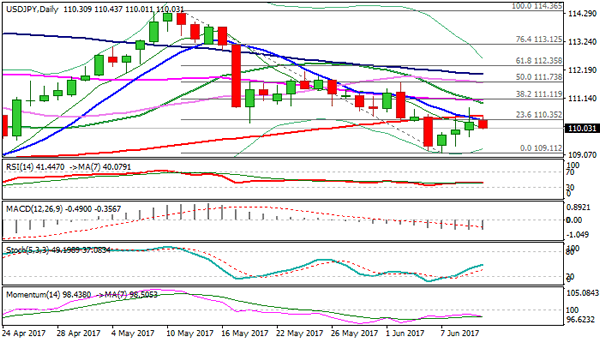
Three-day recovery rally stays capped under 200SMA (110.51), following Friday's short-lived spike to 110.81. Resistance is reinforced by daily Tenkan-sen (110.41) with multiple bear-crosses of daily MA's, maintaining strong pressure. Probe through temporary support at 110.16, provided by hourly 55SMA/Fibo 38.2% of 109.11/110.81 upleg is bearish signal and extension below 110.00/109.76 pivots is needed to confirm lower top at 110.81 and shift focus towards 109.11 (07 June low). Alternative scenario requires sustained break above 200SMA to dent overall bearish structure for extended correction towards next pivotal barrier at 111.11 (Fibo 38.2% of 114.35/109.11, reinforced by 20/55SMA bear-cross).
Res: 110.41, 110.51, 111.11, 111.70
Sup: 110.00, 109.76, 109.38, 109.11
USD/JPY Daily Outlook
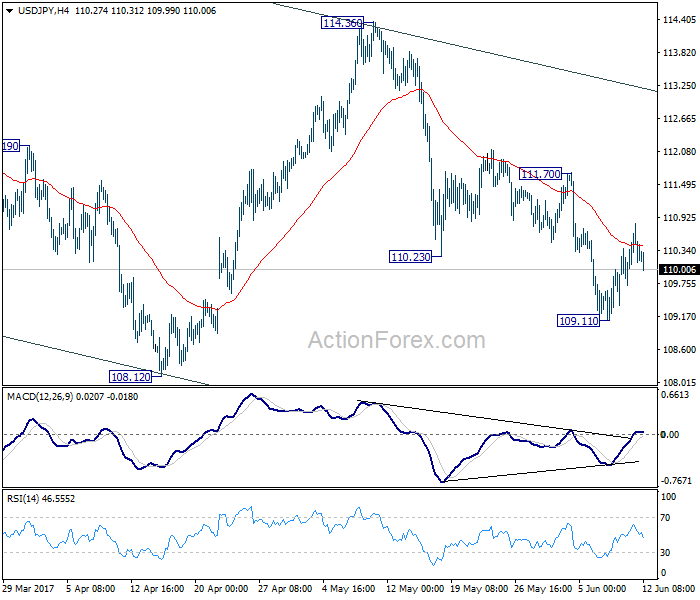
Daily Pivots: (S1) 109.74; (P) 110.28; (R1) 110.85; More...
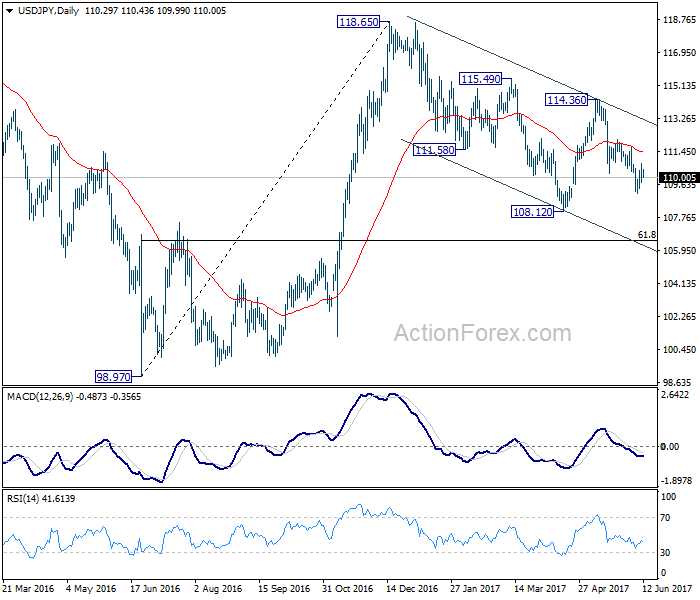
Intraday bias in USD/JPY remains neutral for the moment. As long as 111.70 resistance holds, near term outlook remains mildly bearish and deeper fall is expected. Below 109.11 will target 108.12 low first. Break will extend the whole corrective fall from 118.65 to 61.8% retracement of 98.97 to 118.65 at 106.48. We will look for bottoming sign there. Meanwhile, break of 110.70 will suggest near term reversal and turn bias back to the upside for 114.36 resistance instead.
In the bigger picture, price actions from 125.85 high are seen as a corrective pattern. It's uncertain whether it's completed yet. But in case of another fall, downside should be contained by 61.8% retracement of 75.56 to 125.85 at 94.77 to bring rebound. Overall, rise from 75.56 is still expected to resume later after the correction from 125.85 completes.
Technical Outlook: GBPUSD – Friday’s Long Red Candle Weighs, Daily Cloud Top To Ideally Cap Correction
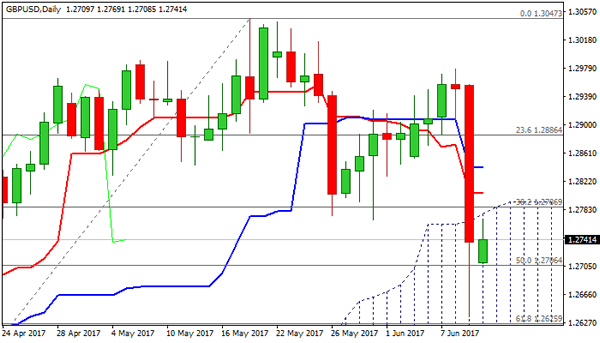
Cable is in near-term recovery from last week's low at 1.2635, where pound fell after disappointing results of UK election.
Limited corrective action is expected, with daily cloud/55SMA offering strong barrier at 1.2776, which should ideally cap.
Friday's long red daily candle weighs heavily for renewed downside attempts towards targets at 1.2619 (100SMA), 1.2573 (200SMA) and 1.2548 (daily cloud base).
Daily Tenkan-sen (1.2806) and Kijun-sen (1.2841) are in bearish setup and maintain pressure.
Alternative scenario requires close above Kijun-sen to sideline downside risk and signal further retracement of last Friday's 1.2955/1.2635 fall.
Res: 1.2776, 1.2806, 1.2841, 1.2883
Sup: 1.2708, 1.2635, 1.2619, 1.2573
GBP/JPY Daily Outlook
Daily Pivots: (S1) 139.21; (P) 140.86; (R1) 142.22; More....
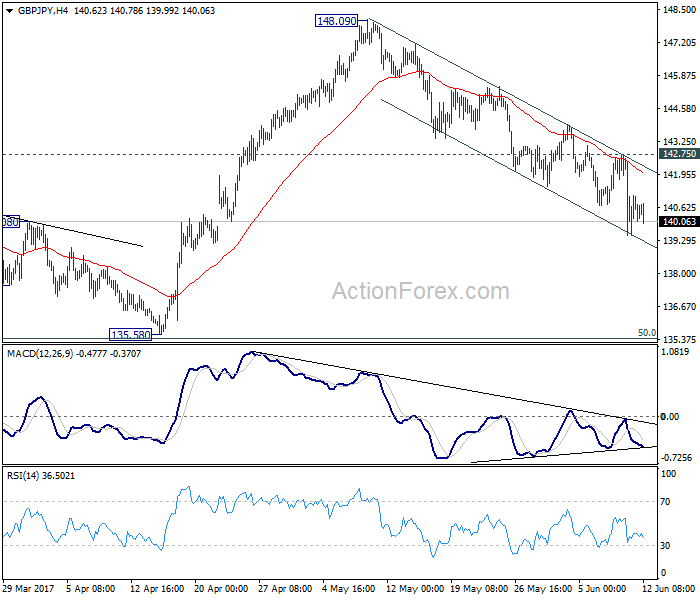
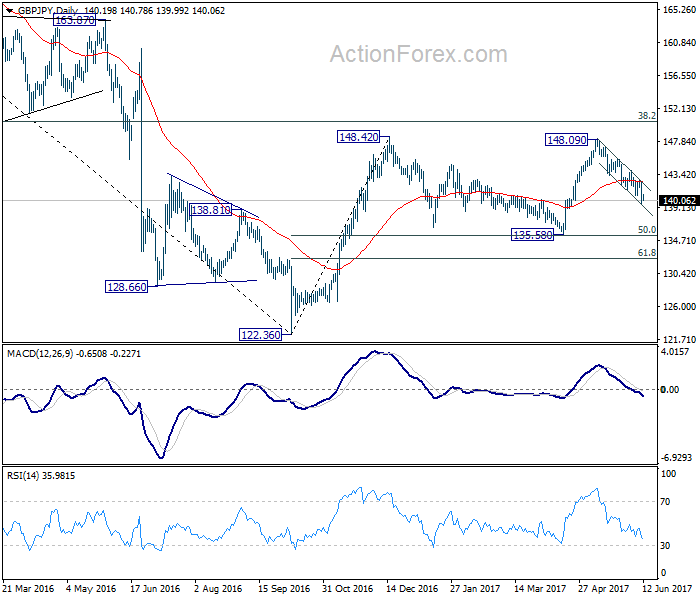
Intraday bias in GBP/JPY remains on the downside for 125.58 support. We'd look for bottoming signal around there to bring rebound. Nonetheless, break of 142.75 resistance is needed to indicate completion of fall from 148.09. Otherwise, near term outlook will say mildly bearish in case of recovery.
In the bigger picture, while the fall from 148.09 is deeper than expected, we're not bearish in the cross yet. Price action from 148.42 is possibly developing into a sideway pattern with fall from 148.09 as the third leg. Deeper decline could be seen but we're looking for strong support from 135.58 and 50% retracement of 122.36 to 148.42 at 135.39 to contain downside. Rise from 122.36 is still mildly in favor to resume at a later stage. However, sustained break of 135.58/39 will confirm reversal and target a retest on 122.36 low.