Sample Category Title
EUR/USD Analysis: Near 1.12 Mark On Monday
The common European currency rebounded in the second half of Friday's trading against the US Dollar, and the pair extended the gains into Monday's trading. However, various signs are indicating that a reversal of the direction of the currency pair might soon occur. First of all the hourly chart reveals that the Euro has encountered the resistance of the 55-hour SMA at 1.1212 and the newly calculated weekly PP at 1.1216. In addition, a descending short term channel has been identified. In accordance with the pattern even if the rate passes the mentioned resistance levels, it will still face the combined resistance of the channel's upper trend line and the 100 and 200-hour SMAs. All of these resistance levels are slowly moving lower.
GBP/USD Analysis: Takes A Breath
After Thursday's fall the Cable has entered a period of stagnation, which could just be a calm before the storm, with this week's Fed and BoE meetings due. Consequently, no significant changes are likely to occur ahead of those meetings, meaning the GBP/USD pair is likely to remain relatively unchanged and hold around the monthly S1 of 1.2758. Risks remain skewed to the downside, as that door got open by the election results in the UK, with the Pound now being exposed to the 1.25 area. Technical indicators suggest the Sterling is to weaken against the Buck today, but the 1.27 major level is expected to hold for the time being. In case this psychological support is breached, the next target will be the monthly S2 at 1.2624
USD/JPY Analysis: To Keep Sliding Do
The Greenback's attempts to recovery against the Yen are likely to be short-lived, as the recent breach from the triangle pattern on the daily chart suggests so. Furthermore, technical indicators are giving distinctly bearish signals, implying a slide back towards 109.22, namely the monthly S1, is possible. Ahead of this area the USD/JPY currency pair has no other solid demand areas, while a resistance line is in fact present. The US Dollar could easily weaken within the next two days and retest the mentioned demand level, but is expected to receive a strong boost from that point, with the Fed rate hike announcement on Wednesday acting as a catalyst.
Gold Analysis: Falls Below Medium Term Support
The medium term channel did not manage to hold its ground, as the short term descending channel managed to pass through the support of the medium scale pattern. Due to that reason it can be expected that the decline of the yellow metal will continue in accordance with the short term channel on Monday. That would occur in the case if there are no fundamental events, which cause a run to safety or a depreciation of the US Dollar. In the case of a decline the next target for the bullion is the weekly S1, which is located at the 1,255.79 level. However, on the daily chart there are some additional support levels, which should be taken into account. On the other hand, if the metal rebounds, it might reach for the closest resistance level at the 1,276.85 level.
Technical Outlook: AUDUSD Ranges Between 100 And 200SMA’s, Awaiting Fed’s Decision
The pair is holding in extended consolidation between 100SMA (0.7556) and 200SMA (0.7527) which so far holds the downside after strong recovery rally stalled.
Overall bullish structure on daily chart could be dented on loss of 200SMA support, as slow stochastic is reversing from overbought territory and supporting the notion.
Plethora of strong supports provided by daily MA lies below and should limit extended corrective dips (converging 10/55SMA's at 0.7485/85 should ideally contain.
Otherwise, prolonged consolidation could be expected while 200SMA holds, with near-term focus to shift higher.
Firm break above 100SMA is needed to signal extension of bull-leg from 0.7369 (02 June trough) towards next barriers at 0.7588 (Fibo 61.8% of 0.7749/0.7328) and 0.7610 (17 Apr high).
Extended directionless trading could be seen as likely near-term scenario ahead of FOMC policy meeting release which is expected to give stronger direction signals.
Res: 0.7555, 0.7588, 0.7610, 0.7664
Sup: 0.7527, 0.7495, 0.7485, 0.7468
Trade Idea: GBP/JPY – Sell at 141.30
GBP/JPY - 139.80
Recent wave: Medium term low formed at 120.50 and (A)-(B)-(C) major correction has commenced with (A) leg ended at 148.45, hence wave (B) is unfolding for retreat to 131.00-10.
Trend: Near term up
Original strategy:
Sell at 141.30, Target: 139.30, Stop: 141.90
Position: -
Target: -
Stop: -
New strategy :
Sell at 141.30, Target: 139.30, Stop: 141.90
Position: -
Target: -
Stop:-
As sterling has remained under pressure, suggesting the decline from 148.11 top is still in progress and bearishness remains for this move to extend further weakness to 139.20 support, break there would encourage for further subsequent weakness to 138.75-80, however, near term oversold condition should limit downside to 138.45-50 and price should stay above 138.00-10.
In view of this, would not chase this fall here and we are looking to sell sterling again on subsequent recovery as upside should be limited to 141.30-40 and bring another decline. Above 141.90-00 would defer and risk rebound to 142.40-50 but said resistance at 142.75 should limit upside and bring another selloff later.
Our preferred count is that larger degree wave V with circle is unfolding from 251.12 with wave (I) 219.34, (II): 241.38 and wave (III) is subdivided into 1: 192.60, 2: 215.89 (23 Jul 2008) and wave 3 ended at 118.87 earlier in 2009. The correction from there to 162.60 is wave 4 which itself is a double three and is labeled as first a-b-c ended at 151.53, followed by wave x at 139.03, 2nd a ended at 162.60, 2nd b at 146.75 and 2nd c leg of wave 4 ended at 163.00. Therefore, the decline from 163.00 to 116.85 is now treated as wave 5 which also marked the end of larger degree wave (III), hence wave (IV) major correction has commenced for retracement of the wave (III) from 241.38 and upside target at 183.95-00 (50% Fibonacci retracement of the wave (II) from 241.38) had been met, a drop below 160.00 would suggest wave (IV) has ended at 195.85, bring decline in wave (V) for initial weakness to 130 (already met) and 120.

Investors Are Cautious Ahead Of Central Banks’ Week
All eyes on Wednesday's FOMC meeting
The USD was trading broadly lower against its G10 counterpart on Monday morning as investors anticipated a busy week for central bankers. The Federal Reserve is set to release its monetary decision on Wednesday. After lifting rates in March, the FOMC is broadly expected to increase borrowing costs by another 25bps, which would bring the upper Federal Funds limit to 1.25%. While the decision is entirely priced in, investors are already looking towards the next move from the Fed.
Indeed, back in December last year, FOMC members hinted at three hikes in 2017. Should the Fed tighten this week, this would make the second hike this year, meaning the central bank needs to hike one last time to match its forecast. However, given the recent weakness in inflation, we do not expect the Fed to signal strongly a September move as it would put it in a difficult situation should the situation worsen. The FOMC could not appear too dovish as it would dampen investors' mood; therefore we expect the dots to show a third hike before year-end. However, we anticipate that both the statement and the following press conference will emphasise the need for caution.
Safe haven assets have been in solid demand this morning, suggesting that investors were quite reluctant to load on risk. USD/JPY reversed Friday's gains and returned to the 110 threshold, while the yellow metal rose 0.20% to $1,270.
Economic uncertainties still prevail in Japan
A set of data has been released this morning and it seems it is a never-ending story for Japan. April machine orders just collapsed at -.31% m/m while markets had estimated an increase of 0.5. This data is often used as a proxy for the capital expenditure.
Investors seem to be reluctant to invest domestically, due to several possible reasons including uncertainties about President Trump's trade policy and about Japan's economic future.This morning, the Japan producer price index came in flat at 0% and it represents the weakest PPI result in nine months. Already last week, the growth rate had been revised down to 0.3% from 0.5%.
The yen has slightly strengthened against the US dollar because of a risk-off sentiment in the market over the past few weeks. But we consider the economy in Japan is still struggling to recover. The sad reality is Japan has not succeeded in boosting private consumption, which accounts for 60% of the GDP.
Fed Rate Hike Is A Done Deal, But What Comes Next!
The FOMC meets on June 13 - 14 concluding the two-day monetary policy meeting with a statement, followed by a press conference. The FOMC will also be publishing fresh quarterly forecasts.
Economists are broadly in agreement that the June rate hike of 25-basis points (bps) is a done deal. This would effectively bring the Fed's short-term interest rates to 1.0% - 1.25%. The rate hike will also be the fourth time the Fed will be raising interest rates.
The last rate hike was in March 2017.
Fed’s short-term interest rates set to rise by 25 basis points
While the above decision is almost a done deal, the question of what the Fed will do next will be of importance. The rate hike has already been priced in, with the 30-day Fed-funds futures closing at 98.965 as of Friday.
CME Group: 30-day Fed funds futures (ZQ)
Roughly translated, this is 1.14 (100-) suggesting that the futures markets are expecting rates to be higher, above 1.0%.
According to a poll by the WSJ, economists have assigned a 93% probability for a rate hike this week. On Friday, the CME Futures, Fed funds rate probability closed at 99.6% The data shows that the markets are broadly prepared for the rate hike. Thus, it is likely to have limited impact on the markets.
Forward guidance will be key for the markets
With the recent string of weak economic reports which suggest that growth might be witnessing slowing momentum, the questions about the next rate hike from the Fed, along with questions on the Fed's intentions to reduce its balance sheet rank high among investors.
The WSJ's poll, also showed that about 54% of economists agree that the Fed will hike interest rates one more time, most possibly in September. 33% expect that this third-rate hike could come in December.
The Fed had previously signaled three rate hikes this year. After the 25bps rate hike in March, policy makers forecasted two more quarter point rate hikes for the rest of the year.
There will be several factors that will influence the decision from the policy makers. Considering that the economic growth has been wobbly so far, the Fed's dot plot will once again get attention.
The markets would like to know if the Fed will project another rate hike for the remainder of the year.
Likewise, there will be interest in more clarity from the Fed about its intentions to shrink its balance sheet. The Fed's balance sheet stands at $4.5 trillion as the central bank purchased massive amounts of mortgage backed securities (MBS) since the aftermath of the 2008 global financial crisis.
A reduction of the balance sheet will send the longer-term interest rates higher.
Making things somewhat complicated will be the fact that the proposed tax cuts and government fiscal spending will also boost inflation, jobs and the GDP.
Questions on balance sheet reduction
Some expect the Fed to be unwinding as early as September, while others suggest this could happen in December.
The unwinding of the Fed’s balance sheet is in some ways considered a form of monetary policy tightening. Thus, it would be quite possible that the Fed will signal its intentions on doing so, while also penciling another rate hike later this year.
Headline inflation in the United States, as seen by the core PCE data has been bucking the trend, staying consistently below the 2% target rate. One of the FOMC members, Lael Brainard, said in late May that the soft trend in inflation is concerning.
“If the soft inflation data persist, that would be concerning and, ultimately, could lead me to reassess the appropriate path of policy,” Brainard said in a prepared statement.
Fed officials are currently thinking of a way to shrink their balance-sheets without disrupting the markets.
It is therefore quite possible that if the mixed signals from the economy continue, the Fed could potentially pause rate hikes but consider cutting back on its balance-sheet.
No matter which way one looks at this, the June FOMC meeting is likely to see a cautious but a confident tone from the central bank.
This could very well translate to some short-term strength in the U.S. dollar.
Besides the Fed’s meeting, the monthly consumer price index (CPI) data will also be coming out this week.
Daily Technical Analysis: GBP/USD Possible Breakaway Gap
The GBP/USD had sharply fell when its was announced that UK Prime Minister May's gambit didn't go as planned. The result of UK Snap election created a sell-off in the GBP and at this point we can see that GBP is sold on rallies. The current price structure along with the camarilla pivots tell me that this could be a breakaway gap. The breakaway gap indicates that a new trend is about to develop after the gap has formed outside of the previous range. Also the gap is similar to a runaway gap, where the price fails to close the gap and it just proceeds with momentum.
The gap has been formed around W H3/ M H3 pivot extending to W L3 support. The POC zone is 1.2765-85 (38.2, double top, historical sellers) and on rallies the price could drop from the zone too. First target is 1.2715 and if momentum persists we could see 1.2634. Have in mind that breakaway gap is tricky and that we might not even see the close of the gap before W H3 -1.2820 is again broken to the upside.
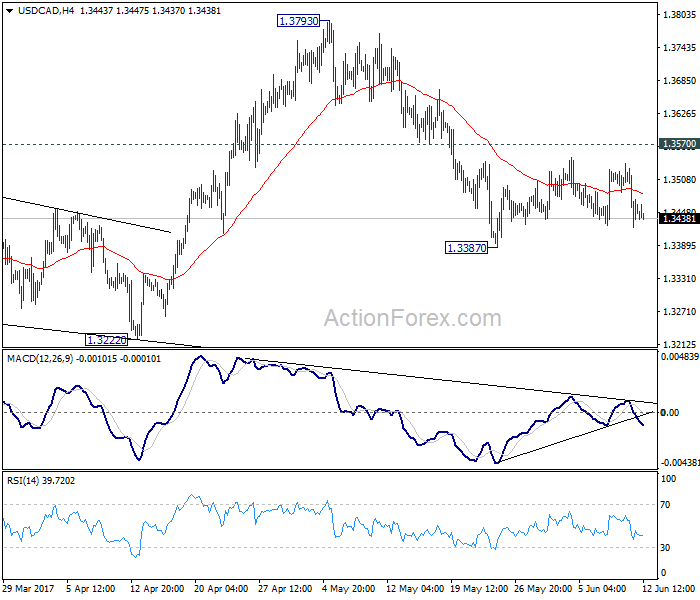
USD/CAD Daily Outlook
Daily Pivots: (S1) 1.3412; (P) 1.3473; (R1) 1.3525; More....
Intraday bias in USD/CAD remains neutral for the moment. In case of another recovery, upside should be limited by 1.3570 resistance and bring fall resumption. We're holding on to the view that rise from 1.2968 has completed. And the larger rise from 1.2460 could have finished too. Below 1.3387 will target 1.3222 support first. Break of 1.3222 will affirm our bearish view and target 1.2968 key support level for confirmation. However, break of 1.3570 will turn focus back to 1.3793 high instead.
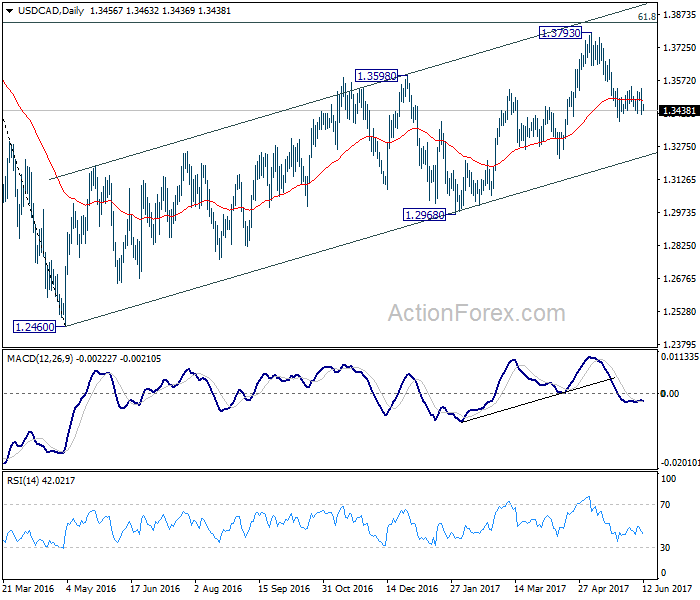
In the bigger picture, price actions from 1.4689 medium term top are seen as a correction pattern. The first leg has completed at 1.2460. Rise from 1.2460 is seen as the second leg and could have completed at 1.3793, ahead of 61.8% retracement of 1.4689 to 1.2460 at 1.3838. Break of 1.3222 should indicate the start of the third leg while further break of 1.2968 should confirm. Nonetheless, sustained trading above 1.3838 would pave the way to retest 1.4689 high.