
Sample Category Title
EURJPY Consolidates Below 124.00; Uptrend Still in Place
EURJPY stalled the recent uptrend at 125.80 on May 16. The bias has turned neutral in the near-term.
There is immediate resistance at 124.00. A breach above this level would see a re-test of the 125.80 high and from here bring about a resumption of the uptrend from 114.84 to 125.80. But looking at momentum indicators, there is risk to the downside, with RSI dipping below 50 and MACD sloping down. This reduces the odds for a bounce higher. Immediate support lies at 122.60 and a break below this would expose support at 120.60. Below this, the level at 118.90 comes into view as further support.
For now, the short-term bias is neutral, with the market trapped between 122.60 and 125.80 but the pause in the uptrend could be temporary as the 50-day and 200-day moving averages are positively aligned and the market is above the daily Ichimoku cloud. Only a move below 120.60 would reverse the recent uptrend that has been in place since the rise from the 115 area.
Political Uncertainty Keeps Sterling Under Pressure
- Friday evening's weakness in the Nasdaq filtered through in European equity trading with main indices losing up to 1%. US equities opened slightly lower again with Nasdaq underperforming (-1%). Big US tech stocks take the brunt of the beating.
- Theresa May faces a showdown with newly elected Conservative MPs today as the British prime minister desperately attempts to shore up her position after claims by former chancellor Osborne that she is "a dead woman walking". Sterling is again in the defensive with EUR/GBP testing resistance around 0.8850.
- Euro-area inflation is becoming less reliant on ECB stimulus, Executive Board member Coeuré said as he confirmed that policy makers are moving slowly toward an exit from their bond-buying program.
- The uncertainty generated by the UK's snap election, which has paved the way for a minority government for the first time in two decades, poses a risk to Britain's credit rating, according to Moody's. They currently rate the UK as Aa1 with a negative outlook.
- PM Sipilä moved to dissolve the three-party ruling coalition after junior partner The Finns was taken over by its anti-immigrant wing, throwing into doubt the next steps in a process that has helped Finland battle back from an economic slump.
Rates
Bunds outperform US Treasuries, but limited ranges
Global core bonds traded mixed today with German Bunds slightly outperforming US Treasuries. Friday evening's correction on Nasdaq (low beta, high volume tech stocks) filtered through in European indices which lose around 1%. The German Bund profited from minor safe haven flows. Higher oil prices and positive sentiment on EMU bond markets balanced equity weakness to some extent. US Treasuries are marginally lower ahead of supply and Wednesday's FOMC meeting. At the time of writing, the German yield curve flattens with yield changes ranging between +0.4 bps (2-yr) and -1.2 bps (30-yr). The US yield curve shifts 1.2 bps to 1.7 bps higher, with the belly of the curve underperforming the wings.
On intra-EMU bond markets, 10-yr yield spreads versus Germany narrowed around 2 bps but with some politically-related exceptions. Italy (-6 bps) and France (-4 bps) outperformed. Italian BTP's gain momentum after Beppe Grillo's 5SM anti-euro party's lacklustre performance in local elections. French OAT's got a boost from President Macron's party's performance in the 1st round of parliamentary elections which will lead to a landslide victory in the 2nd round with an absolute majority. Finland underperforms (+1 bp) after the coalition government collapsed. The coalition consisted the centre party (PM Sipilä), the liberal NCP and the extreme-right Finns. Yesterday, the Finns elected Halla-aho as their new party leader. He is known for his anti-EU and anti-immigration views and wants the Finns to prioritize these themes. PM Sipilä therefore decided, in dialogue with NCP, to dissolve the ruling coalition. He doesn't pursue new elections, but will try to find a new majority in current parliament, eg with the Swedish People's Party or Christian Democrats.
The US Treasury starts its mid-month refinancing operation today (exceptional timing due to Wednesday's Fed meeting) with a $24B 3-yr Note auction and a $20B 10-yr Note auction. Currently, the WI's respectively trade around 1.5% and 2.21%. The Treasury ends its refinancing tomorrow with a $12B 30-yr Bond auction.
Currencies
Dollar going nowhere as sentiment turns risk-off
The tech-driven equity correction and declining European political risk were today's potential drivers for FX trading. Negative risk sentiment weighed slightly on USD/JPY. The pair struggles not to fall back below 110. EUR/USD basically held a sideways range, as more signs of European political stability protected the downside of the single currency and counterbalanced negative global risk sentiment. EUR/USD is going nowhere in the 1.1220 area.
Overnight, Asian equities markets felt some fall-out from the tech correction in the US on Friday. The impact on the major FX cross rates is modest. USD/JPY hovered sideways in the lower half of the 110 big figure. In France, Macron succeeded a major victory in the first round of the French parliamentary elections. He will secure a comfortable majority in the second round. However, the French election result didn't support any significant euro gains.
There were no eco data with market moving potential in Europe. Macron's victory and a disappointing result from the populist five start movement in the local Italian elections were intrinsically positive for European assets and for the euro. European equities opened with modest losses, but the tech correction soon outweighed the positive political news. The equity sell-off accelerated mid-morning. USD/JPY dropped below the 110 barrier. The downside of EUR/USD was rather well protected. Peripheral spread narrowing signalled ongoing positive underlying sentiment on the region. The euro was also supported by comments from ECB's Coeure who said that EMU inflation has become less reliant on ECB stimulus. There were no market relevant data in the US. USD/JPY tried to regain the 110 barrier, but new weakness in US stock markets prevents that. EUR/USD trades in the 1.12 area.
Political uncertainty keeps sterling under pressure
On Friday, the post-election sterling sell-off soon slowed as PM May tried to convince the UK political scene that she could continue her Brexit strategy and remain PM with the support of the Northern-Irish DUP party. However, during the weekend and this morning, there were plenty of indications that it would be difficult for the UK PM to find common ground within the Conservative party on the kind of Brexit Britain needs. Speculation on a resignation of PM May and the fear for more political chaos triggered a new wave of sterling selling. EUR/GBP started a gradual, but protracted intraday uptrend and set a minor now 2017 top in the 0.8865 area. Cable dropped to the 1.2660 area. The sterling decline slowed during the US trading session, but there is no sign of any rebound yet. Sterling is holding very close to the recent lows against the euro (currently EUR/GBP 0.8850 area) and the dollar (currently cable 1.2670 area).
Trade Idea: EUR/GBP – Stopped profit and buy at 0.8750
EUR/GBP - 0.8850
Recent wave: Major double three (A)-(B)-(C)-(X)-(A)-(B)-(C) is unfolding and 2nd (A) has possibly ended at 0.6936.
Trend: Near term up
Original strategy :
Sold at 0.8735, stopped profit at 0.8725
Position : - Short at 0.8735
Target : -
Stop : - 0.8725
New strategy :
Buy at 0.8750, Target: 0.8880, Stop: 0.8710
Position : -
Target : -
Stop : -
The single currency found renewed buying interest at 0.8652 and has rallied again, suggesting recent erratic upmove from 0.8304 low has resumed and may extend further gain to 0.8880, then 0.8900, however, as broad outlook remains consolidative, reckon current c leg of larger degree wave b should be limited to 0.8950 and price should falter well below 0.9000, bring retreat later this week.
In view of this, we are looking to turn long on dips but one should exit on such rise. Below 0.8700-10 would defer and risk test of 0.8650-55 support but break there is needed to signal top is formed instead, bring further fall to 0.8620, then 0.8600 which is likely to hold from here.
Our preferred count is that, after forming a major top at 0.9805 (wave V), (A)-(B)-(C) correction is unfolding with (A) leg ended at 0.8400 (A: 0.8637, B: 0.9491 and 5-waver C ended at 0.8400. Wave (B) has ended at 0.9413 and impulsive wave (C) has either ended at 0.8067 or may extend one more fall to 0.8000 before prospect of another rally. Current breach of indicated resistance at 0.9043 confirms our view that the (C) leg has ended and bring stronger rebound towards 0.9150/54, then towards 0.9240/50.

GBP Reaction after UK Election
The pound sterling was headed for the biggest drop in a year after it emerged that the ruling Conservative Party has fallen short of a general majority after UK Election (GE 2017), just 10 days before the Brexit talks are scheduled to begin. The currency collapsed in front of all its main counterparts, since the supporters of Theresa May felt to lose the objective of 326 seats necessary to form a majority government, contrary to what many probes predicted and the market expected. Pound against US dollar hits the lowest levels since April after the first exit poll on Thursday predicted the Tories winning just 314 seats.
The Pound slides more then 2 percent against US dollar after touching $ 1.2636 at the London open on Friday. Which is the lowest level since April 18, the Theresa May day called the sudden election . It dropped to 2.5 percent, set for the biggest drop since the days after the Brexit vote.
GBP tumbled due to a hung parliament after UK Election (GE 2017)?
We don't think so. Charts below will prove that we were already expecting weakness in GBP and market was just looking for an excuse to sell GBP against various currencies. It was because GBP was showing incomplete swings sequence against many other currencies or was in areas from where weakness in 3 waves at least was expected in GBP against other currencies. We at Elliottwave-Forecast we follow the technical factors in analysing the market. As everyone knows that Elliott wave theory is suggestive and can provide many scenarios as possible. For years, we have understood that nature and have created a distribution system and other tools to take away subjective nature of the theory and understand the nature of what we call the right side of the market. This combined with sequence of swings (3, 7 or 11 swings), market correlation, money management and picking trades with the right risk / reward, so that it would be profitable even if one person won only 4 out of 10 trades, that will provide the advantage of becoming a successful trader / investor. For us the Elliott wave Theory is only a language to communicate to members but use other tools for forecasting & creating Blue Boxes. These Boxes represents the areas where Sellers/ Buyers agree into a 3 waves move and the safer way to trade.
GBPUSD 1 Hour Elliott Wave Chart before UK Election (6.8.2017)
EURGBP 1 Hour Elliott Wave Chart before UK Election (6.8.2017)
GBPJPY 1 Hour Elliott Wave Chart
GBPAUD 1 Hour Elliott Wave Chart
Trade Idea: USD/CAD – Hold short entered at 1.3500
USD/CAD - 1.3454
Recent wave: Only wave v of c has ended at 0.9407 and wave C of major A-B-C correction is underway for headway to 1.4700
Trend: Near term up
Original strategy :
Sold at 1.3500, Target: 1.3330, Stop: 1.3560
Position: - Short at 1.3500
Target: - 1.3330
Stop: - 1.3560
New strategy :
Hold short entered at 1.3500, Target: 1.3330, Stop: 1.3545
Position: - Short at 1.3500
Target: - 1.3330
Stop:- 1.3545
Although the greenback staged a rebound late last week, as price has retreated again after faltering below resistance at 1.3547, retaining our bearishness and consolidation with downside bias remains for weakness towards support at 1.3387, however, break there is needed to confirm the fall from 1.3794 top has resumed for further weakness to 1.3350, then towards 1.3300, however, loss of near term downward momentum should prevent sharp fall below 1.3250-60.
In view of this, we are holding on to our short position entered at 1.3500. Above said resistance at 1.3547 would abort and prolong consolidation, risk rebound to 1.3571-79 (previous support and 50% Fibonacci retracement of 1.3770-1.3387), however, reckon upside would be limited to 1.3620-25 (61.8% Fibonacci retracement) and bring another decline later.
To recap, wave B from 1.3066 is unfolding as an a-b-c and is sub-divided as a: 1.2192, b: 1.2716 and wave c is a 5-waver with i: 1.1983, ii: 1.2506, extended wave iii with minor iii at 1.0206, wave iv ended at 1.0781 and wave v as well as wave iii has ended at 0.9931, hence the subsequent choppy trading is the wave iv which is unfolding as (a)-(b)-(c) with (a) leg of iv ended at 1.0854, followed by (b) leg at 1.0108 and (c) leg as well as the wave iv ended at 1.0674. The wave v is sub-divided by minor wave (i): 0.9980, (ii): 1.0374, (iii): 0.9446, (iv): 0.9913 and (v) as well as v has possibly ended at 0.9407, therefore, consolidation with upside bias is seen for major correction, indicated target at 1.3700 and 1.4000 had been met and further gain to 1.4700 would be seen later.

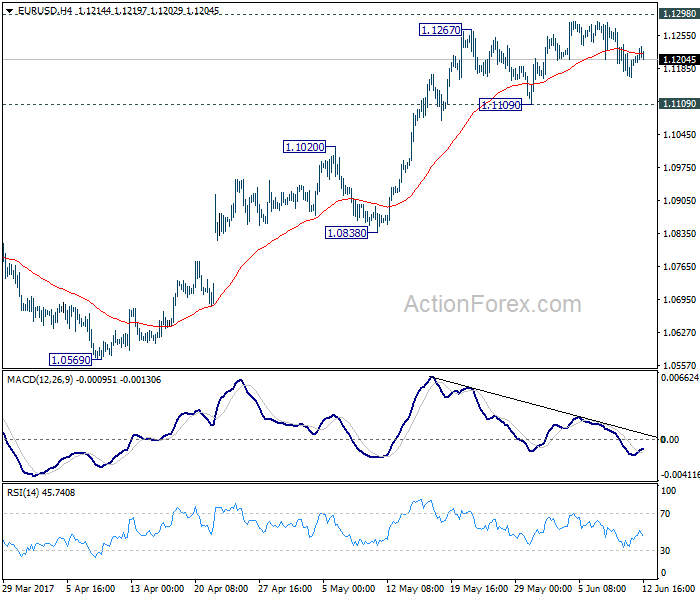
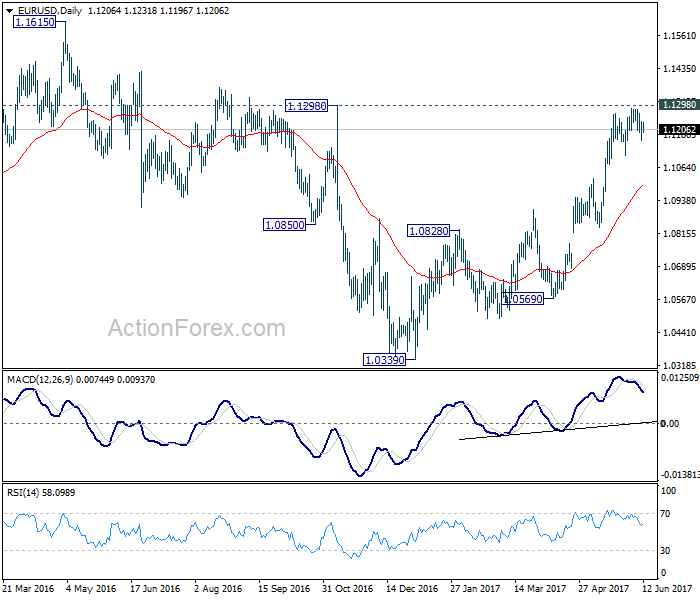
EUR/USD Mid-Day Outlook
Daily Pivots: (S1) 1.1162; (P) 1.1199 (R1) 1.1231; More....
Intraday bias in EUR/USD remains neutral with focus on 1.1298 key resistance. Decisive break there will carry larger bullish implication and target 1.1615 resistance next. On the downside, break of 1.1109 support will indicate short term topping and rejection from 1.1298. In such case, intraday bias will be turned to the downside for 1.0838 support.
In the bigger picture, the case for medium term reversal continues to build up with EUR/USD staying far above 55 week EMA (now at 1.0922). Also, bullish convergence condition is seen in weekly MACD. Focus will now be on 1.1298 key resistance. Rejection from there will maintain medium term bearishness and would extend the whole down trend from 1.6039 (2008 high). However, firm break of 1.1298 will indicate reversal. In such case, further rally would be seen back to 1.2042 support turned resistance next.
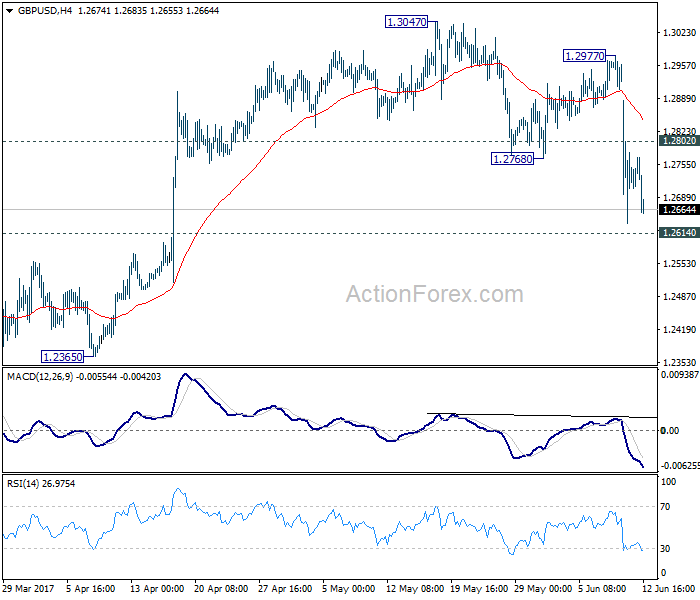
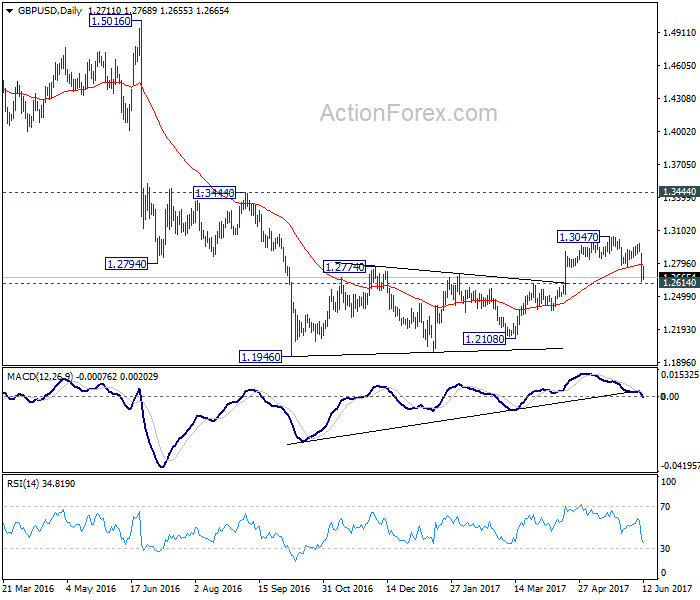
GBP/USD Mid-Day Outlook
Daily Pivots: (S1) 1.2598; (P) 1.2775; (R1) 1.2915; More...
With 1.2802 minor resistance, intraday bias in GBP/USD remains on the downside. We're favoring the case that consolidation pattern from 1.1946 has completed at 1.3047 already. Break of 1.2614 resistance turned support would confirm our bearish view and target a test on 1.1946 low next. On the upside, above 1.2802 will bring turn bias neutral and bring recovery. But outlook will remain bearish as long as 1.2977 resistance holds.
In the bigger picture, fall from 1.7190 is seen as part of the down trend from 2.1161. Price actions from 1.1946 medium term low are seen as a consolidation pattern, which could have completed after hitting 55 week EMA. Break of 1.1946 low will target 61.8% projection of 1.5016 to 1.1946 from 1.3047 at 1.1150 next. In case the consolidation from 1.1946 extends, outlook will stay remain bearish as long as 1.3444 resistance holds.
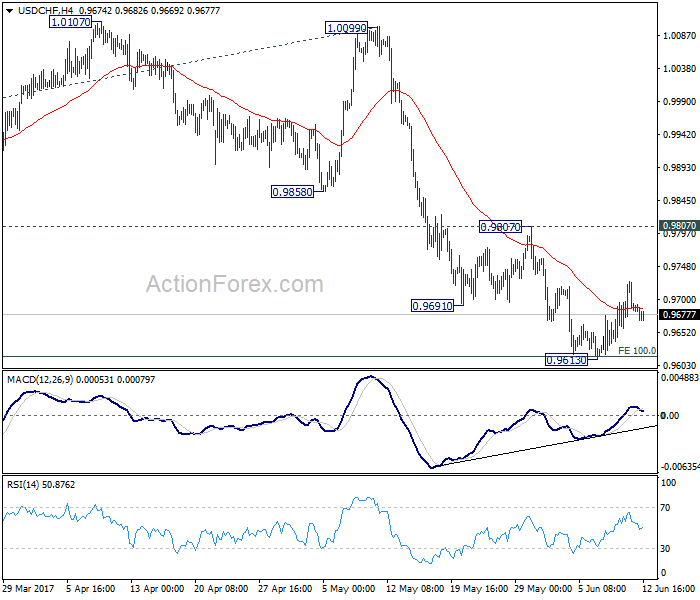
USD/CHF Mid-Day Outlook
Daily Pivots: (S1) 0.9654; (P) 0.9690; (R1) 0.9729; More.....
Intraday bias in USD/CHF remains neutral as the correction from 0.9613 is still in progress. With 0.9807 resistance holds, near term outlook remains bearish. Break of 0.9613 will extend the whole fall from 1.0342 to 0.9548 support and below. We'd start to look for bottoming signal again as it approaches 0.9443 key support level. However, considering bullish convergence condition in 4 hour MACD, break of 0.9807 will indicate near term reversal and turn outlook bullish for 1.0099 resistance next.
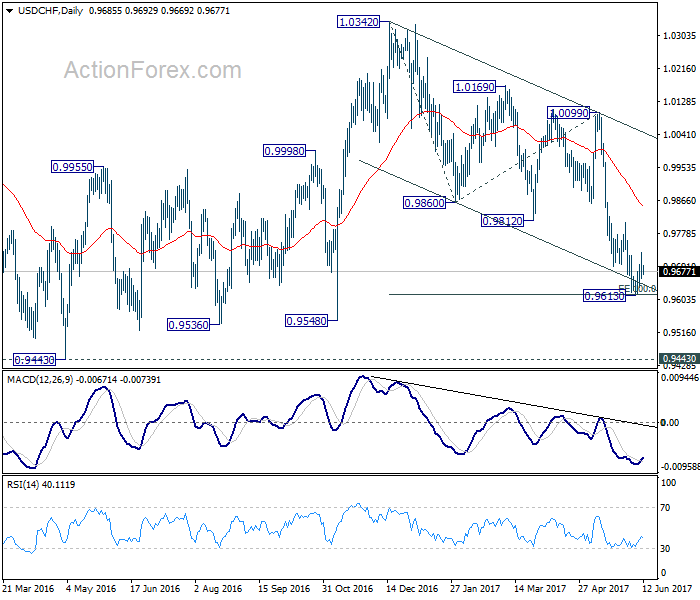
In the bigger picture, USD/CHF is still bounded in medium term range of 0.9443/1.0342 for the moment. Consolidative trading would likely continue and medium term outlook remains neutral. Break of 1.0342 key resistance is needed to confirm underlying bullish momentum in the pair. Meanwhile, downside attempts should be contained by 0.9443 key support level. However, sustained break of 0.9443 will carry larger bearish implication and target 0.9 handle.
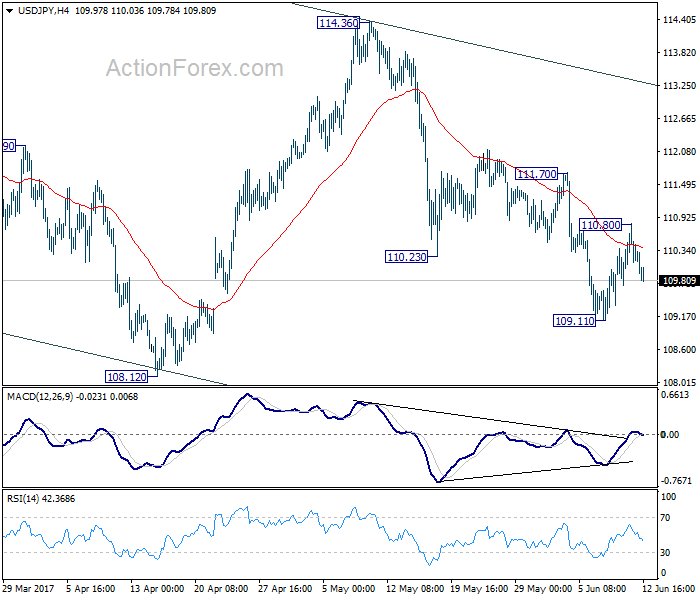
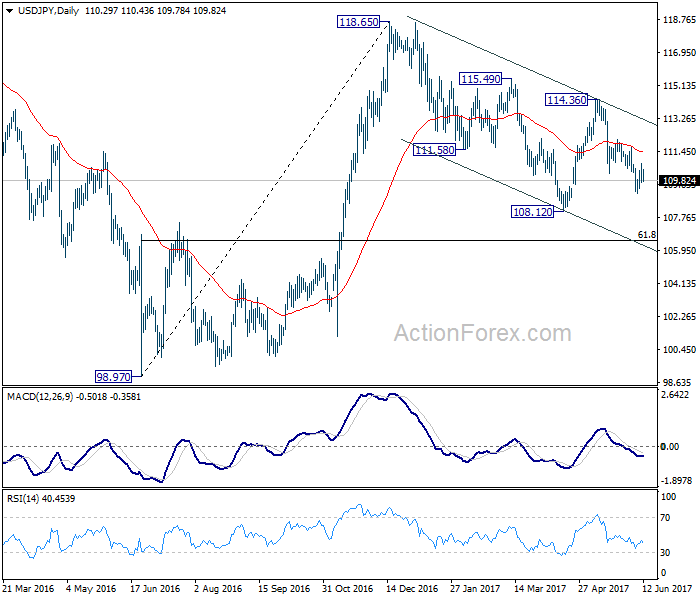
USD/JPY Mid-Day Outlook
Daily Pivots: (S1) 109.74; (P) 110.28; (R1) 110.85; More...
USD/JPY weakens today but stays above 109.11 temporary low. Intraday bias remains neutral for the moment. As long as 111.70 resistance holds, near term outlook remains mildly bearish and deeper fall is expected. Below 109.11 will target 108.12 low first. Break will extend the whole corrective fall from 118.65 to 61.8% retracement of 98.97 to 118.65 at 106.48. We will look for bottoming sign there. Meanwhile, break of 110.70 will suggest near term reversal and turn bias back to the upside for 114.36 resistance instead.
In the bigger picture, price actions from 125.85 high are seen as a corrective pattern. It's uncertain whether it's completed yet. But in case of another fall, downside should be contained by 61.8% retracement of 75.56 to 125.85 at 94.77 to bring rebound. Overall, rise from 75.56 is still expected to resume later after the correction from 125.85 completes.
Trade Idea Update: USD/CHF – Hold short entered at 0.9720
USD/CHF - 0.9675
Original strategy :
Sold at 0.9720, Target: 0.9620, Stop: 0.9720
Position : - Short at 0.9720
Target : - 0.9620
Stop : - 0.9720
New strategy :
Hold short entered at 0.9720, Target: 0.9620, Stop: 0.9720
Position : - Short at 0.9720
Target : - 0.9620
Stop : - 0.9720
Although dollar staged a strong rebound from last week’s low of 0.9613 to 0.9728 (last week’s high), the subsequent retreat has retained our bearishness and consolidation with mild downside bias remains for weakness to 0.9657 support, however, break of 0.9640 is needed to signal the rebound from 0.9613 has ended, bring retest of this level first. A break below this level would extend recent decline to 0.9600-05 (50% projection of 1.0100-0.9692 measuring from 0.9808) later.
In view of this, we are holding on to our short position entered at 0.9720. Above said resistance at 0.9728 would abort and signal a temporary low has been formed at 0.9613 last week instead, bring a stronger rebound to 0.9761 resistance but price should falter below resistance at 0.9808.
