Sample Category Title
EUR/JPY Daily Outlook
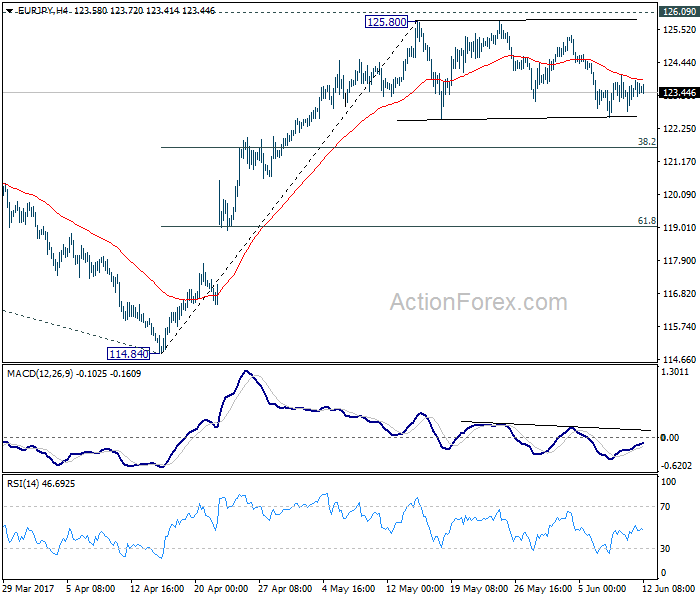
Daily Pivots: (S1) 122.92; (P) 123.39; (R1) 123.97; More...
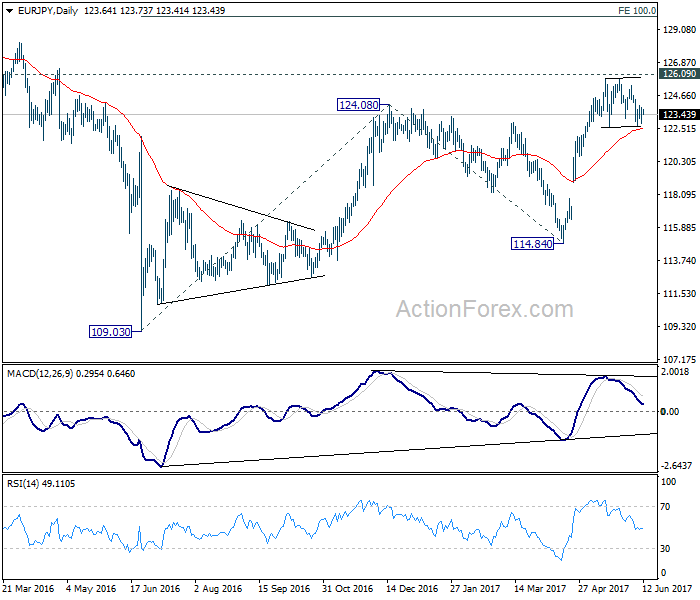
Intraday bias in EUR/JPY remains neutral as the consolidation from 125.80 is still in progress. In case of another fall, downside should be contained by 38.2% retracement of 114.84 to 125.80 at 121.61 to bring rise resumption. We're staying mildly bullish in the cross. And, break of 126.09 key resistance will extend the whole rebound from 109.03 to 100% projection of 109.03 to 124.08 from 114.84 at 129.89. Nonetheless, firm break of 121.61 will dampen our bullish view and bring deeper fall to 61.8% retracement at 119.02.
In the bigger picture, focus is staying on 126.09 support turned resistance. Decisive break there will confirm completion of the down trend from 149.76. And in such case, rise from 109.20 is at the same degree and should target 141.04 resistance and above. Meanwhile, rejection from 126.09 and break of 114.84 will extend the fall from 149.76 through 109.20 low.
Trade Idea: AUD/USD – Buy at 0.7500
AUD/USD – 0.7531
Recent wave: Wave 5 ended at 1.1081 and major correction has commenced for fall to 0.7000 and then towards 0.6500-10
Trend: Near term down
Original strategy :
Buy at 0.7500, Target: 0.7650, Stop: 0.7440
Position: -
Target: -
Stop: -
New strategy :
Buy at 0.7500, Target: 0.7650, Stop: 0.7440
Position: -
Target: -
Stop:-
Although aussie has retreated after rising to 0.7567 last week and consolidation below this level would be seen, downside would be limited to previous resistance at 0.7518 and reckon 0.7500 would hold, bring another rise later, above said resistance at 0.7567 would extend the rise from 0.7329 low towards 0.7592, then test of resistance at 0.7611 but break of latter level is needed add credence to this bullish count and encourage for subsequent upmove towards resistance at 0.7680 but price should falter below chart point at 0.7750.
In view of this, we are looking to buy aussie on dips as 0.7500 should limit downside and bring another rise. Below support at 0.7457 would abort and suggest top is possibly formed, bring weakness to 0.7415-20 but price should stay well above key support at 0.7372, bring another rebound later.
On the 4-hour chart, the move from 0.8066 is the wave 5 with i: 0.8860, ii: 0.8315, wave iii is an extended move ended at 1.0183, iv: 0.9706 and wave v has ended at 1.1081 (also the top of entire wave 5). The subsequent selloff is the major correction which is unfolding as ABC-X-ABC and 2nd A leg has ended at 0.8848, followed by a-b-c wave B which ended at 0.9758, hence, 2nd C wave is now in progress and indicated downside target at 0.7000 and 0.6950 had been met, so further fall to 0.6710-20 cannot be ruled out.

EUR/CHF Daily Outlook
Daily Pivots: (S1) 1.0834; (P) 1.0853; (R1) 1.0868; More...
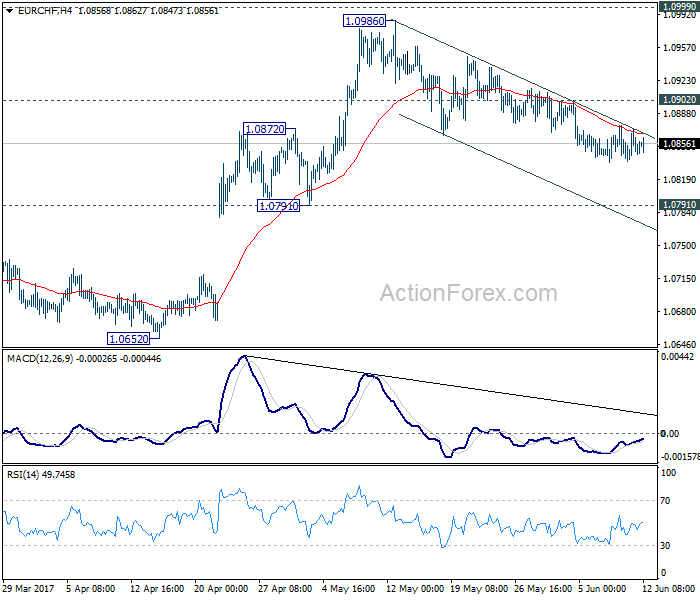
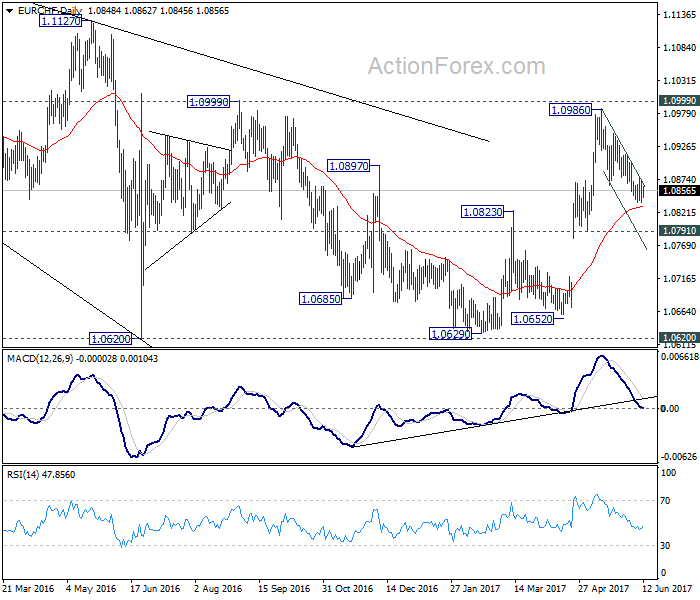
No change in EUR/CHF's outlook. We'd continue to expect strong support from 1.0791/0872 support zone, probably around 55 day EMA (now at 1.0830) to complete the correction from 1.0986. Break of 1.0902 minor resistance will turn bias back to the upside for 1.0986/0999. Overall, rise from 1.0629 is expected to resume later.
In the bigger picture, the price actions from 1.1198 are seen as a corrective move. Such correction could have completed after defending 38.2% retracement of 0.9771 to 1.1198 at 1.0653. Decisive break of 1.0999 resistance will target a test on 1.1198 high. For now, this will be the preferred case as long as 1.0791 support holds.
EUR/AUD Daily Outlook
Daily Pivots: (S1) 1.4815; (P) 1.4867; (R1) 1.4912; More...
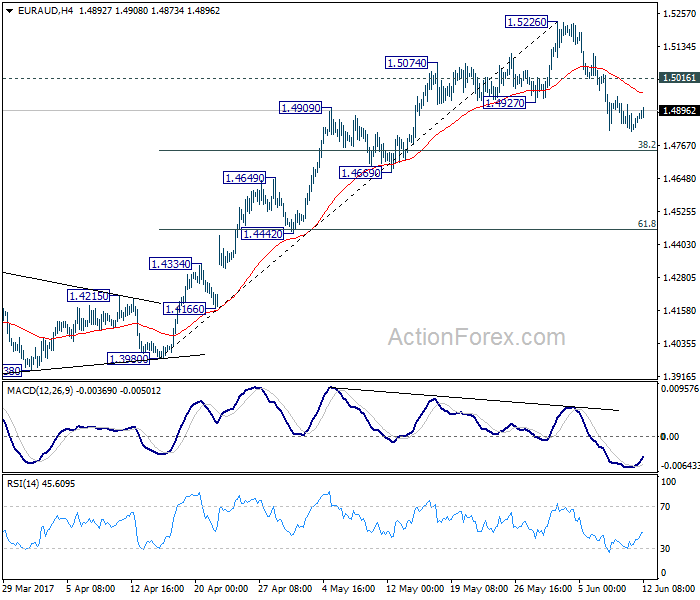
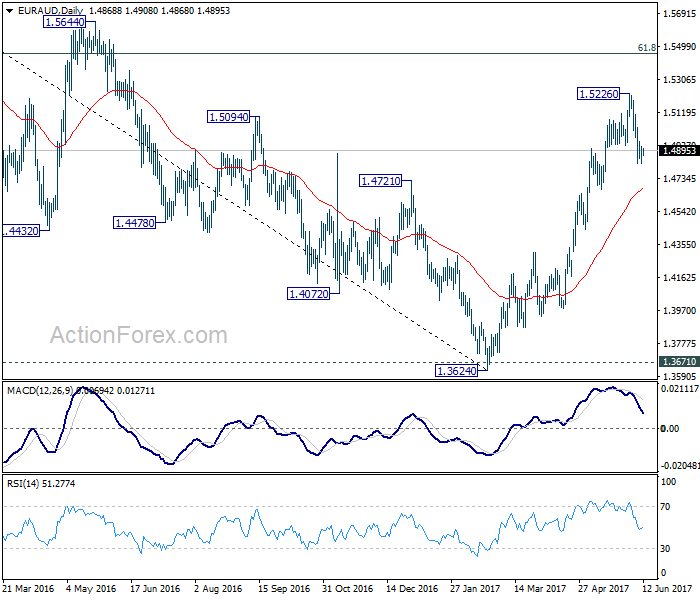
With 1.5016 minor resistance intact, the correction from 1.5526 might extend lower to 38.2% retracement of 1.3980 to 1.5226 at 1.4750 as the correction continues. At this point, we'd expect strong support from 1.4669 to contain downside and bring rebound. Above 1.5015 minor resistance will turn bias to the upside for 1.5226 first. Break will resume the rise from 1.3624 and target next medium term fibonacci level at 1.5455.
In the bigger picture, price actions from 1.6587 medium term top are viewed as a corrective pattern. Such correction should be completed at 1.3624 after defending 1.3671 key support. Rise from 1.3642 is now expected to target 61.8% retracement of 1.6587 to 1.3624 at 1.5455. Sustained break there will pave the way to retest 1.6587. In any case, outlook will now stay cautiously bullish as long as 1.4669 support holds. Break of 1.4669 will dampen the bullish view and would at least bring deeper fall back to 55 week EMA (now at 1.4539).
Technical Outlook: EURUSD – Recovery Needs Break Above 10SMA To Encourage Bulls
The Euro managed to close above rising 20SMA on Friday that sidelined immediate downside risk after short-lived dip to 1.1166.
Recovery extension Monday was so far capped by hourly cloud (1.1216), keeping intact the upper pivot at 1.1232 (10SMA). Sustained break above the latter is needed to generate stronger bullish signal and turn near-term focus higher.
However, risk of deeper pullback remains as bearish candle of last week and bearish divergence on daily MACD/RSI weigh.
Firm break below 20SMA (1.1203) would signal an extension of pullback from multiple upside rejections at 1.1285 towards next pivotal supports at 1.1114/09 (Fibo 38.2% of 1.0839/1.1285/30 May trough), loss of which would confirm reversal.
Key event of the week, FOMC policy meeting which ends on Wednesday is in focus, as Fed is widely expected to hike interest rates for the second time this year that would increase rate divergence and put the Euro under increased pressure.
Res: 1.1216, 1.1232, 1.1269, 1.1285
Sup: 1.1197, 1.1166, 1.1114, 1.1109
Forex Technical Analysis: EUR/USD, USD/JPY, GBP/USD
EUR/USD
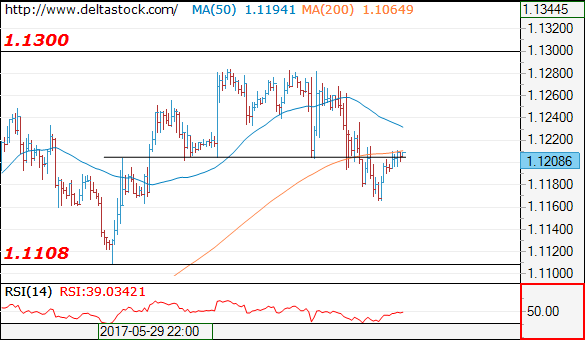
Current level - 1.1208
My outlook remains bearish, for a slide towards 1.1108 low. A break through the latter will signal a deeper slide towards 1.1020 major support. Initial resistance lies at 1.1240.
| Resistance | Support | ||
| intraday | intraweek | intraday | intraweek |
| 1.1240 | 1.1360 | 1.1165 | 1.1022 |
| 1.1300 | 1.1610 | 1.1109 | 1.0838 |
USD/JPY
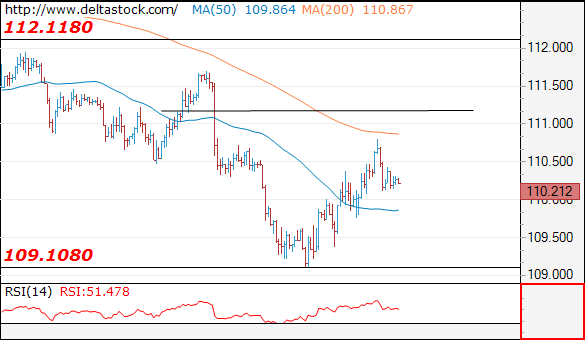
Current level - 110.21
There is a minor reversal at 110.80 and the slide form the mentioned peak could dive deeper, towards 109.10 low.
| Resistance | Support | ||
| intraday | intraweek | intraday | intraweek |
| 110.80 | 112.10 | 109.70 | 109.08 |
| 111.20 | 114.30 | 109.08 | 108.12 |
GBP/USD
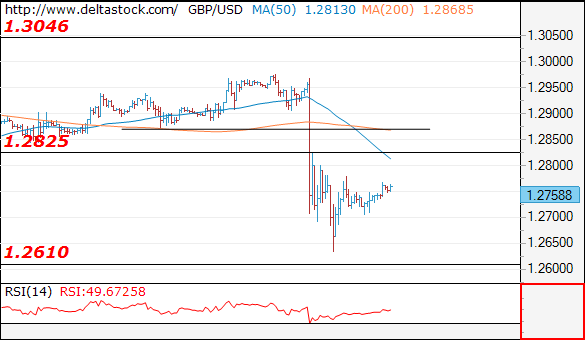
Current level - 1.2758
Intraday allow a brief test of 1.2830 resistance area, before another drowning towards 1.2610 zone.
| Resistance | Support | ||
| intraday | intraweek | intraday | intraweek |
| 1.2830 | 1.2970 | 1.2705 | 1.2610 |
| 1.2870 | 1.3050 | 1.2610 | 1.2610 |
Sterling Steady after UK Election Tumble; Euro up after French Parliamentary Elections
Sterling has stabilized after Friday's big tumble against the dollar following the shock UK election result that brought about political uncertainty. Prime Minister Theresa May was left with a minority government and she reshuffled her cabinet over the weekend. Focus turns to the Brexit negotiations that begin in about a week. Meanwhile, the Bank of England holds a policy meeting on Thursday. This would be the next risk event for the pound, which continued to trade below the key $1.2800 level during the Asian session today.
Another key central bank meeting this week will be in the US, where the Federal Reserve is expected to raise interest rates by 25 basis points. While this move is mostly priced in by the markets, the FOMC's forward guidance and Fed Chair Janet Yellen's speech will be closely scrutinized for any hints of further rate hikes this year. A dovish tone by the Fed would weigh on the dollar, which has been gaining against the yen in recent days to rise back above the key 110-yen level. The pair was steady during the Asian session, trading around 110.25 yen. The dollar index gave back Friday's gains to trade down to 97.06 in Asia.
The euro jumped higher after the legislative elections in France on Sunday which showed that President Emmanuel Macron's party is set for a large parliamentary majority. The euro rose to an Asian session high of $1.1215. The single currency's gains may be limited as markets look to the final round of voting which takes place next Sunday.
In other major currencies, the New Zealand dollar slipped against the greenback to $0.7170. The kiwi hit a three-month high of $0.7222 last week. The Australian dollar saw little movement in a quiet session due to a local public holiday, and it traded just above the $0.7520 level.
Economic data out during the Asian session showed Japan's core machinery orders fell more than expected in April, down 3.1% month-on-month versus a 1.3% decline expected. This followed a 1.4% increase in March.
In commodities, gold consolidated losses after a weak performance last week which saw the precious metal drop to $1264.50 an ounce on Friday. WTI oil was steady just below the $46 a barrel level.
EUR/GBP Daily Outlook
Daily Pivots: (S1) 0.8670; (P) 0.8764; (R1) 0.8879; More...
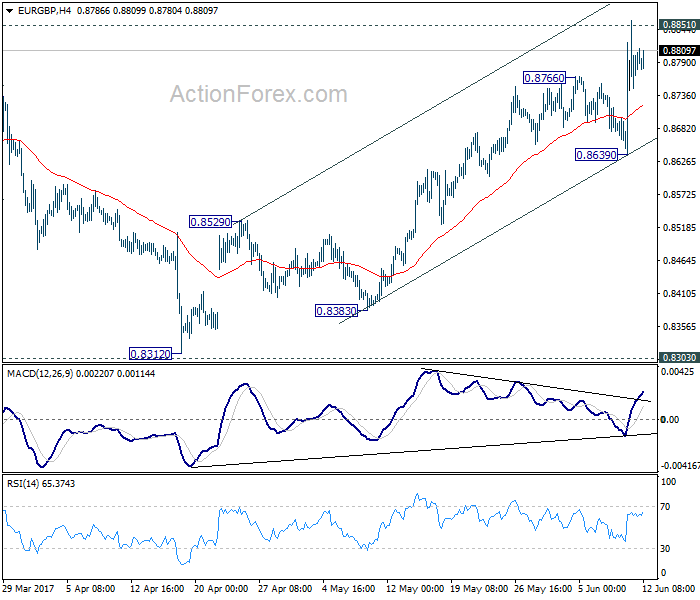
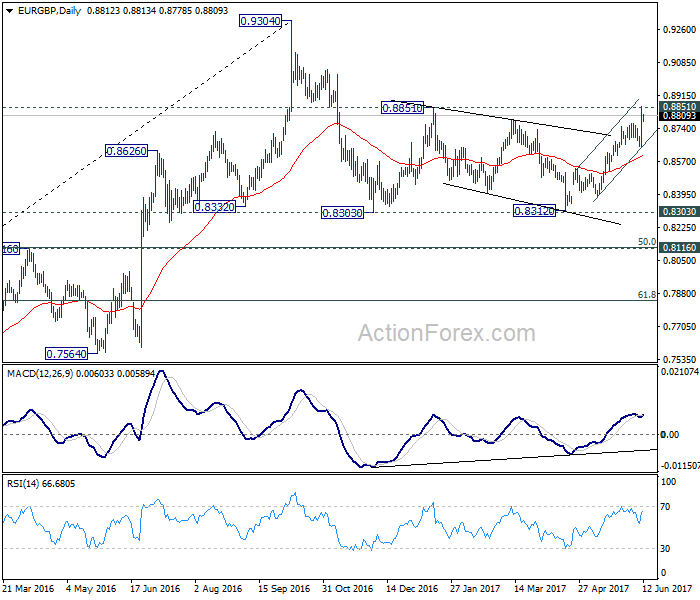
Intraday bias in EUR/GBP stays on the upside for the moment with focus on 0.8851 resistance. Decisive break there will extend the rally from 0.8312 to retest 0.9304 high. At this point, there is no clear sign of larger up trend resumption yet. Hence, we'll be cautious on topping around 0.9304. On the downside, however, break of 0.8639 support will now indicate near term topping and bring deeper pull back to 55 day EMA (now at 0.8601) and below.
In the bigger picture, price actions from 0.9304 are viewed as a medium term corrective pattern. The leg from 0.9304 should have completed after testing 0.8332 structural support. But it's too early to say that larger rise from 0.6935 is resuming. Rejection from 0.9304 will extend the consolidation with another falling leg. Meanwhile, firm break of 0.9304 will target 0.9799 (2008 high). In case of another decline, we'd expect strong support from 0.8116 cluster support (50% retracement of 0.6935 to 0.9304 at 0.8120) to contain downside and bring rebound.
British Pound Holding Above Last Week’s Low as Theresa May Steadying the Boat
Sterling trades mildly softer against Dollar, Euro and Yen today. But it's holding above last week's low so far. After the disastrous election, UK Prime Minister Theresa May announced her new cabinet on Sunday. Stability was clearly seen as her priority as all the most senior ministers stay. The list includes Chancellor of Exchequer Philip Hammond, Foreign Secretary Boris Johnson, Defense Secretary Michael Fallon and Home Secretary Amber Rudd. Also, David Davis kept his job as Brexit Secretary. While there are still calls for May to quit, she seems to have steadied the boat, as least for the moment. And preparing for Brexit negotiation with EU would now be back as one of her top priorities.
The Brexit negotiation with EU is scheduled to formally start on June 19. Ahead of that, May is facing pressure from all front to drop her "hard brexit" approach, including within Conservatives, Labour and her coalition partner DUP. In particular, the Northern Ireland's DUP is believed to be pushing for a "frictionless border" with the Republic of Ireland, rather than a hard one. And May's position of "no deal is better than a bad deal" doesn't have much support from others.
Macron's LREM to get overwhelm majority in parliament
In France, President Emmanuel Macron's centrist party looks set to take an overwhelming majority in parliament after the first round of election yesterday. The new La Republique En Marche and its ally MoDem won 32.32% of votes in the first round, well ahead of rival Les Republicain's alliance at 21.56%. The far-right Front National got 13.2% while Socialist got 9.5%. Based on current estimations, the La Republique En March could get up to 430 seats in the 577 seat parliament after the final round on June 18. And if that happens, it would be a boost for Macron to implement his center right policies including loosing up labor laws and reforming the welfare system.
German Chancellor Angel Merkel expressed her "heartfelt congratulations" to Macron on the "great success" of the party in its first ballot. She hailed that the result was a "strong vote for reforms" that could strengthen the German-French alliance. Both expressed common goal to develop a roadmap to strengthen EU and the Eurozone when they met in Berlin last month. And Macron is clear about his wish to push for reforms in EU, strengthening of Eurozone with a common budget and introduce new executive power in Eurozone with a Euro chamber and a Euro commissioner.
FOMC and BoE to highlight the week, SNB and BoJ also featured
The economic calendar is rather light today. Japan machine orders dropped -3.1% mom in April. Domestic CGPI rose 2.1% yoy in May. Machine tool orders rose 24.4% yoy in May. Looking ahead, meeting of four central banks are the key focuses of the week.
Fed is widely expected to raise interest by another 25bps to 1.00-1.25%. Fed fund futures are pricing in 95.8% chance of that. The biggest question in traders mind is whether Fed is still ready to hike another time in September, to make a total of three hikes. There are doubts on whether the US economy could withstand that. And the new economic projections to be released with the rate announcement should shed some lights on policy makers' mind on it. Also from US, PPI, CPI, retail sales, regional Fed surveys, industrial production and some housing data will be released.
BoE monetary policy decision will be another focus. Main policy rate will be held at 0.25% while the asset purchase target kept at GBP 435b. This is the general expectation. The voting will be the main focus. In particular, markets would like to see if Kristin Forbes would continue to vote for a rate hike. And head of the meeting, UK will also release CPI, employment and retail sales. Headline CPI is expected to be unchanged at 2.7% yoy in May and a surprise there might change Forbes' mind. SNB and BoJ will also meet this week and both are expected to stand pat. These two are most likely non-events.
Here are some highlights for the week:
- Tuesday: Australia NAB business confidence; UK CPI and PPI; German ZEW; US PPI
- Wednesday: China industrial production, retail sales, fixed asset investment; UK employment; Eurozone employment, industrial production; US CPI, retail sales, FOMC
- Thursday: New Zealand GDP; Australia employment; SNB rated decision, CPI; UK retail sales, BoE; Eurozone trade balance; Canada manufacturing sales; US jobless claims, Empire State manufacturing index, Philly Fed survey, import price, industrial production, NAHB housing index.
- Friday: BoJ; Eurozone CPI final; US housing starts and building permits, U of Michigan sentiment
EUR/GBP Daily Outlook
Daily Pivots: (S1) 0.8670; (P) 0.8764; (R1) 0.8879; More...
Intraday bias in EUR/GBP stays on the upside for the moment with focus on 0.8851 resistance. Decisive break there will extend the rally from 0.8312 to retest 0.9304 high. At this point, there is no clear sign of larger up trend resumption yet. Hence, we'll be cautious on topping around 0.9304. On the downside, however, break of 0.8639 support will now indicate near term topping and bring deeper pull back to 55 day EMA (now at 0.8601) and below.
In the bigger picture, price actions from 0.9304 are viewed as a medium term corrective pattern. The leg from 0.9304 should have completed after testing 0.8332 structural support. But it's too early to say that larger rise from 0.6935 is resuming. Rejection from 0.9304 will extend the consolidation with another falling leg. Meanwhile, firm break of 0.9304 will target 0.9799 (2008 high). In case of another decline, we'd expect strong support from 0.8116 cluster support (50% retracement of 0.6935 to 0.9304 at 0.8120) to contain downside and bring rebound.
Economic Indicators Update
| GMT | Ccy | Events | Actual | Forecast | Previous | Revised |
|---|---|---|---|---|---|---|
| 23:50 | JPY | Machine Orders M/M Apr | -3.10% | 0.60% | 1.40% | |
| 23:50 | JPY | Domestic CGPI Y/Y May | 2.10% | 2.20% | 2.10% | |
| 6:00 | JPY | Machine Tool Orders Y/Y May P | 24.40% | 34.70% | ||
| 18:00 | USD | Monthly Budget Statement May | -87.3B | 182.4B |
Slow Start To The Week As Traders Look To The UK And The FOMC
The markets are continuing to take cues from Friday's developments with the UK general elections. With the economic calendar light today, the markets are likely to remain flat for the most part except for the British pound. Currently, price action is attempting to push higher with some retracement in sight.
The failure to get a clear majority on the elections held in the UK on Thursday has put more uncertainty in the composition of the British parliament, especially with the Brexit talks ready to start on 19 June. Thus, investor sentiment could remain cautious.
Besides the UK, the Fed, Bank of Japan, BOE and the SNB's central bank decisions are lined up this week. Although for the most part, not many changes are expected, the Fed is all set to raise interest rates this week. This is likely to bring some volatility to the markets.
EURUSD intraday analysis
EURUSD (1.1206): EUR/USD closed below 1.1200 on Friday, but price action is likely to remain supported above this level in the short term. With the Fed's decision on interest rates on Wednesday, we could expect some subdued price action in the near term. On the daily chart, theprice is consolidating within 1.1285 and 1.1100 forming a rising wedge pattern. We can expect some near-term upside to 1.1265 with the potential for a downside break. This will send EURUSD back to 1.1100 support level with the possibility of further downside testing 1.1000.
GBPUSD intraday analysis
GBPUSD (1.2758): The British pound closed strong below 1.2800 on Friday although prices were seen pulling back from a 2-month low. In the near term, GBPUSD could retest 1.2800 where resistance could now be developed. The overall bias remains to the downside, and if the 1.2800 resistance holds we could see further downside to 1.2600 which completes the head and shoulders pattern for the GBPUSD. Below 1.2600, further downside will push the currency pair towards 1.2400 support level which is pending retest.
USDJPY intraday analysis
USDJPY (110.26): USDJPY rallied to 110.79 on Friday before promptly giving up the gains. The declines we see could post a higher low on the chart. This could occur between 110.00 and 109.50. A higher low could signal a potential change in the short-term trend. USDJPY could retest the resistance at 110.79 followed by a move to 112.00.