Sample Category Title
UK job numbers decline, but wage growth remains elevated
UK labor market showed signs of softening in November, with payrolled employment falling by -35k or -0.1% mom to 30.4m. Meanwhile, median monthly pay growth slowed to 6.3% yoy, down sharply from 7.9% yoy in the prior month.
In the three months to October, employment rate edged up by 0.1% to 74.9%, while the unemployment rate also increased slightly to 4.3%, up by 0.1%. Economic inactivity rate fell by -0.2% to 21.7%, suggesting some progress in bringing inactive workers back into the labor force.
Wage growth remained robust overall, with average earnings excluding bonuses rising 5.2% yoy in the three months to October, up from 4.9% yoy in the previous month. Including bonuses, average earnings also grew by 5.2% yoy, accelerating from 4.4% yoy. This uptick in earnings may keep pressure on BoE, as policymakers balance moderating inflation with still-elevated wage growth.
The Magic Combo
Europe appears to be coming apart one nation at a time’, writes Bloomberg to summarize the complicated politics of the old continent. After the French snap election led to a divided government and an ungovernable France since summer, German politicians gave a no-confidence verdict for the three-way ruling party of Germany, paving the way for an early election in February – about 7 months earlier than scheduled. It means that the Germans will join their French neighbours in political gridlock and uncertainty. The energy crisis and weak global demand explain the most of the German economic misery today. The German economy could’ve grown 5% more over the past five years if it could maintain the pre-pandemic and pre-Ukrainian war trend, according to the latest research. But looking at the DAX index, you wouldn’t guess that the country is experiencing harsh economic meltdown and political problems. The DAX index retreated yesterday, but from near an ATH level. The political shenanigans didn’t prevent the index from rallying above the 20’000 this month. Its technology heavy weights, like SAP and Siemens, followed their American peers to the north, and somehow hid the misery of the carmakers. But the same cannot be said for France. Their luxury companies could barely provide an umbrella for the rainy French days, as Chinese consumers failed to show up at the rendez-vous. As a result, the Stoxx 600 appears to be peaking ahead of what’s shaping up to be a chaotic Christmas in Europe, while the US continues to revel in the joys of life. There, the atmosphere is completely different.
The Federal Reserve (Fed) is preparing to announce an additional 25bp cut that the country doesn’t necessarily need on top of a 75bp cut delivered since September. The US stock markets are at ATH levels, home prices are at ATH, the US national debt is at ATH, the US CPI is no longer showing progress toward the 2% goal, growth is strong and jobs market looks fine. But the Fed is cutting the rates again.
The S&P500 was up yesterday, not to a record – but near, Nasdaq 100 however advanced to a fresh record high, with Broadcom gaining another 11% yesterday – on top of the 24% added on Friday post-earnings on their juicy forecast for custom AI chips. Nvidia however retreated another 1.68% and has officially stepped into the correction territory – after losing more than 10% since the November peak. The Big Tech buddies’ willingness to build their own chips is probably raising some questions among Nvidia investors as the company made half of its revenue from the Big Tech customers last quarter. Elsewhere, Bitcoin is exploring the moon and abouts on Trump optimism and as Microstrategy – which is a company that made its fortune by buying massive amounts of Bitcoin over the past years – is about to make its way to the Nasdaq 100 in December 23rd. Last week, the company sold around $1.5bn of shares to buy that amount of Bitcoin. It’s as if Bitcoin was joining Nasdaq.
Anyway, it’s all very much great, though there are rising worries about the possibility that we might be seeing a bubble in the US markets. The S&P500 hasn’t deviated from its long-term trend this widely since the dot-com bubble. But a bubble is not a bubble until it bursts. For now, Trump and Powell are giving investors all the support and the money in the world to stick with their positions.
On a side note: the big banks’ dollar expectations are rather soft. Société Générale sees the US dollar weaken 7% against the euro next year, pointing at the ballooning US budget deficit. The reality is that, we’ve been hearing about the US budget deficit for years, and yet...
In the FX, the US dollar index consolidates slightly lower than the November peak into the Fed decision, the EURUSD is waiting for a fresh direction around the 1.05 psychological mark. Released yesterday, the Eurozone December PMI numbers showed further weakness in German and French manufacturing, while activity in services looked better – certainly due to some Xmas magic. But all in all, if the Fed sounds reasonably less dovish about its policy, the EURUSD could extend losses below the 1.05 mark. Elsewhere, the USDJPY advanced to 154.50 yesterday on rising bets that the Bank of Japan (BoJ) will sit still and intervene with intervention threat. Swaps give around 20% of a rate hike this week.
Finally, in commodities, US crude kicked off the week on a bearish note, hit by disappointing news and data from China and could well return below its 50-DMA near $70.15pb – on rising global glut concerns, while cocoa futures advanced to a fresh record high on renewed concerns about the unideal weather conditions in West Africa.
Australia Westpac consumer sentiment falls as economic outlook worsens
Australian Westpac Consumer Sentiment Index declined -2.0% mom to 92.8 in December. The drop was driven by a sharp deterioration in economic expectations. The economic outlook, next 12 months sub-index fell -9.6% mom to 91.2, while the economic outlook, next 5 years dropped -7.9% to 95.9 mom, erasing nearly half of the gains from the past two months.
Westpac noted that while RBA has expressed growing confidence in inflation returning to its 2-3% target range, the latest sentiment data highlights lingering consumer uncertainty. Concerns about labor market slack and weak productivity growth continue to complicate the inflation outlook.
Looking ahead, RBA is expected to maintain its current policy stance at its February meeting, absent a significant downside surprise in inflation. Westpac anticipates the easing cycle will begin in May 2025, once clearer evidence of slowing inflation and stable labor conditions emerges.
Recovering PMIs
In focus today
In the afternoon, US November retail sales and industrial production are due for release. Leading soft indicators gave very conflicting signals in November, so the Fed will closely follow hard data releases for stronger conviction on the direction of the economy.
In Germany, we receive two growth and sentiment indicators from Ifo and ZEW. It will be interesting to see if they show the same development as the PMIs yesterday, where the German composite index rose to 47.8 from 47.5, giving some relief on the current economic situation.
In the UK, we get the labour market data for October/November where focus is on developments in wage growth, particularly in the private sector.
Economic and market news
What happened yesterday
Norges Bank yesterday announced an important change to the way it will control its balance. Starting in March 2025, Norges Bank will cap the size of its FX reserve by selling foreign exchange and buying Norwegian kroner. The purpose is to limit the rise in central bank reserves as Norges Bank's seigniorage over time otherwise would have transmitted from a higher capital to higher bank reserves. A decision on the matter has been long-awaited, and while yesterday's market reaction was limited there are still diverging views as to what the full market impact will be in 2025.
In Germany, Chancellor Olaf Scholz lost the no-confidence vote in the German parliament. PM Scholz from the SPD had called for a vote-of-confidence for the government after he dismissed his Minister of Finance from the FDP back in November. As expected, Scholz lost the vote of confidence and can now ask the German president to dissolve the parliament and call for a general election. The election is expected to be held on 23 February 2025. Currently there is no clear majority in the polls, and a new coalition government is the most likely outcome of the election.
Euro area PMIs rose more than expected in December recovering some of the large decline in November, with the composite PMI rising to 51.4 from 49.5 (cons: 49.5). The manufacturing PMI stood unchanged at 45.2 while services PMI rose more than expected to 51.4 from 49.5 (cons:49.5). Hence, the data in December shows that the services sector continues to make up for the declining activity in the industry. With the average composite PMI lower than in Q3 the data supports our view of a contraction in the economy in Q4 with GDP growth at -0.1% q/q driven by the industry. The sub-component on services prices rose to the highest level since August with both input and output sub-indexes ticking higher in December showing that there is still a modest pressure on services prices. The euro area employment PMI subcomponent declined in December, showing that the labour market is gradually cooling and supports our expectations for slightly higher unemployment in the coming year.
UK PMIs for December mirrored those from the euro area with stronger than expected services and a decline in manufacturing, recovering some of the decline we saw in November. The service sector continues to hold up the economy with an increase in private sector output offsetting a downturn in manufacturing production. Price indices higher across the board indicating some continuous stickiness in price setting, a key concern for the Bank of England. On the other hand, the employment indicator came in weak at 45.2 in services and 49.3 in manufacturing, which points to accelerated cooling in the labour market.
In the US, the PMIs painted a mixed picture with manufacturing plunging further below 50 (48.3; from 49.7), yet services growth accelerating more than expected (58.5; from 56.1). The release was positive from an inflation perspective with both services input and output price indices continuing to decline despite solid growth in both business activity and new orders. Services are the most important driver of current inflation, and according to PMI, output price pressures should continue stabilizing towards pre-pandemic levels. On the other hand, manufacturing input costs continued trending higher. Goods inflation has been less of a problem for the past couple years though.
Equities: Global equities were higher yesterday, with a new all-time high in the Nasdaq index. However, this was yet again a very narrowly led market, particularly in the US, where cyclical large-cap growth stocks, specifically in the tech, consumer discretionary, and communication services sectors, made the gains. In the US yesterday, we had more industries lower than higher yesterday, and it marked the 11th consecutive trading session where more than half of the constituents in the S&P 500 were lower. While we are fundamentally positive on equities, we must admit that narrow leadership is not a fundamental driver but more a result of late cycle animal spirit, and in similar previous occasions, it has ended in badly. In the US yesterday, Dow -0.3%, S&P 500 +0.4%, Nasdaq +1.2%, and Russell 2000 +0.6%. This morning, Asian markets are broadly lower, together with futures in both Europe and the US.
FI: There were modest movements in global bond yields yesterday and a downgrade of France from Moody's had modest impact on the French government bonds yesterday. Initially, the 10Y OAT-Bund spread widened some 5bp, but at the end of the day the spread moved just 1-2bp. The French central bank has cut their growth forecast for the French economy and looking at the other rating agencies Fitch has been stating that without a credible plan for the budget in coming years there is significant risk to the rating. Thus, we expect to see more pressure on French government bonds given the political uncertainty.
FX: EUR/USD remains rangebound, fluctuating around the 1.05 mark as attention shifts to tomorrow's FOMC meeting. EUR/GBP erased recent gains during yesterday's session following the UK flash PMIs for December showing continued stickiness in price setting. In China, the continued need for policy easing keeps the upward pressure on USD/CNY intact and we saw a move yesterday from 7.275 to 7.285. EUR/SEK is steady around 11.45 this morning after it dropped ten figures yesterday and thus left the last week's range above 11.50. This move rhymes with the post-PPM December seasonality and our repetitive call for a tactical downside potential after the cross has been trading in more and less stretched overbought territory since the peaks in early November. We keep our 1M target at 11.30. Yesterday we got the long awaited announcement from Norges Bank on how they will handle the rise in structural liquidity in the coming years. The market reaction was non-existent, which we think makes sense for NOK FX spot given the relatively small amounts. Meanwhile, NOK/SEK took a one-figure hit, down from 0.9870 to 0.9770.
Bitcoin Soars to Fresh Record High: How Far Can It Go?
Key Highlights
- Bitcoin price started a fresh rally and traded to a new all-time high at $107,643.
- BTC cleared a connecting bearish trend line with resistance at $101,500 on the 4-hour chart.
- Ethereum price seems to be facing hurdles near the $4,000 zone.
- XRP is consolidating gains above the $2.20 support zone.
Bitcoin Price Technical Analysis
Bitcoin price remained supported above the $95,000 level. BTC/USD formed a base and started a fresh surge above the $98,000 and $102,000 resistance levels.
Looking at the 4-hour chart, the price settled above the 100 simple moving average (red, 4-hour) and the 200 simple moving average (green, 4-hour). It even cleared a connecting bearish trend line with resistance at $101,500.
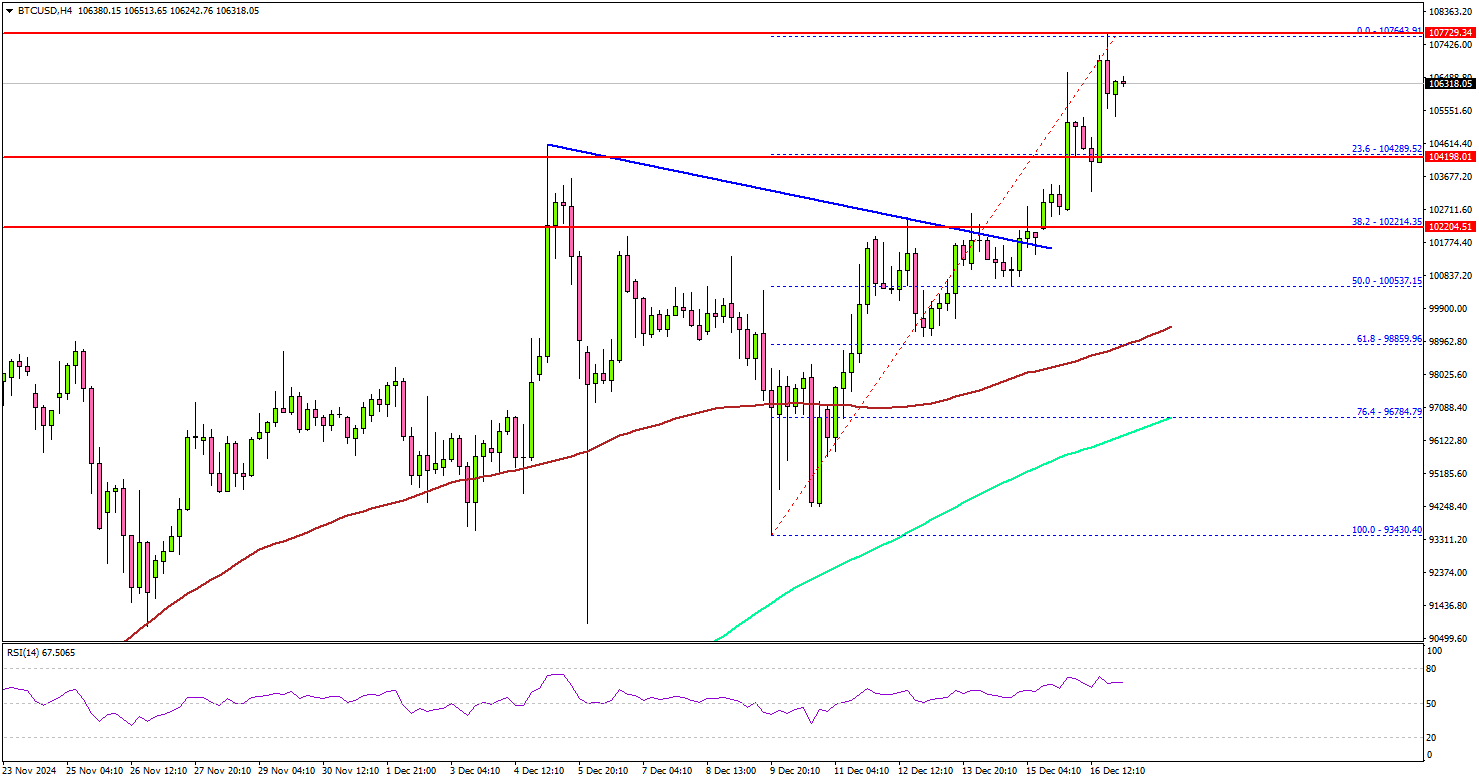
The price surpassed $104,000 and traded to a new all-time high at $107,643 on TitanFX. The price is now consolidating gains above the 23.6% Fib retracement level of the upward move from the $93,430 swing low to the $107,643 high.
Immediate support is near the $105,500 level. The next key support sits at $104,000. A downside break below $104,000 might send Bitcoin toward the $102,000 support. Any more losses might send the price toward the $100,000 support zone or the 50% Fib retracement level of the upward move from the $93,430 swing low to the $107,643 high.
On the upside, the price could face resistance near the $107,500 level. The next key resistance is $108,800. The main hurdle is now near $112,000.
A successful close above $112,000 might start another steady increase. In the stated case, the price may perhaps rise toward the $120,000 milestone level.
Looking at Ethereum, the bulls pumped the price above the $3,880 and $3,920 levels before the bears took a stand near the $4,000 zone.
Today’s Economic Releases
- US Retail Sales for Nov 2024 (MoM) – Forecast +0.5%, versus +0.4% previous.
Elliott Wave View: DAX Pullback Should Find Buyers
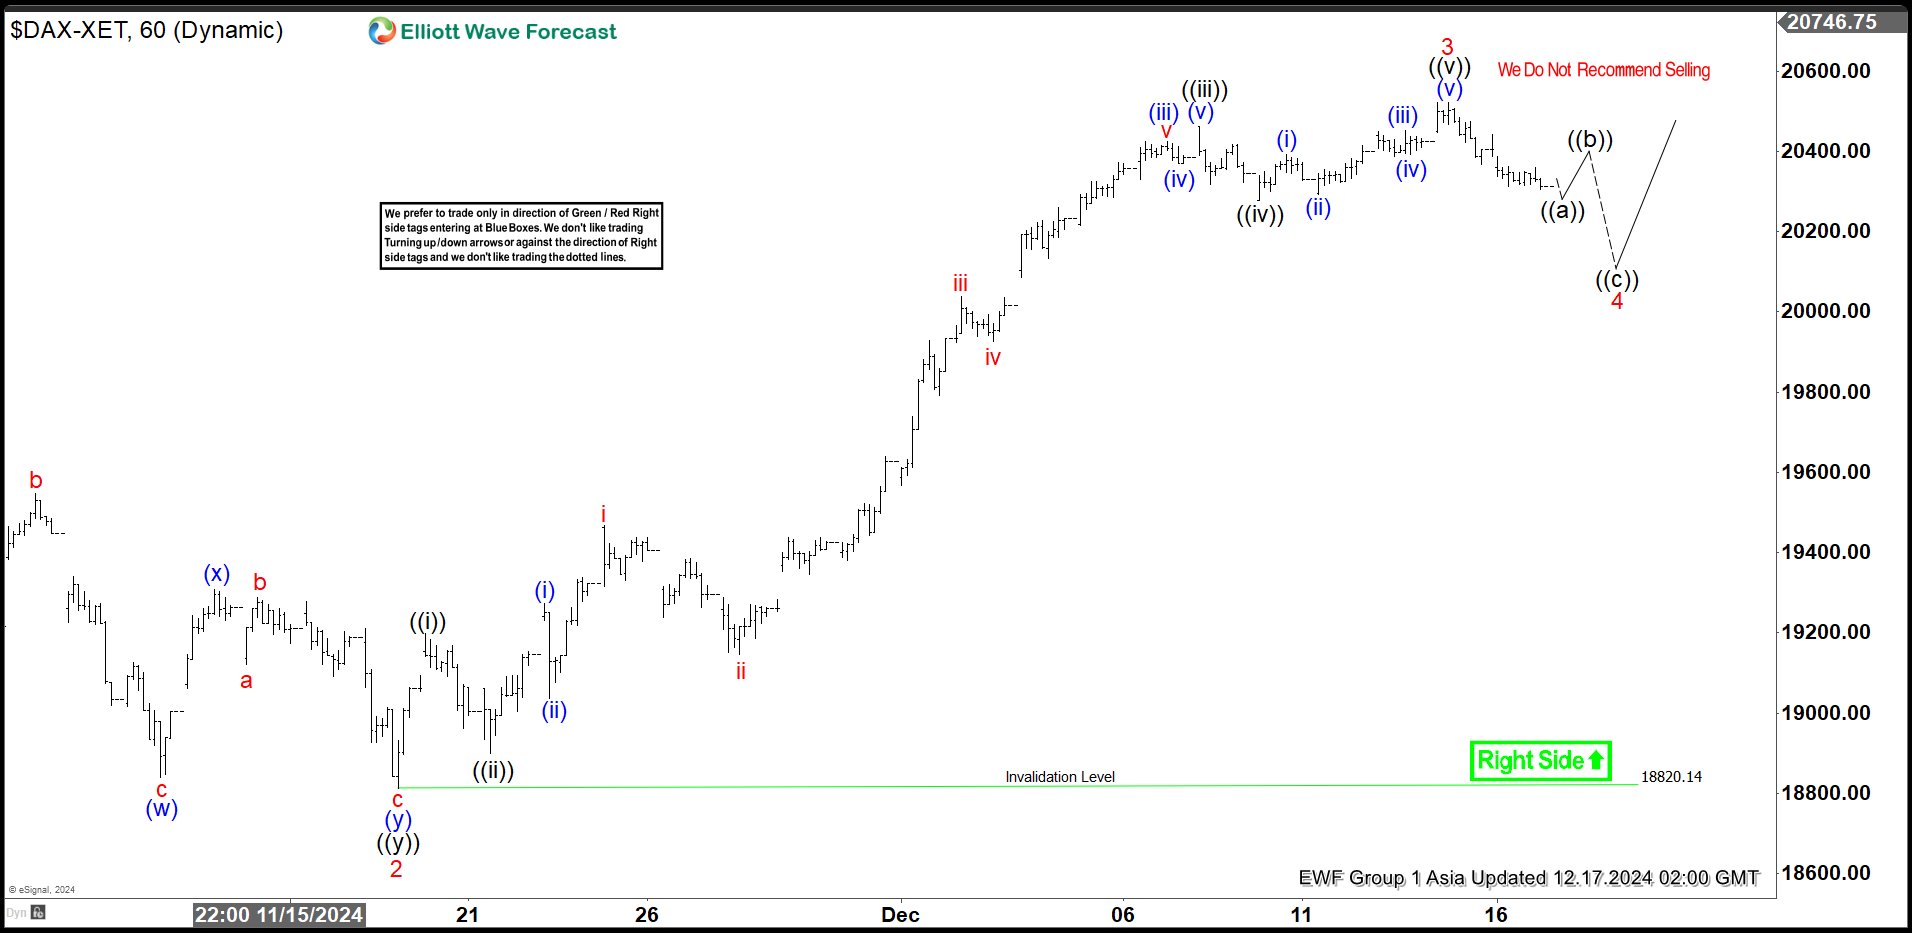
Short Term Elliott Wave View in DAX suggests cycle from 8.5.2024 low is in progress as a 5 waves impulse structure. Up from 8.5.2024 low, wave 1 ended at 19674.68 and pullback in wave 2 ended at 18812.53. Index has resumed higher in wave 3. Up from wave 2, wave ((i)) ended at 19198.74 and dips in wave ((ii)) ended at 18900.02. Index then resumes higher in wave ((iii)). Up from wave ((ii)), wave (i) ended at 19272.99 and pullback in wave (ii) ended at 19036.41. Wave (iii) higher ended at 20425.86 and pullback in wave (iv) ended at 20370.23. Final leg wave (v) ended at 20461.85 which completed wave ((iii)).
Pullback in wave ((iv)) ended at 20277.63. Up from there, wave (i) ended at 20393.86 and wave (ii) ended at 20292.86. Wave (iii) higher ended at 20453.44 and pullback in wave (iv) ended at 20393.24. Final leg wave (v) ended at 20522.82 which completed wave ((v)) of 3. Wave 4 pullback is now in progress to correct cycle from 11.19.2024 low in 3, 7, or 11 swing before it resumes higher again. Down from wave 3, wave ((a)) should end soon, then it should rally in wave ((b)) before turning lower again in wave ((c)). Wave 4 typically ends around 23.6 – 38.2% retracement of wave 3. This area comes at 19870.5 – 20120.5.
DAX 60 Minutes Elliott Wave Chart
DAX Elliott Wave Video
https://www.youtube.com/watch?v=vHA8Xg9sJ8A
EURCAD: Bearish Outlook
European Central Bank (ECB) President Christine Lagarde has signaled that more interest rate cuts may be coming if upcoming inflation data matches expectations. Speaking at the Bank of Lithuania, Lagarde mentioned that the eurozone is nearing its 2% inflation target and hinted at further easing if the current trends continue. The ECB recently reduced interest rates for the third time in a row, bringing the deposit rate down to 3% from its peak of 4% as inflation cools and economic growth slows.
Inflation in the eurozone dropped to 2.3% in November, down from over 10% last year, and is projected to fall further in the coming years. However, Lagarde cautioned that geopolitical events and potential U.S. trade policies, such as tariffs promised by Donald Trump, could impact eurozone growth and energy costs. The ECB’s next interest rate decision is scheduled for January 30, shortly after Trump’s inauguration.
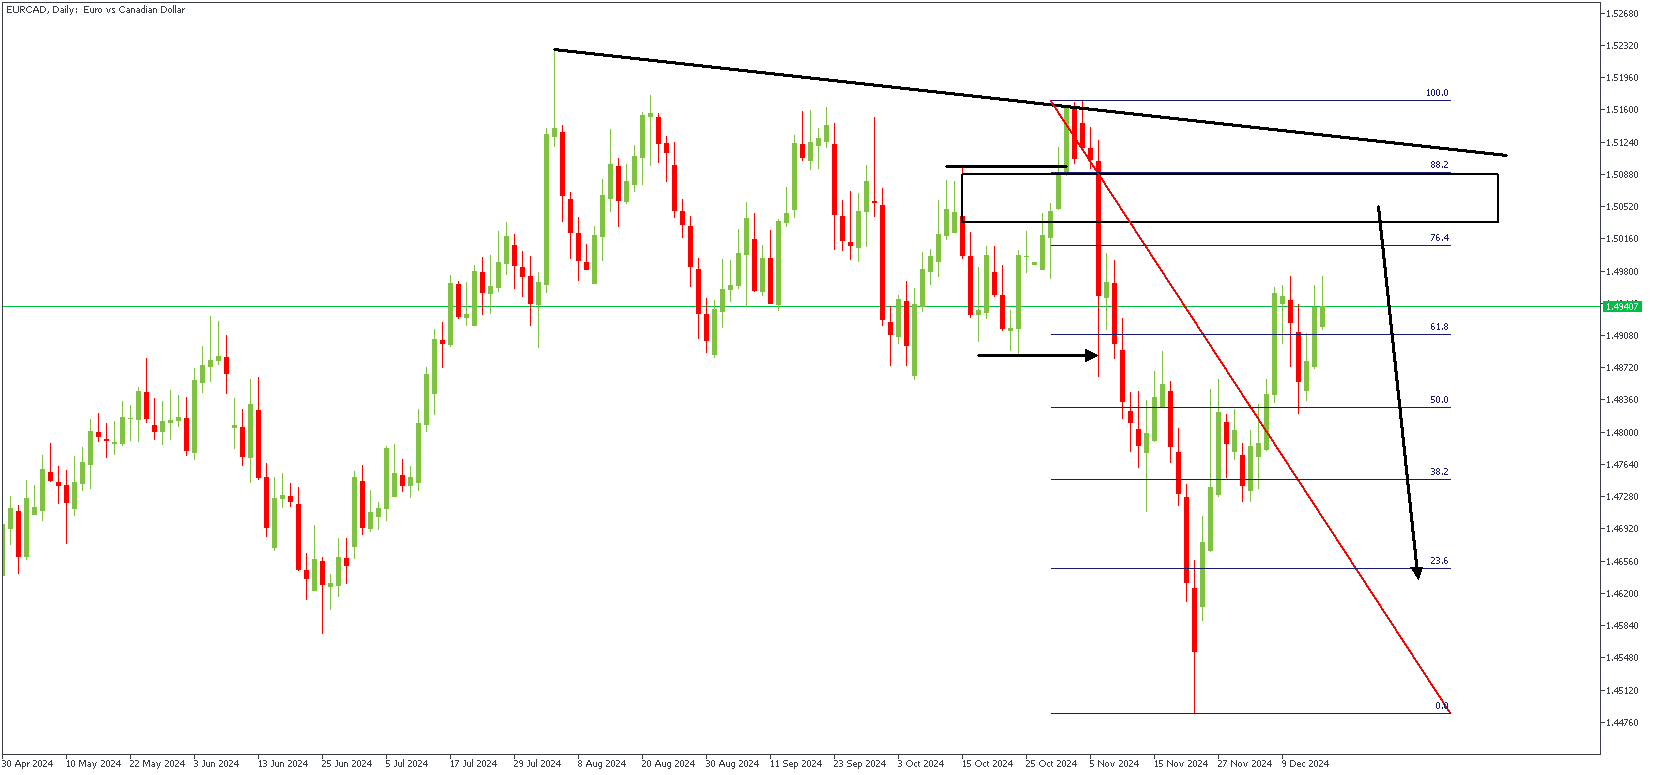
EURCAD – D1 Timeframe
On the daily timeframe chart of EURCAD, a few striking technical factors intertwine: the SBR (Sweep-Break-Retest) pattern, resistance trendline, and Fibonacci retracement levels. Since the most recent impulse created a new low, it sets the tone for a bearish sentiment afterward.
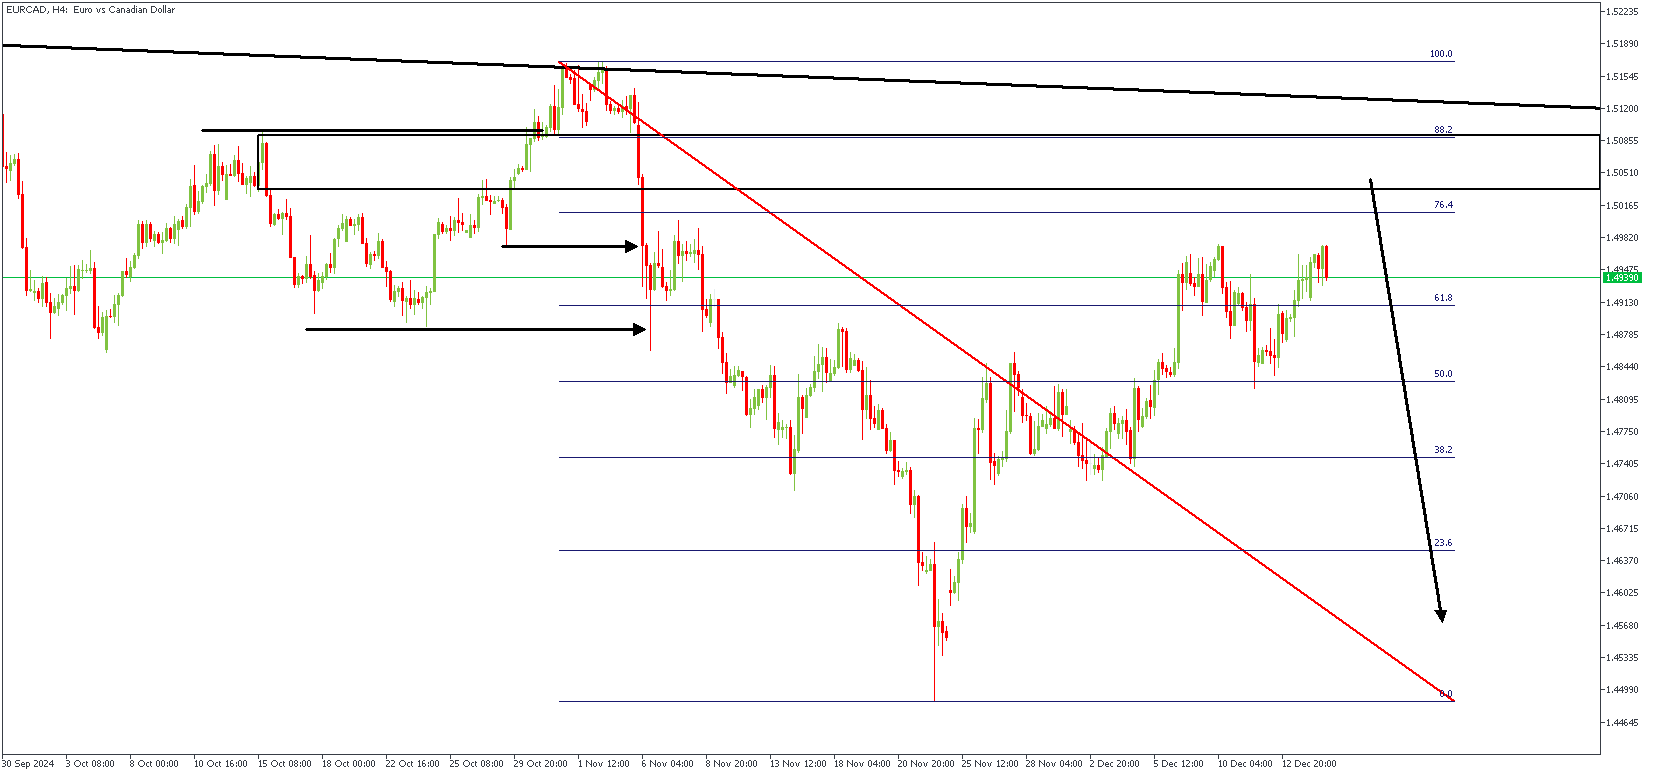
EURCAD – H4 Timeframe
In the 4-hour timeframe, the SBR pattern takes on the form of a head-and-shoulders pattern, with the right shoulder expected to be around the 88% Fibonacci retracement level. The resistance trendline will also be pivotal to the final outcome of this projection.
Analyst’s Expectations:
- Direction: Bearish
- Target: 1.46569
- Invalidation: 1.51743
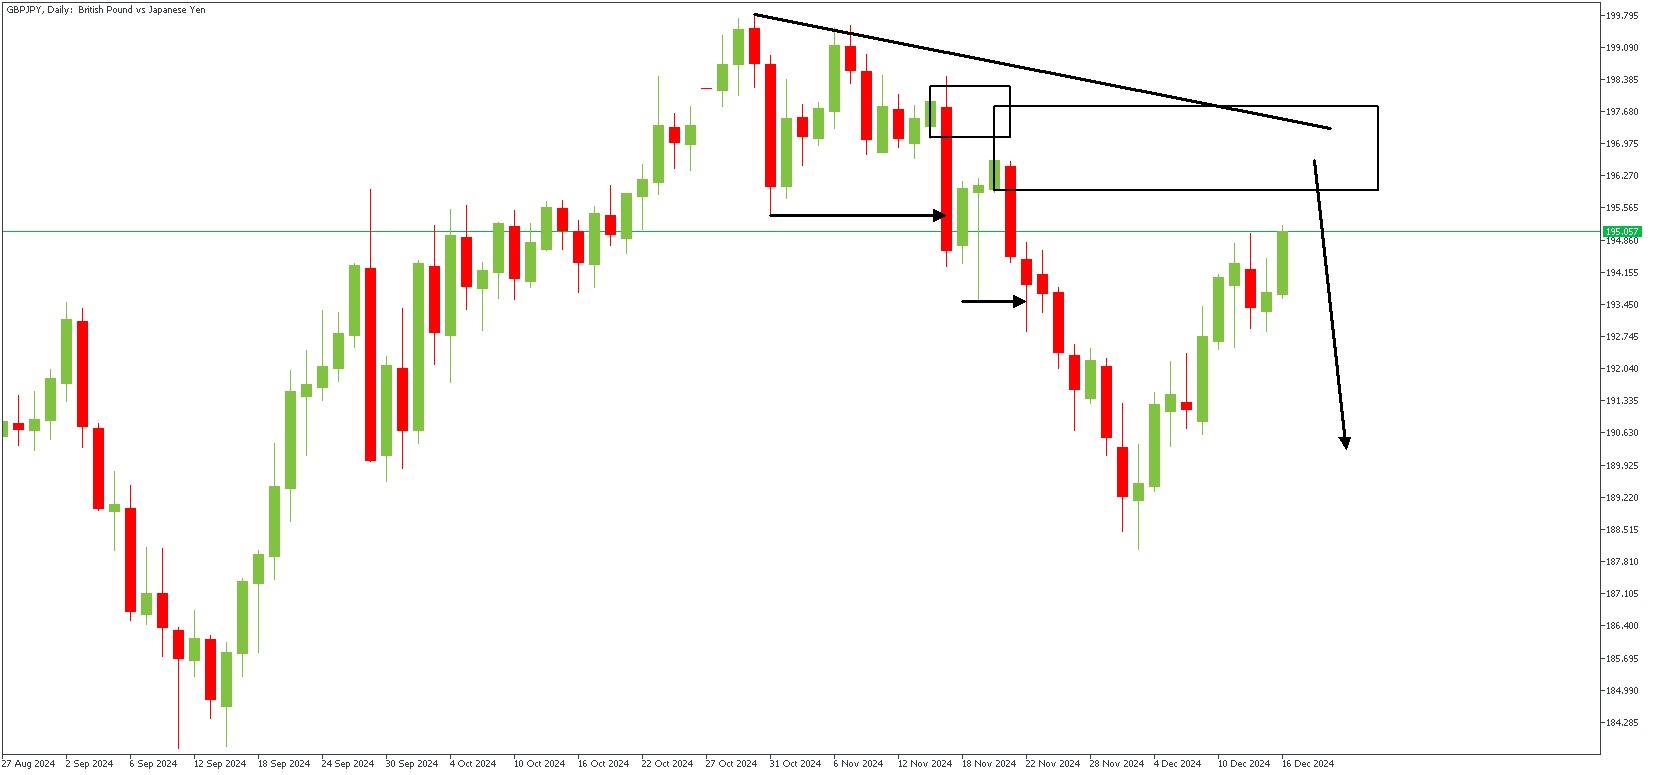
GBPJPY: Bearish Outlook
The Bank of England (BoE) faces a tricky balancing act as it prepares for its next policy decision. While the British economy has shown signs of contraction—shrinking by 0.1% for the second consecutive month—the latest BoE/Ipsos inflation expectations survey highlights a rise in public inflation concerns. Average inflation expectations for the coming year have increased to 3%, up from 2.7% in August 2024, while long-term expectations (over five years) have climbed to 3.4%, compared to 3.2% in the previous survey.
Rising inflation expectations are critical for policymakers because public perception of future inflation can influence current spending behavior. If people believe prices will rise, they may spend more now, driving up demand and fueling actual inflation further—a self-reinforcing cycle.
Despite these inflation concerns, the BoE faces mounting pressure to cut interest rates in 2025, with markets anticipating three to four rate reductions. The move aims to stimulate economic growth in a slowing economy, but inflation risks limit how aggressively the central bank can act.
The BoE's announcement this week will need to carefully balance these conflicting dynamics—addressing inflation concerns without further stifling economic recovery.
GBPJPY – D1 Timeframe
The downward slope of the resistance trendline on the daily timeframe chart of GBPJPY indicates that the current trend is bearish. Following the market structure, the price recently broke below the previous low, with the supply zone a few pips from the current price. Now, we can check if the lower timeframe aligns with the bearish sentiment.
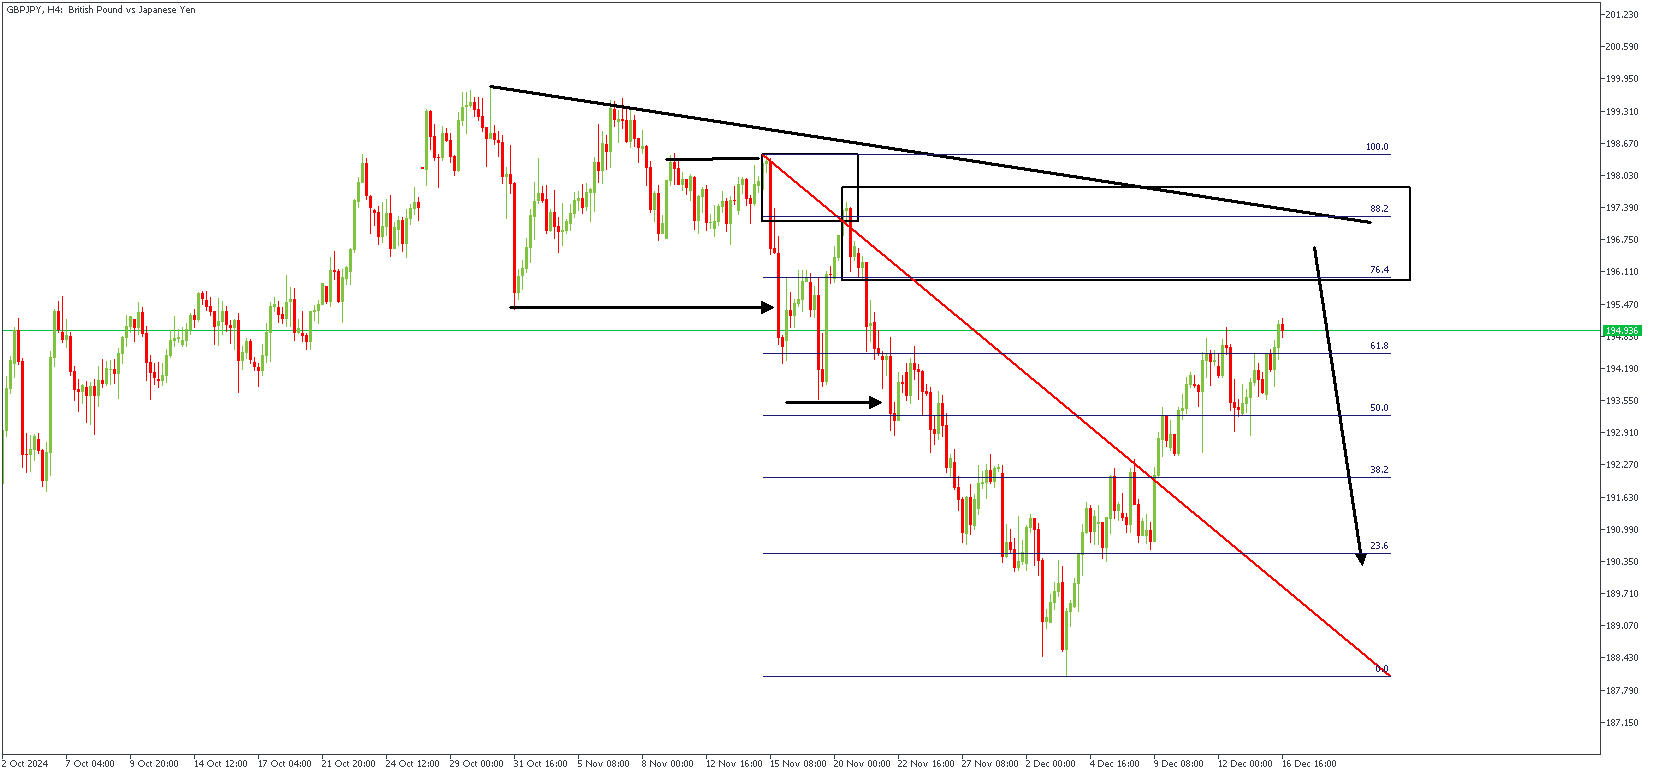
GBPJPY – H4 Timeframe
Plotting a Fibonacci retracement of the recent bearish impulse, we see that the critical zone rests between 196.110 and 197.390. Considering the SBR pattern formed, the 76% Fibonacci retracement level, trendline resistance, and the rally-base drop supply zone, the sentiment leans heavily towards a bearish outcome.
Analyst's Expectations:
- Direction: Bearish
- Target: 189.971
- Invalidation: 198.700
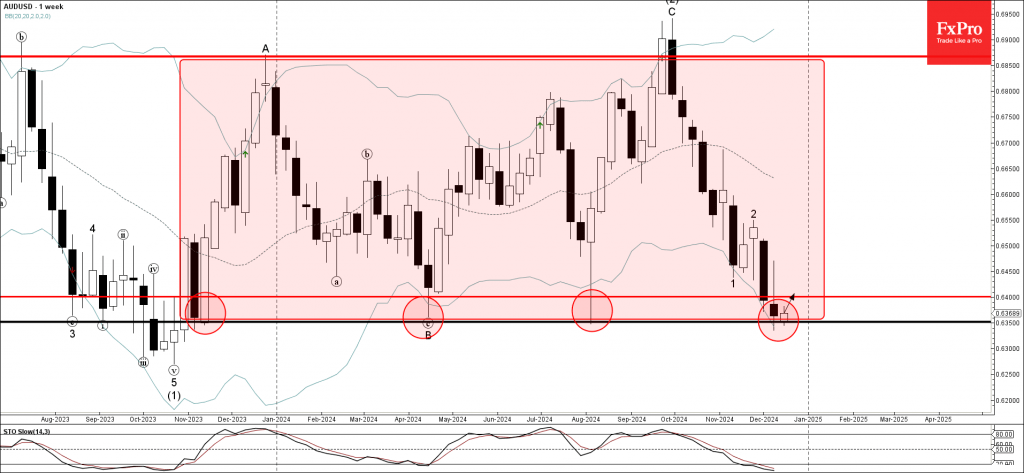
AUDUSD Wave Analysis
- AUDUSD reversed from support zone
- Likely to rise to resistance level 0.6400
AUDUSD currency pair recently reversed up from the support area set between the strong support level 0.6350 (which has been reversing the price from 2023, lower border of the weekly sideways price range) and the lower weekly Bollinger Band.
The upward reversal from the support zone stopped the previous impulse waves 3 and (3).
Given the oversold weekly Stochastic and the strength of the support level 0.6350, AUDUSD currency pair can be expected to rise further to the next resistance level 0.6400.
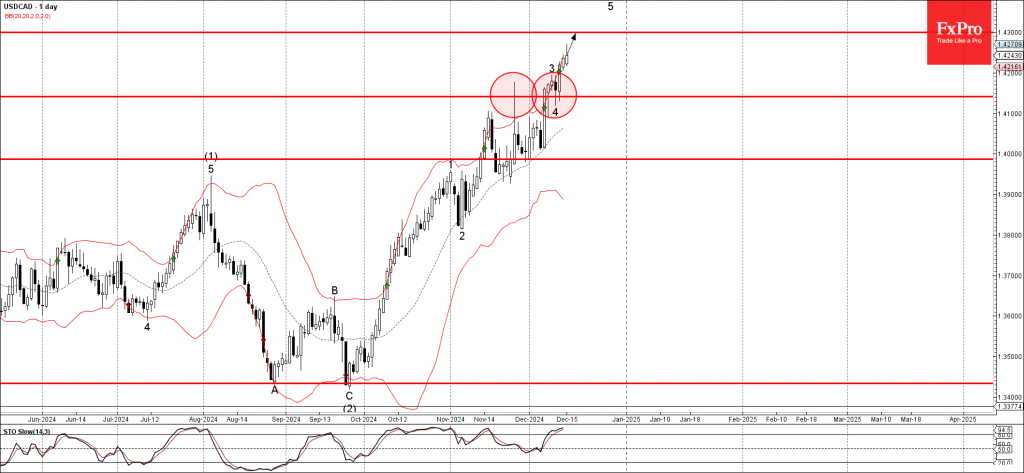
USDCAD Wave Analysis
- USDCAD reversed from support zone
- Likely to rise to resistance level 1.4300.
USDCAD currency pair recently reversed up pivotal support level 1.4140, former resistance level which reversed the price sharply at the end of November.
The upward reversal from the support level 1.4140 started the active impulse wave 5 of the higher order impulse wave (3) from September.
Given the clear daily uptrend, USDCAD currency pair can be expected to rise further to the next resistance level 1.4300.