Sample Category Title
Bank of England Preview – Christmas Pause in Cutting Cycle
- We expect the Bank of England (BoE) to keep the Bank Rate unchanged at 4.75% on Thursday 19 December in line with consensus and market pricing.
- Data has broadly been in line with the BoE's expectations, warranting a continued signalling of only a gradual approach to monetary policy easing.
- We expect the reaction in EUR/GBP to be rather muted with risks tilted to the topside.
We expect the Bank of England (BoE) to keep the Bank Rate unchanged at 4.75% on Thursday 19 December in line with consensus and market pricing. We expect the vote split to be 8-1 with the majority voting for an unchanged decision and Dhingra voting for a 25bp cut. Note, this meeting will not include updated projections nor a press conference following the release of the statement.
Since the last monetary policy decision in November, data has broadly been in line with the MPCs November forecasts. Headline inflation has been slightly stronger than expected but importantly service inflation was in line with expectations. Similarly, private sector wage growth matched expectations printing at 4.8% y/y in the three months to September but with more apparent loosening evident in the labour market. While the disinflationary process is broadly on track, topside risks are evident in the latest PMI surveys only further amplified by the expansionary fiscal stance. Growth has been slightly weaker than expected in Q3 and with downside risks to the Q4 growth outlook. We note that we will receive a string of key data releases just ahead of the meeting on Thursday. The labour market report for October/November is published on Tuesday 17 December and November inflation data the day prior to the meeting on Wednesday 18 December. While we do not expect the incoming data this week to move the needle for the December meeting it will likely prove pivotal in terms of the monetary policy outlook in 2025.
BoE call. In 2025, we expect cuts at every meeting starting in February and until H2 2025 where we pencil in a slow-down in the easing pace to only quarterly cuts. This leaves the Bank Rate at 3.25% by YE 2025, which is lower than markets are expecting. We do however see the risk of the only gradual approach continuing in Q1 with a pause at the March meeting. Until data sufficiently warrants it, we think the BoE will be on steady course pausing at the meeting this week with service inflation and wage growth still elevated.
FX. We expect the market reaction to be rather muted upon announcement, barring any notable surprise in CPI on Wednesday altering the guidance. On balance, we tilt towards a dovish twist, which does suggest some slight EUR/GBP topside following the release of the statement. More broadly, we expect EUR/GBP to move lower in the coming quarters driven by BoE lagging peers in an easing cycle for the time being, UK economic outperformance and tight credit spreads. The key risk is more forceful policy easing from the BoE.
China Economic & FX Outlook: Scenario Analysis
Summary
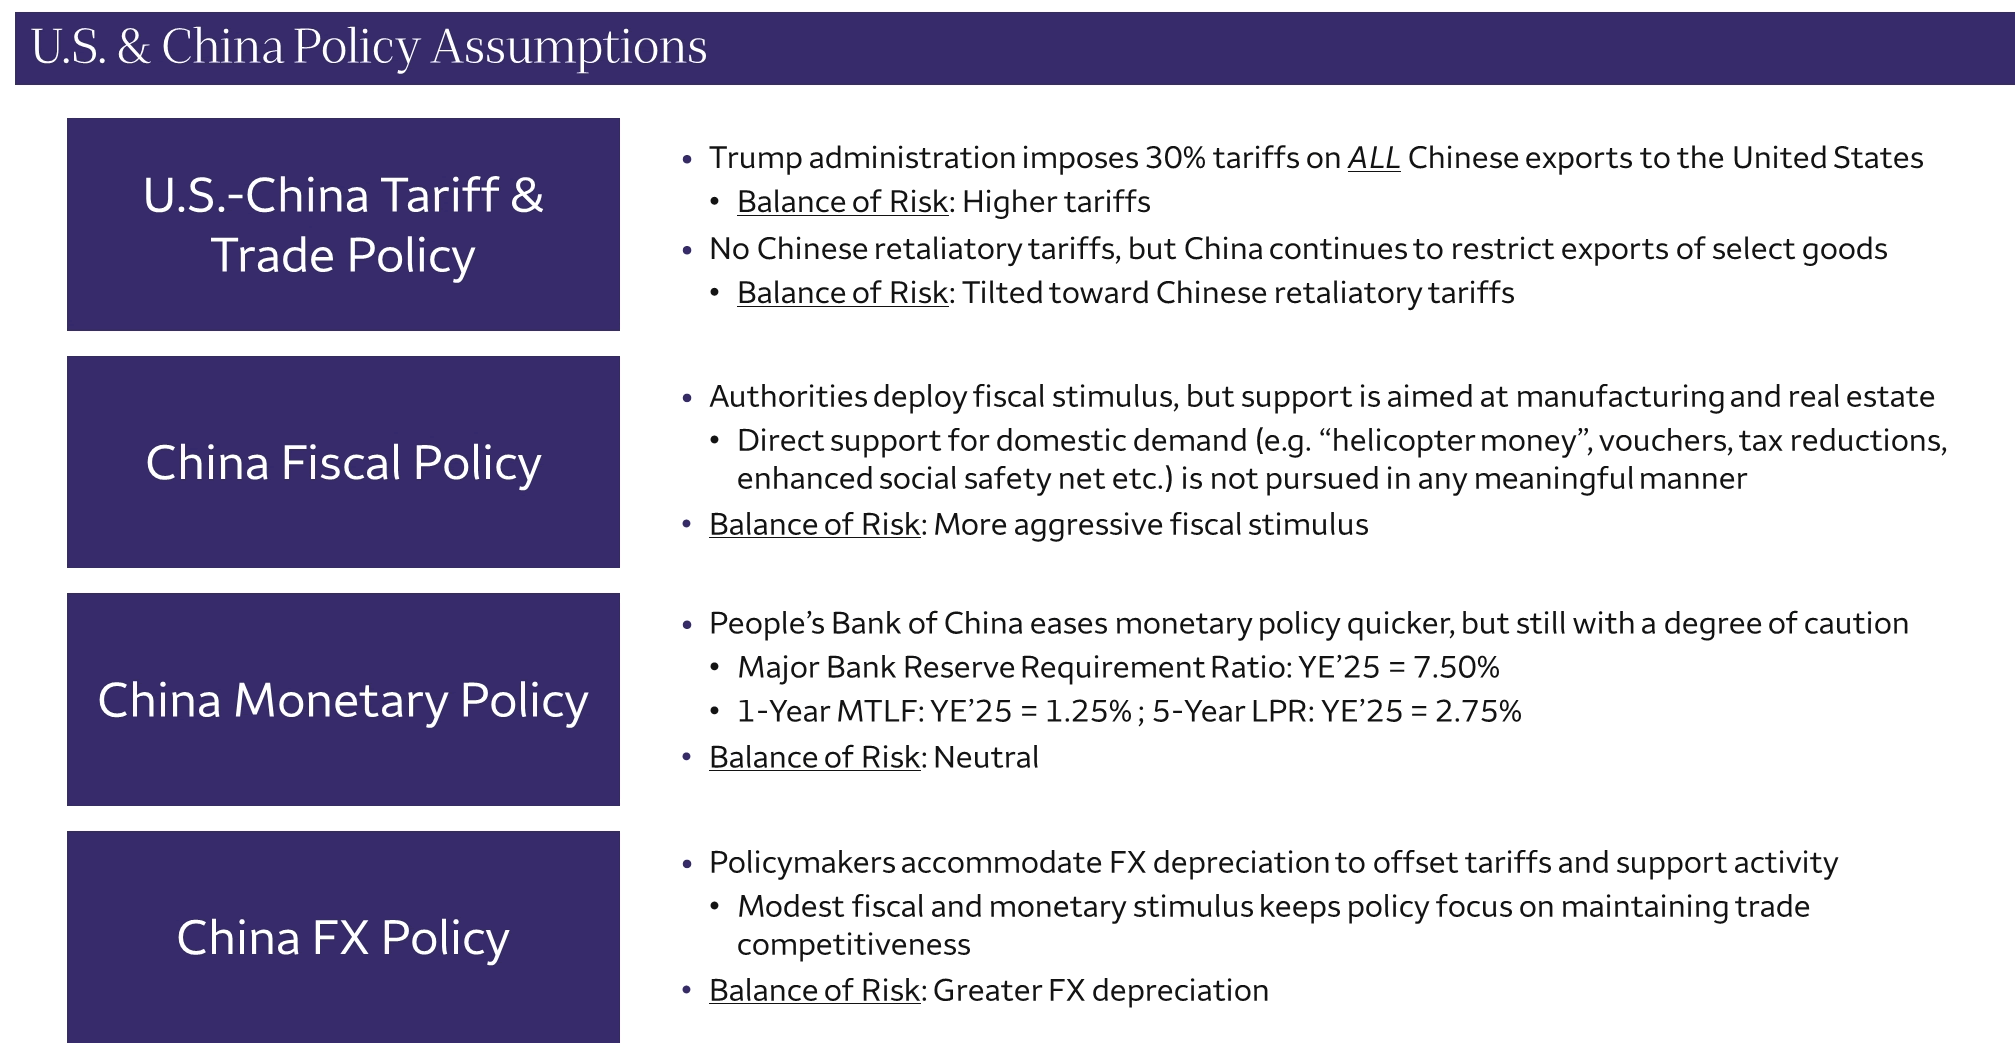
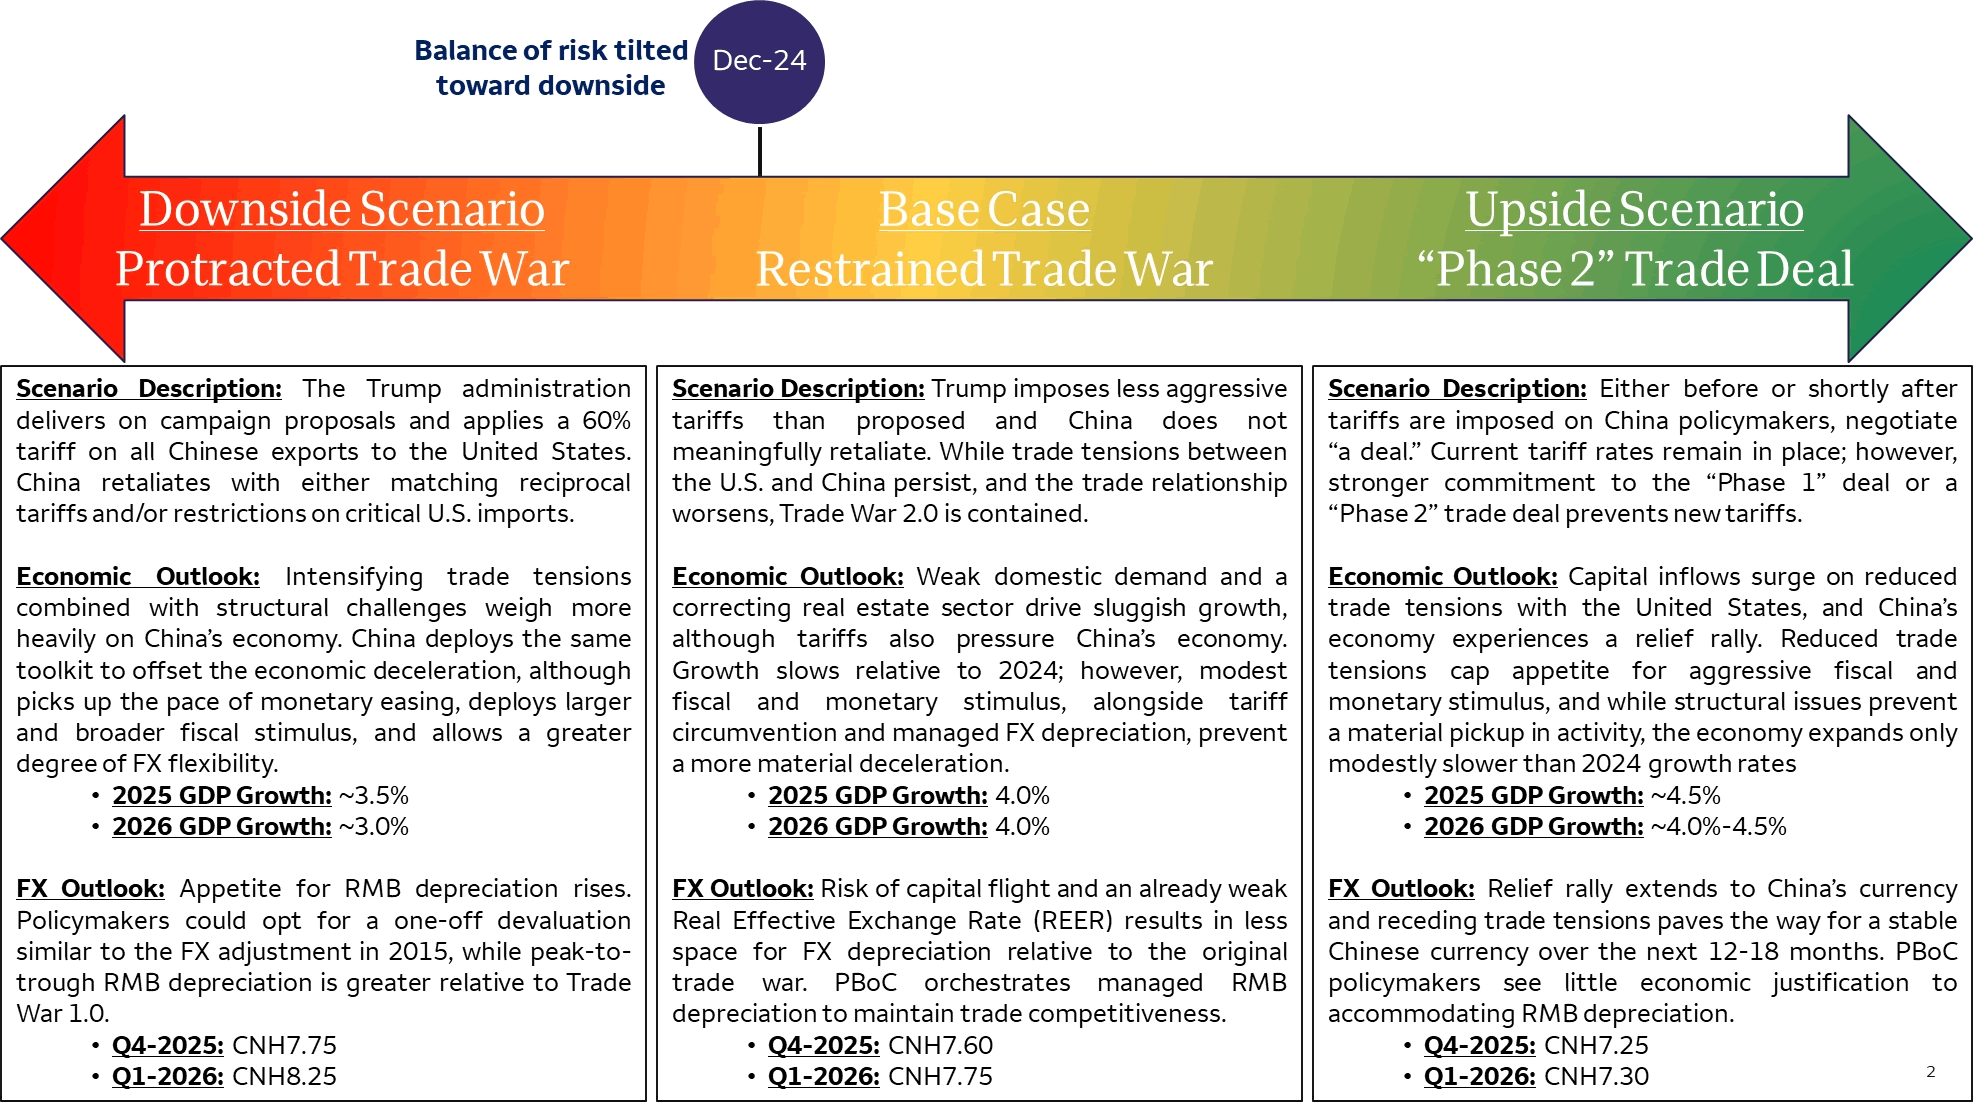
With China particularly sensitive to changes in U.S. trade and tariff policy, we find value in laying out scenarios for how China's economy and currency could evolve going forward. In this report, we outline the policy assumptions underpinning our base case for China GDP growth and the renminbi. We also offer views on how China's economy and currency could perform in a more hostile and retaliatory trade war, but also in a scenario where the U.S. and China reach a more benign “Phase 2” trade deal.
Yearly Technical Outlook 2025 – AUDUSD, NZDUSD, USDCAD
- Australia’s economic rollercoaster; Aussie in new negative paths
- New Zealand’s challenging year; Kiwi may dive further
- Canada’s economic rebound; Loonie unlocks new lows
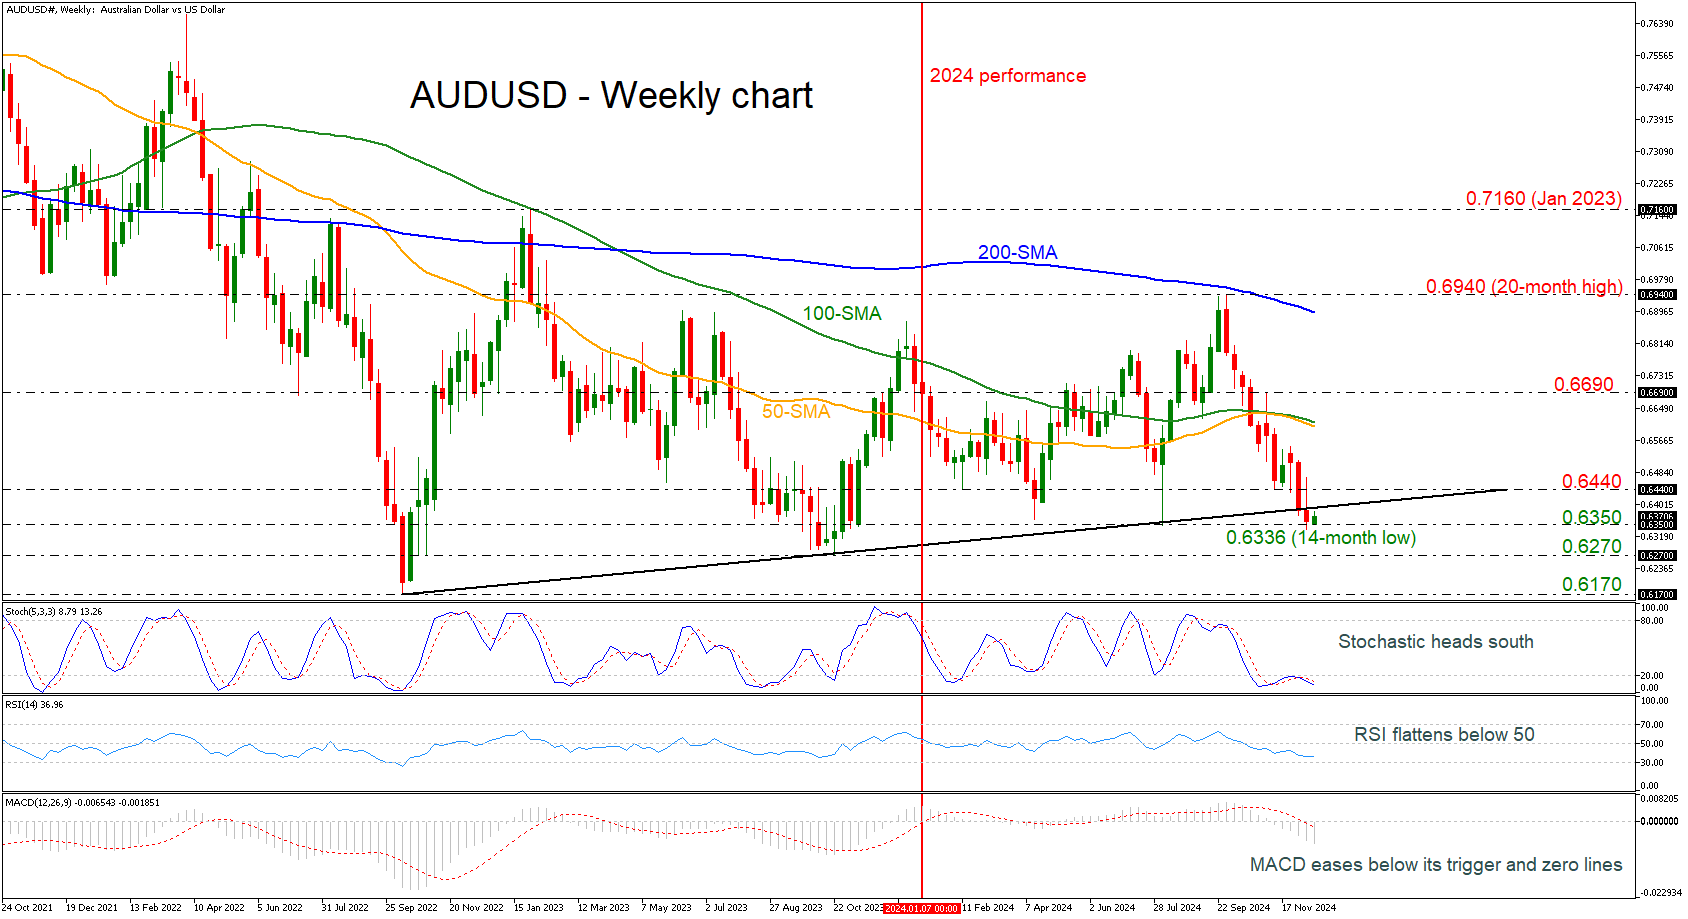
AUDUSD: Bearish sentiment starts in 2024
Australia's economy demonstrated a mixed performance this year. The RBA maintained the cash rate at 4.35% to combat persistent underlying inflation, which remained around 3.5%. Economic growth was sluggish, with GDP increasing by only 0.8% over the year. The labor market showed resilience, with the unemployment rate at 4.1% in October. The Australian dollar fluctuated due to global economic uncertainties and domestic policy decisions. In 2025, the economic outlook is cautiously optimistic. The RBA is expected to gradually reduce the cash rate as inflationary pressures ease, aiming for the 2-3% target range by mid-to-late 2025. GDP growth is projected to improve but remain below trend, supported by government spending and a recovery in household consumption. The labor market is anticipated to stabilize, with unemployment rates potentially rising slightly as demand and supply balance out.
AUDUSD has lost around 5% during 2024, but from a technical standpoint, the pair is down more than 8% following the significant pullback from the 20-month high of 0.6940. The commodity currency dived toward a fresh 13-month low at 0.6340, holding beneath the long-term ascending trend line. In 2025, the price might see further descending movements with immediate support levels coming from 0.6270 and 0.6170. However, a potential upside retracement may send traders to the 0.6440 barrier, which holds above the uptrend line ahead of the 50- and 100-week SMAs around 0.6600. Technical oscillators are endorsing the negative scenario.
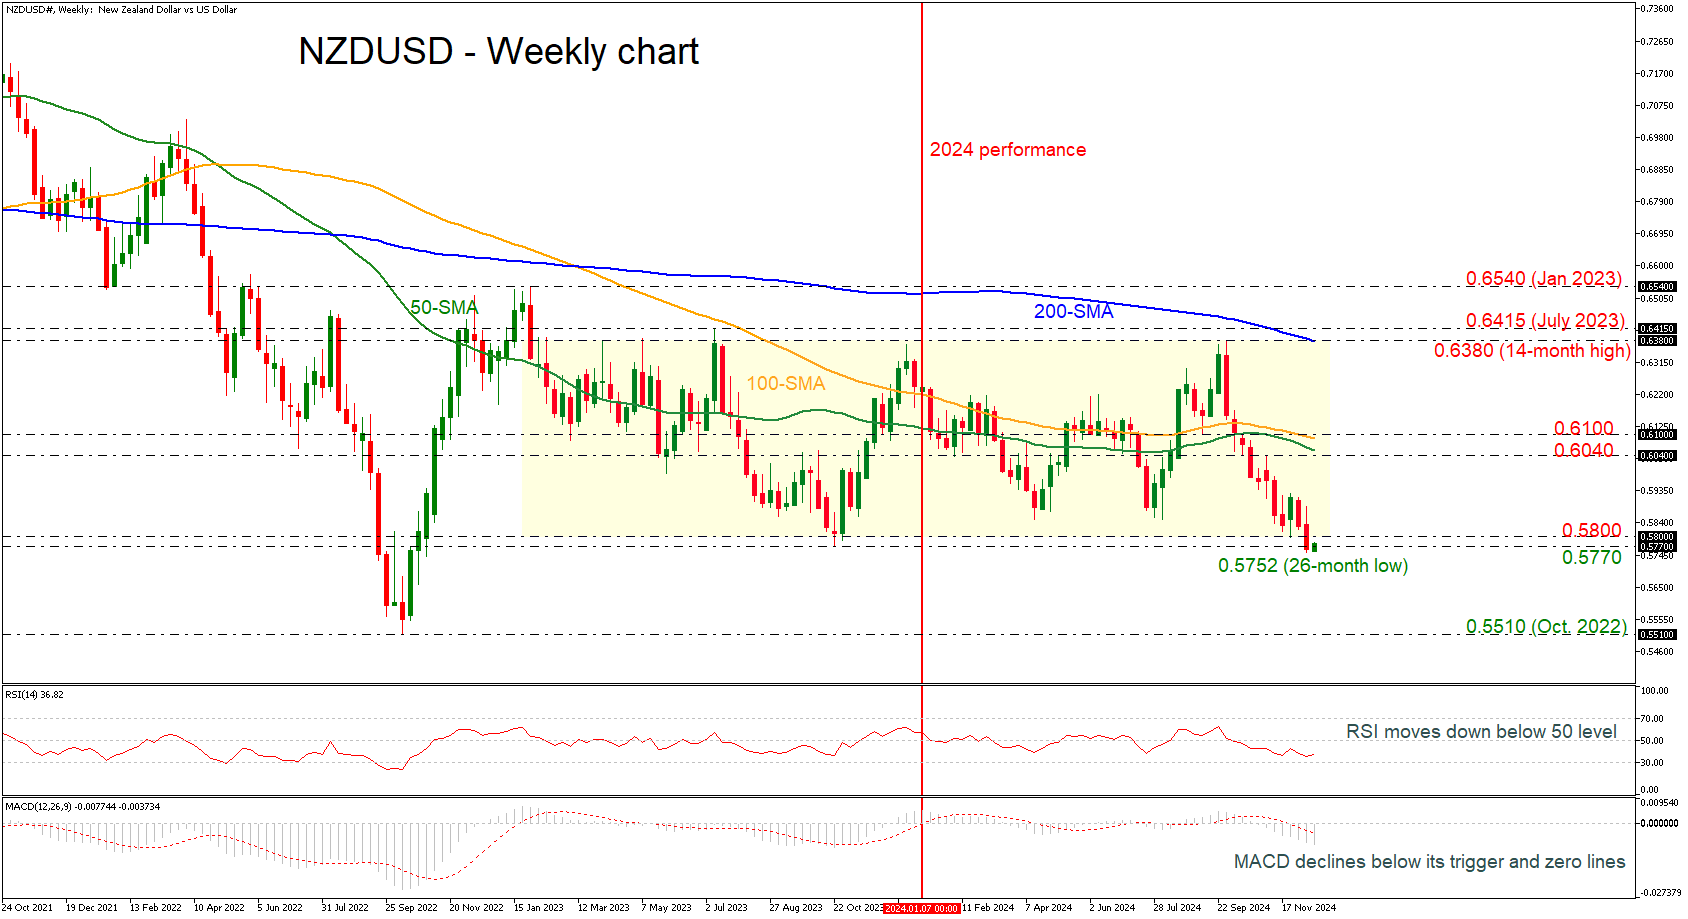
NZDUSD: Is it time to exit from the trading range?
In 2024, New Zealand's economy faced significant challenges. The RBNZ reduced the official cash rate to 4.25% to stimulate economic activity amid weak performance and rising unemployment. Inflation fell to 2.2%, within the RBNZ's target range, but domestic prices, especially for services, remained high. Despite signs of recovery, the outlook remained cautious with expectations of further interest rate cuts. Looking ahead to 2025, the RBNZ aims to keep inflation within the 1-3% range, with the OCR potentially dropping to 3.3%. GDP growth is forecasted at 2.1%, with unemployment around 5.2%. Wage growth is expected to be moderate at 2.8%.
NZDUSD has been in a consolidation area since January 2023 with the upper boundary at the 0.6380 resistance level and the lower boundary at the 0.5770 support. Currently, the market is facing a real struggle near the aforementioned support, recording a new 26-month low of 0.5752. More steeper decreases could open the way for the next round numbers, such as 0.5700 and 0.5600, before meeting the bottom from October 2022 at 0.5510. Alternatively, a higher move could support the trading range once more, with the resistance line located within the 0.6040-0.6100 area, which encompasses the 50- and 100-day simple moving averages (SMAs). Momentum oscillators are mirroring the descending movement.
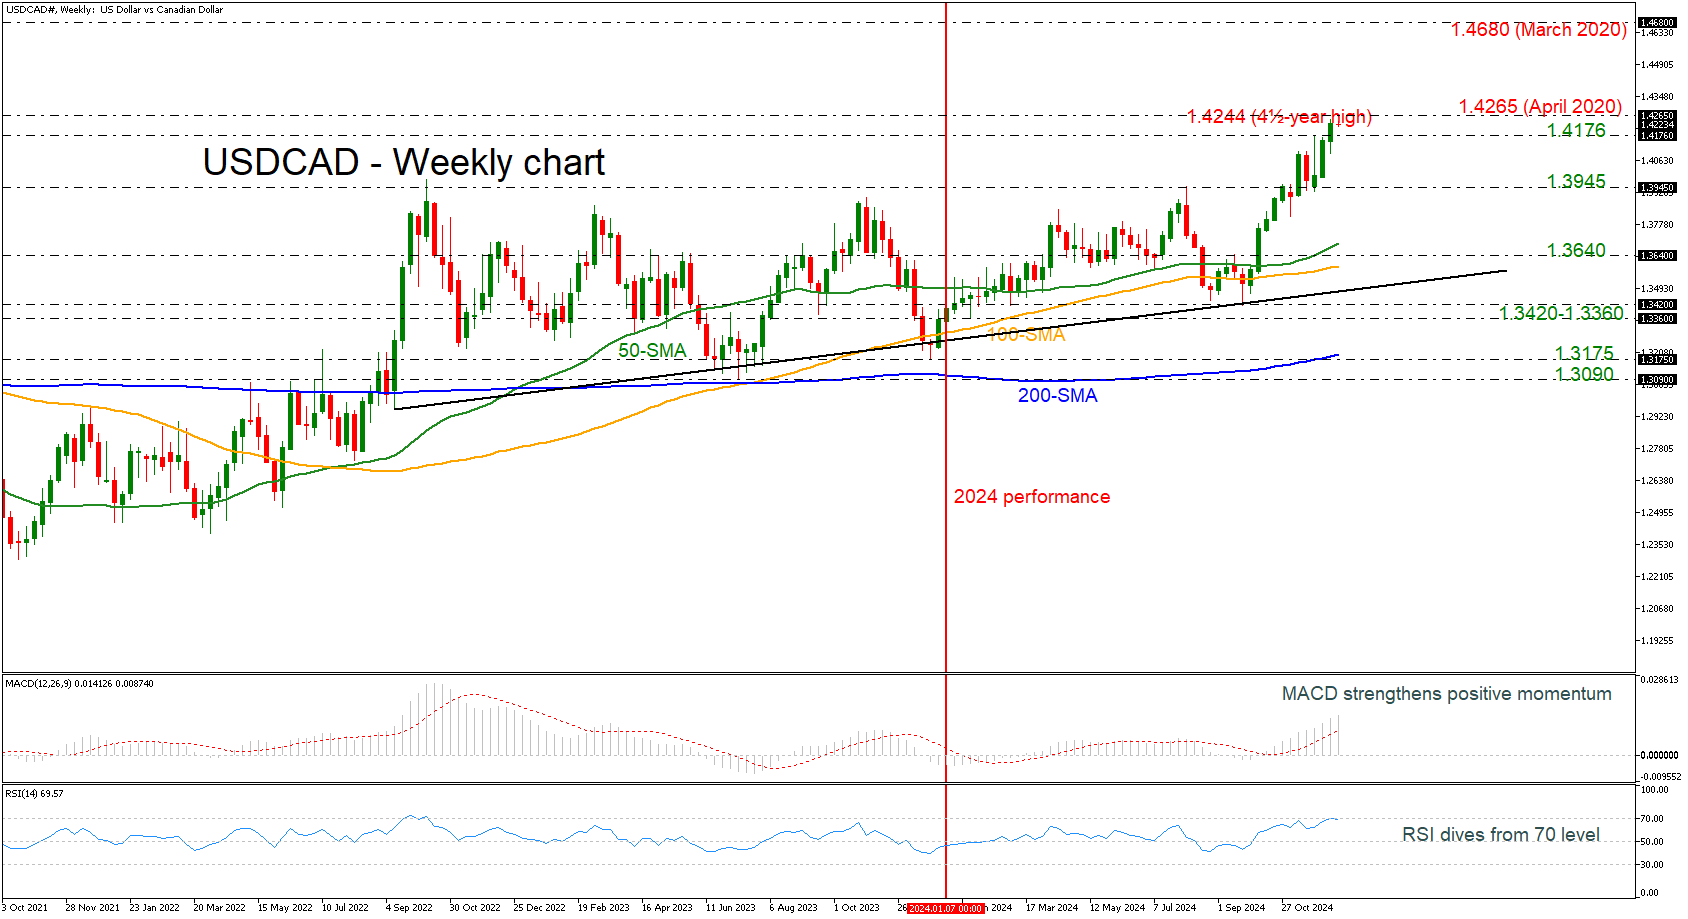
USDCAD: In new highs before 2025
Canada's economy faced several challenges during the year. The BoC reduced the policy rate to 3.75% by October to counteract weak economic growth and rising unemployment. Inflation fell to around 2%, aligning with the BoC's target range, but the distribution of inflation rates across different components remained uneven. The Canadian dollar experienced volatility, influenced by global economic conditions and domestic policy decisions. Despite these efforts, economic growth was sluggish, with GDP growth remaining modest. 2025's economic outlook is cautiously optimistic. The BoC is expected to continue reducing interest rates as inflationary pressures ease, aiming to support economic activity. GDP growth is projected to improve gradually, supported by stronger consumer spending and business investment. The labor market is anticipated to stabilize, although unemployment may remain slightly elevated.
USDCAD has been creating an intriguing bullish rally lately, sending the market to a fresh four-and-a-half-year high of 1.4244, following the strong bounce off 1.3420. The next resistance line traders should keep in mind is the April 2020 peak at 1.4265. Even higher, the March 2020 peak at 1.4680 looks to be a critical level, but first the bulls need to overcome the psychological marks of 1.4300, 1.4400, and 1.4500. On the downside, immediate support could come from 1.3945, ahead of the 50-day SMA at 1.3675 and the 1.3640 barricade. The technical oscillators are showing some mixed signals, with the RSI indicating an overstretched market and the MACD still extending its bullish momentum.
Market Year Wrap 2024: Key Highlights and Outlook for 2025
The year 2024 has been a transformative period in the global financial markets, characterised by a mix of challenges and opportunities. Inflation battles, monetary policy shifts, economic uncertainties, and surprising bouts of optimism dominated the landscape. These forces created a volatile yet dynamic environment where some markets flourished while others struggled under significant pressure.
From central bank interventions to geopolitical developments and technological advancements, every corner of the financial world experienced notable activity. In this article, we will take a detailed look at the major trends and events shaping the global economy in 2024 and provide insights into what lies ahead in 2025.
Inflation and Interest Rates: A Balancing Act
In 2024, inflation showed signs of moderation globally. In the United States, it stabilised around 2.7%, marking a notable shift that bolstered market confidence and set a cautiously optimistic tone for the broader economy.
Throughout the year, rate cuts dominated monetary policy discussions. Following the unprecedented rate hikes implemented in response to the COVID-19 pandemic, major central banks began scaling back rates. However, they had to walk a tightrope between a complex landscape of lower but still stubborn inflation and resilient labour markets and the necessity for monetary easing. The magnitude and pace of these cuts varied significantly, reflecting differences in economic conditions across regions and creating complex relationships in the forex market.
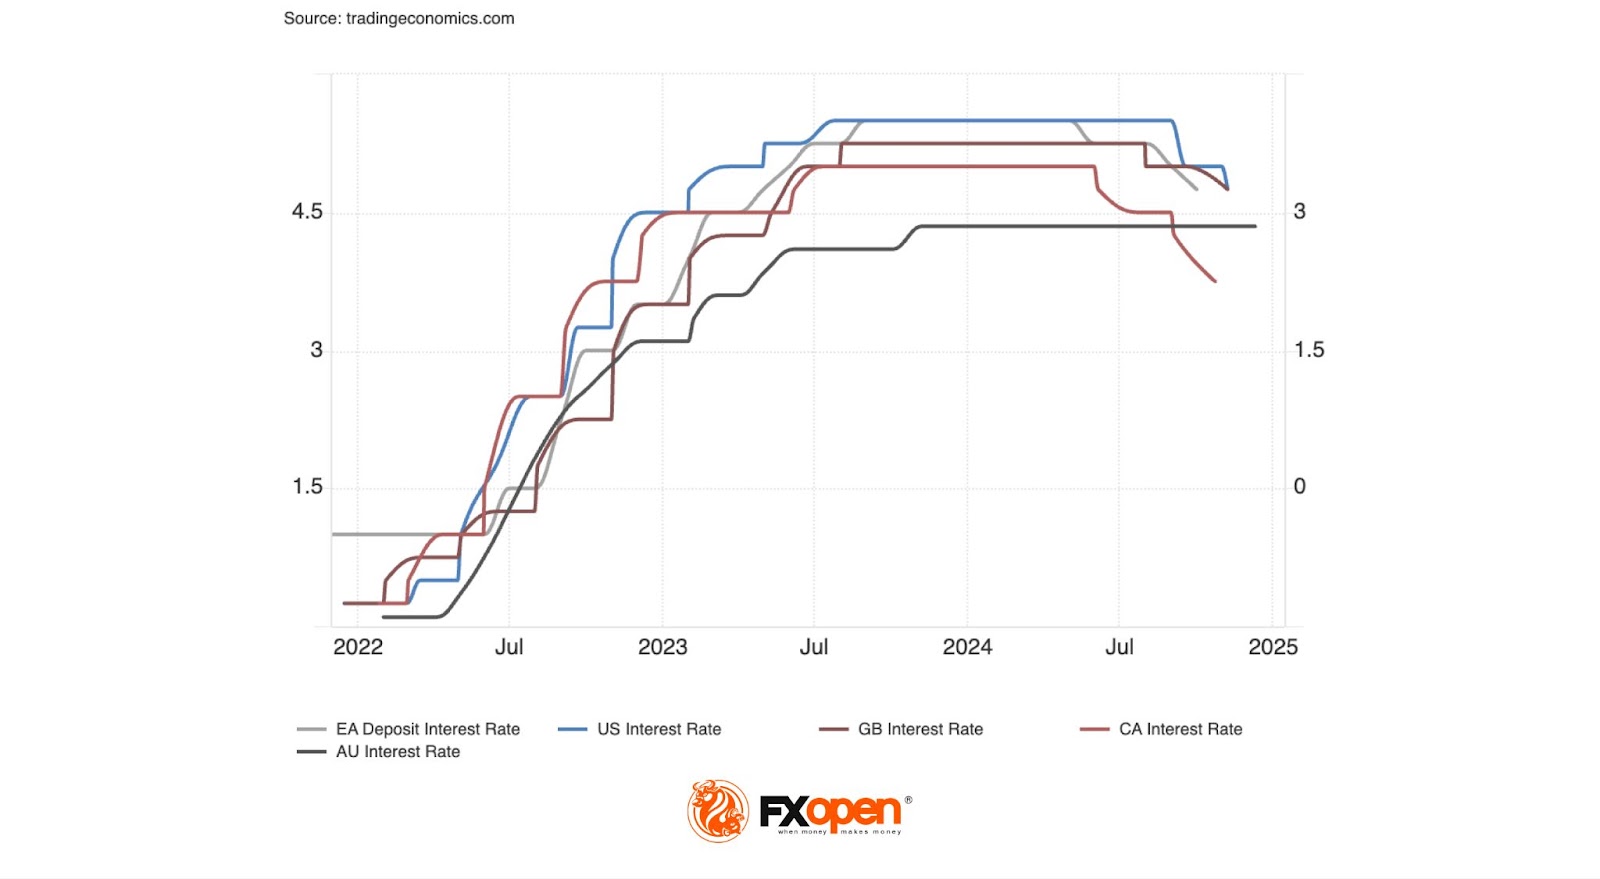
Analysts widely anticipate that policymakers will adopt a more measured approach to easing monetary policy as 2025 unfolds. Most developed market central banks, excluding Japan, are expected to reduce interest rates to neutral levels by the year's end. However, if economic conditions deteriorate more than anticipated, there is potential for central banks to push rates below neutral to support growth.
The Fed, in particular, faces a delicate balancing act, as it must carefully navigate potential policy developments—such as trade tariffs—that may not ultimately materialise. At the same time, any resurgence in inflationary pressures could prompt a shift toward a more restrictive rate trajectory in 2025 and beyond, further complicating the policy landscape.
Forex Market: A Year of Divergence
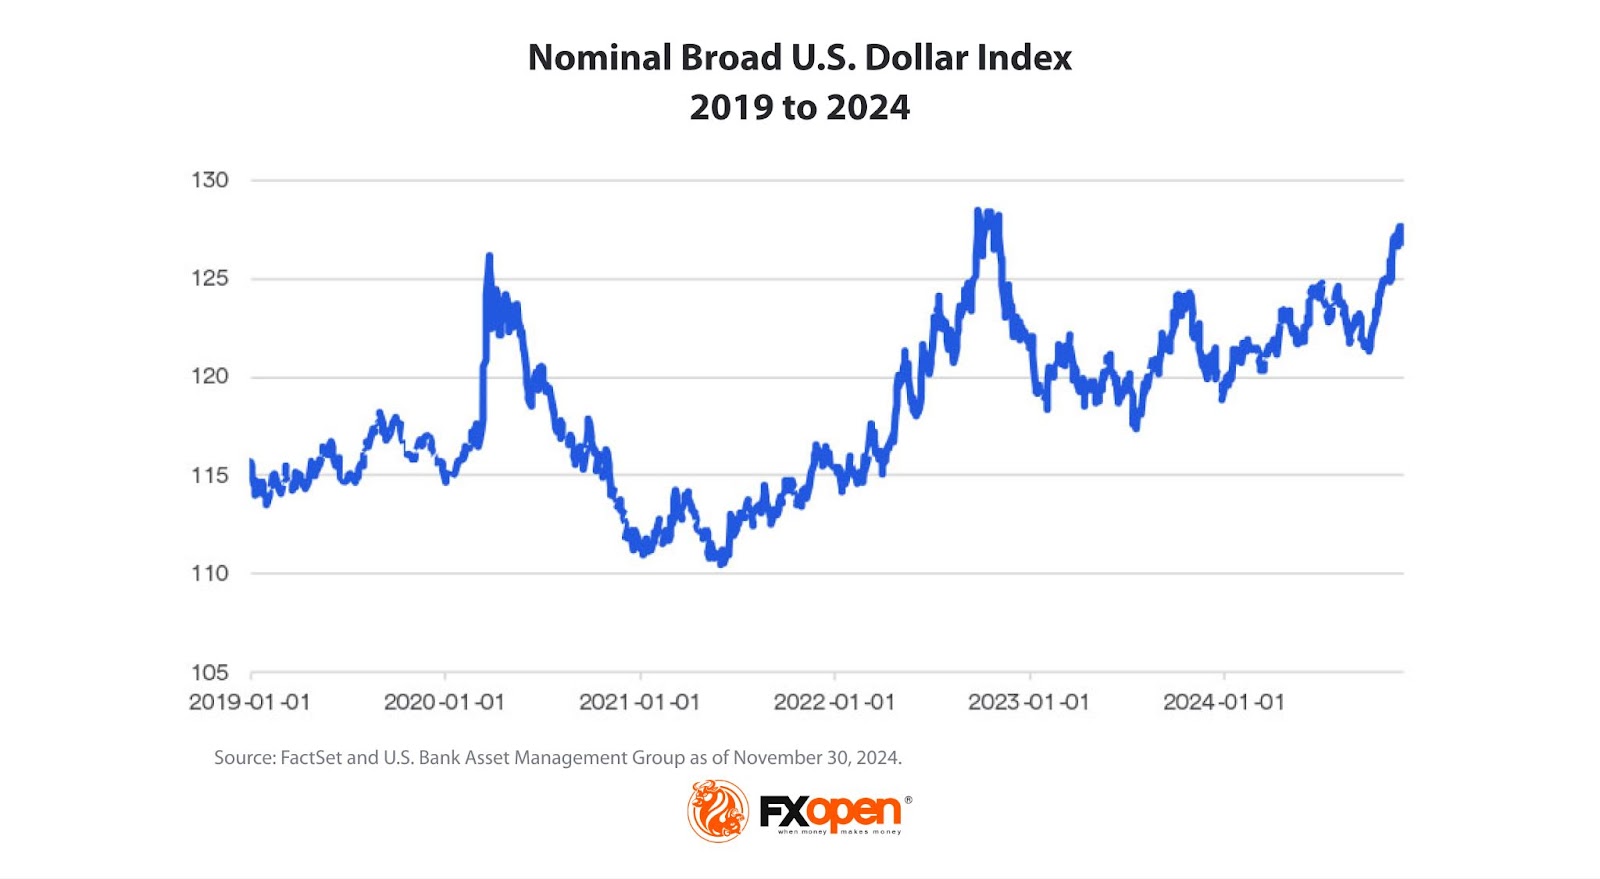
Currency markets in 2024 were shaped by a combination of monetary policy shifts, economic recovery efforts, and political developments. The US dollar experienced a rollercoaster year, initially depreciating against major currencies as markets anticipated the Federal Reserve’s first rate cut since the COVID-19 pandemic. However, it rebounded toward the end of the year, influenced by post-election optimism and expectations of protectionist trade policies under the Trump administration.
The British pound demonstrated resilience throughout 2024, supported by the Bank of England’s patient and measured approach to monetary policy. Despite potential rate cuts, the pound maintained its strength, reflecting confidence in the UK’s economic fundamentals. In contrast, the euro faced significant headwinds. The ECB’s aggressive easing measures widened interest rate differentials with the pound and the dollar, weakening the euro. By the end of the year, trade uncertainty stemming from potential US tariffs weighed heavily on the euro, given the Eurozone’s dependence on global trade.
The Japanese yen experienced mixed fortunes, bolstered by the Bank of Japan’s decision to raise its benchmark interest rate to 0.25%, the highest level since 2008. This move provided much-needed support for the yen, although concerns about potential US trade policies created downside risks. Meanwhile, commodity-linked currencies such as the Australian and Canadian dollars saw fluctuations driven by interest rate differentials, global trade dynamics and their respective economies' ties to the United States and China.

Analysts caution that President Trump’s tariff policies could intensify the overvaluation of the US dollar in 2025, potentially heightening the risk of global financial instability. The prospect of trade restrictions may add complexity to an already volatile economic landscape.
Commodity Markets: Precious Metals Shine, Oil Struggles
Commodity markets have seen a resurgence in investor interest. According to data from WisdomTree and Bloomberg, the proportion of investors allocating resources to commodities rose to 79% in 2024, compared to 71% in 2023—an expected rebound after a challenging year for commodities in 2023.
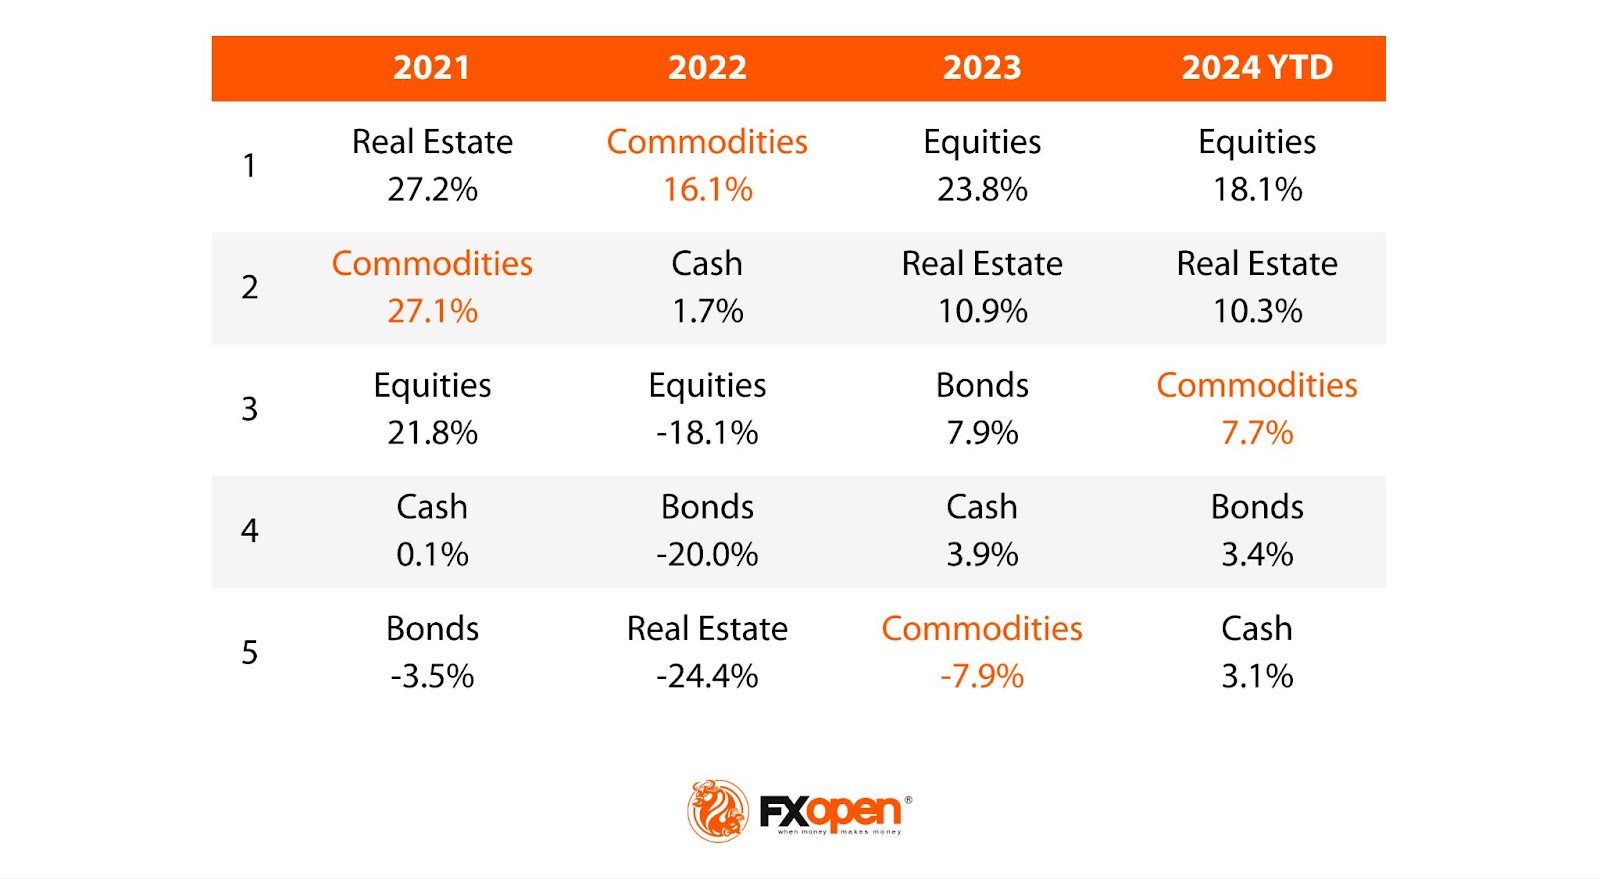
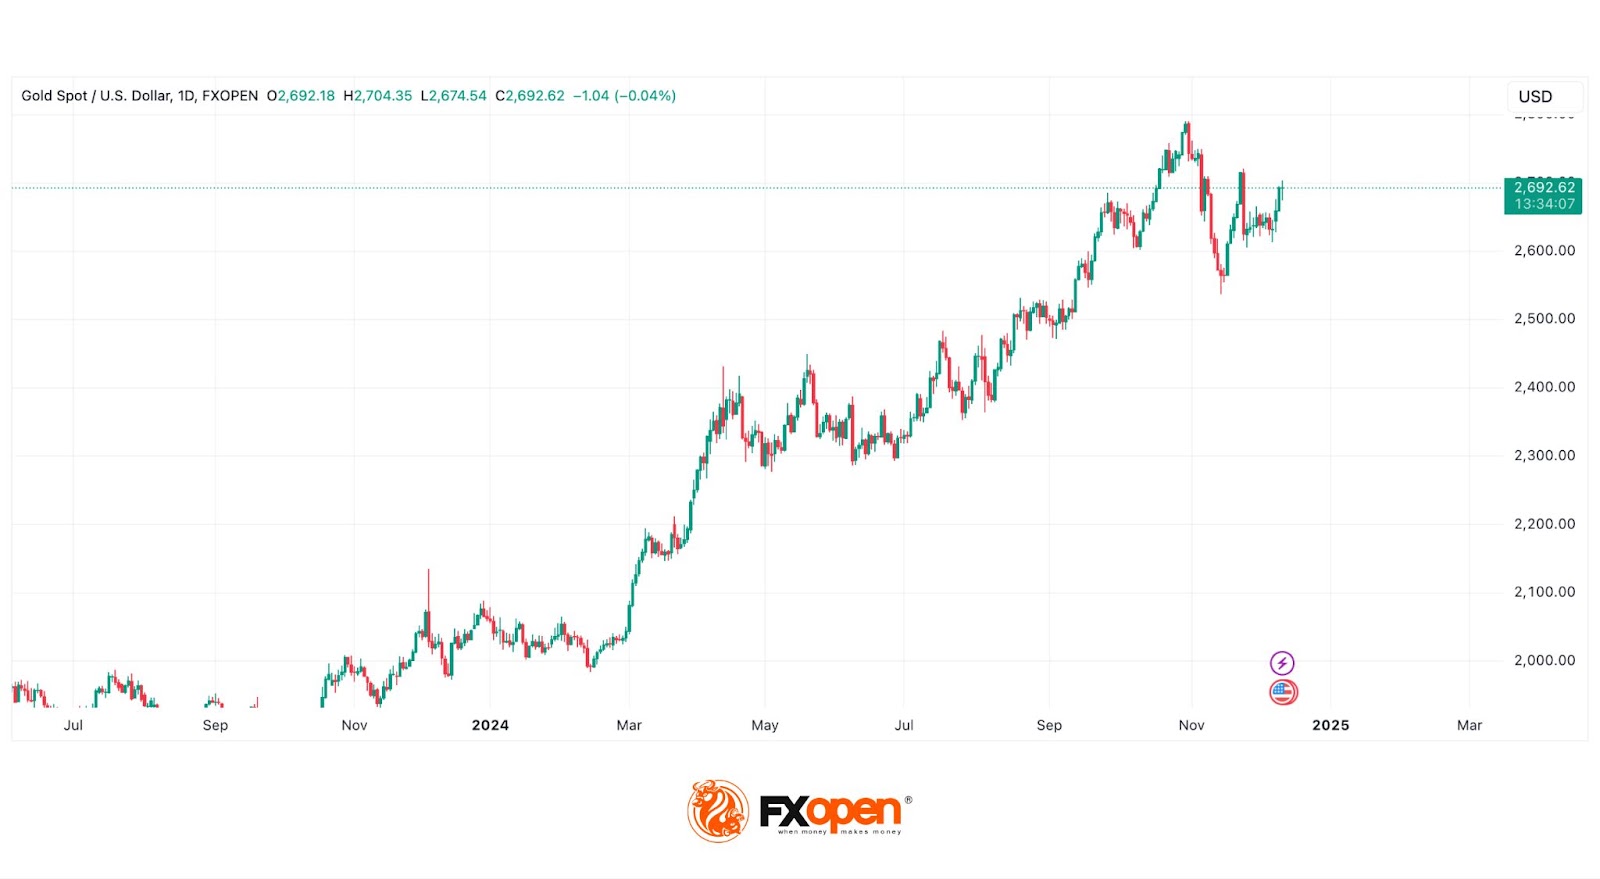
Precious metals, particularly gold and silver, emerged as top performers. As of time of the writing on 11th December, gold prices surged by over 30%, while silver outpaced gold with a 35% gain. Several factors drove these impressive performances, including geopolitical tensions, economic uncertainties surrounding the US presidential election, and strong demand from emerging market central banks. According to analysts, these factors should continue supporting precious metals in 2025.
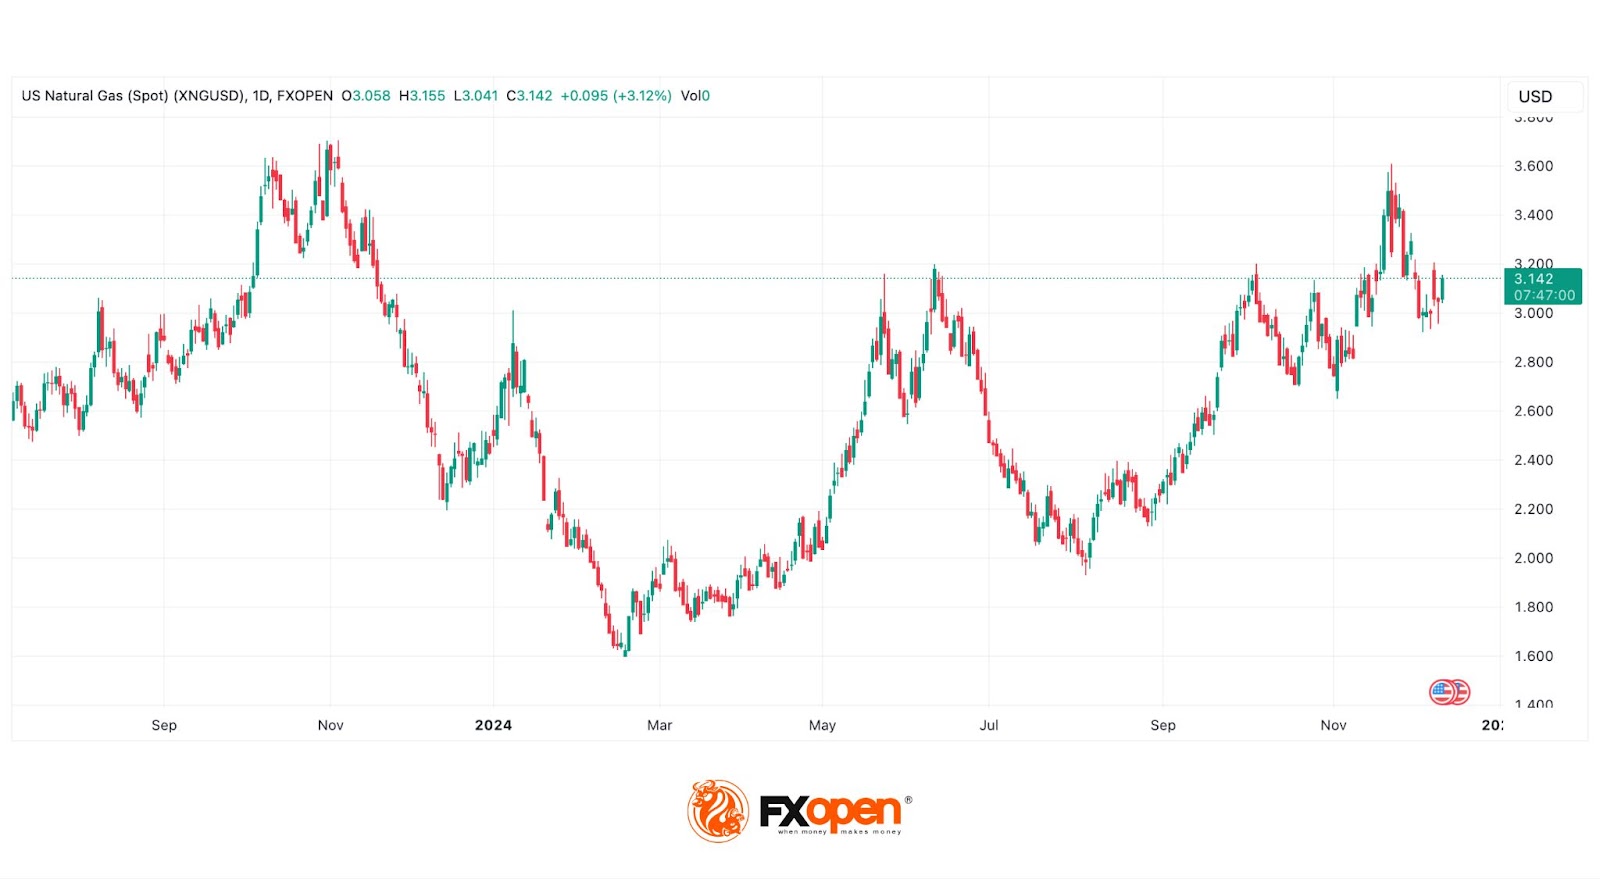
Natural gas prices also experienced significant growth, rising 30% to 50% across major markets in Asia, Europe, and North America. Colder weather forecasts have fueled demand, particularly in Europe and Asia. Analysts suggest that this bullish sentiment in gas markets is likely to persist through the winter, with prices unlikely to see significant declines until well into 2025. However, high gas prices are expected to increase power costs globally, straining fragile economic growth in key regions such as China and Europe while rekindling inflationary concerns.
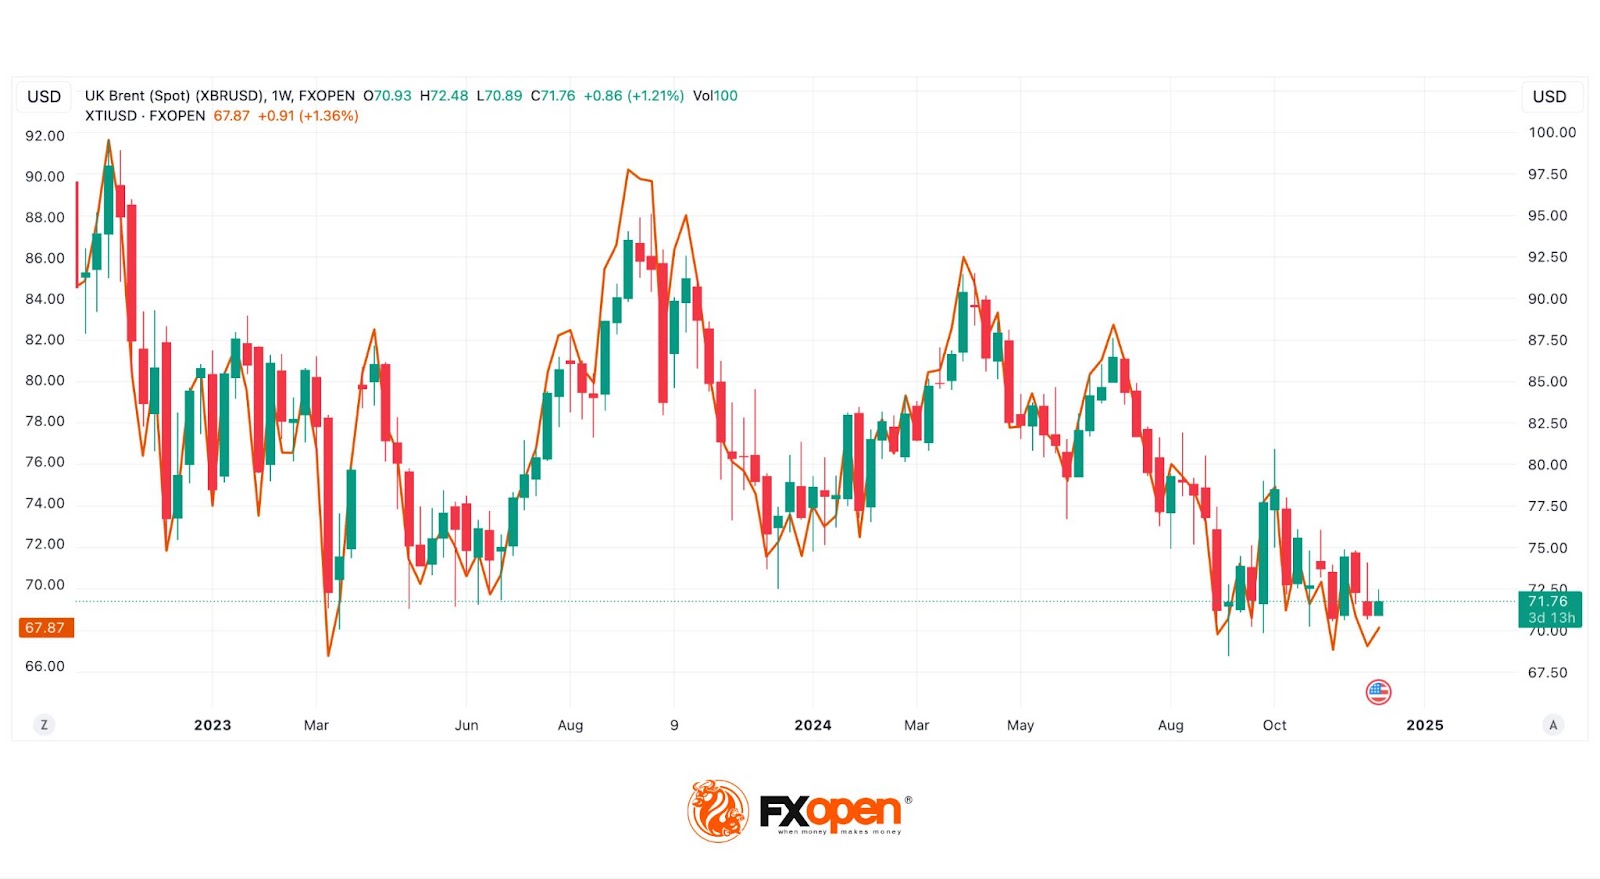
Oil, however, faced a challenging year despite geopolitical crises and production cuts. One of the reasons is a weak demand, particularly from China. In the United States, gasoline inventories exceeded long-term seasonal levels. According to analysts, the growing transition to electric vehicles in developed markets represents a long-term challenge for oil demand. Although some analysts anticipate a recovery in 2025 as OPEC+ production cuts take effect and geopolitical risks persist.
Stock Markets: Tech Leads the Charge
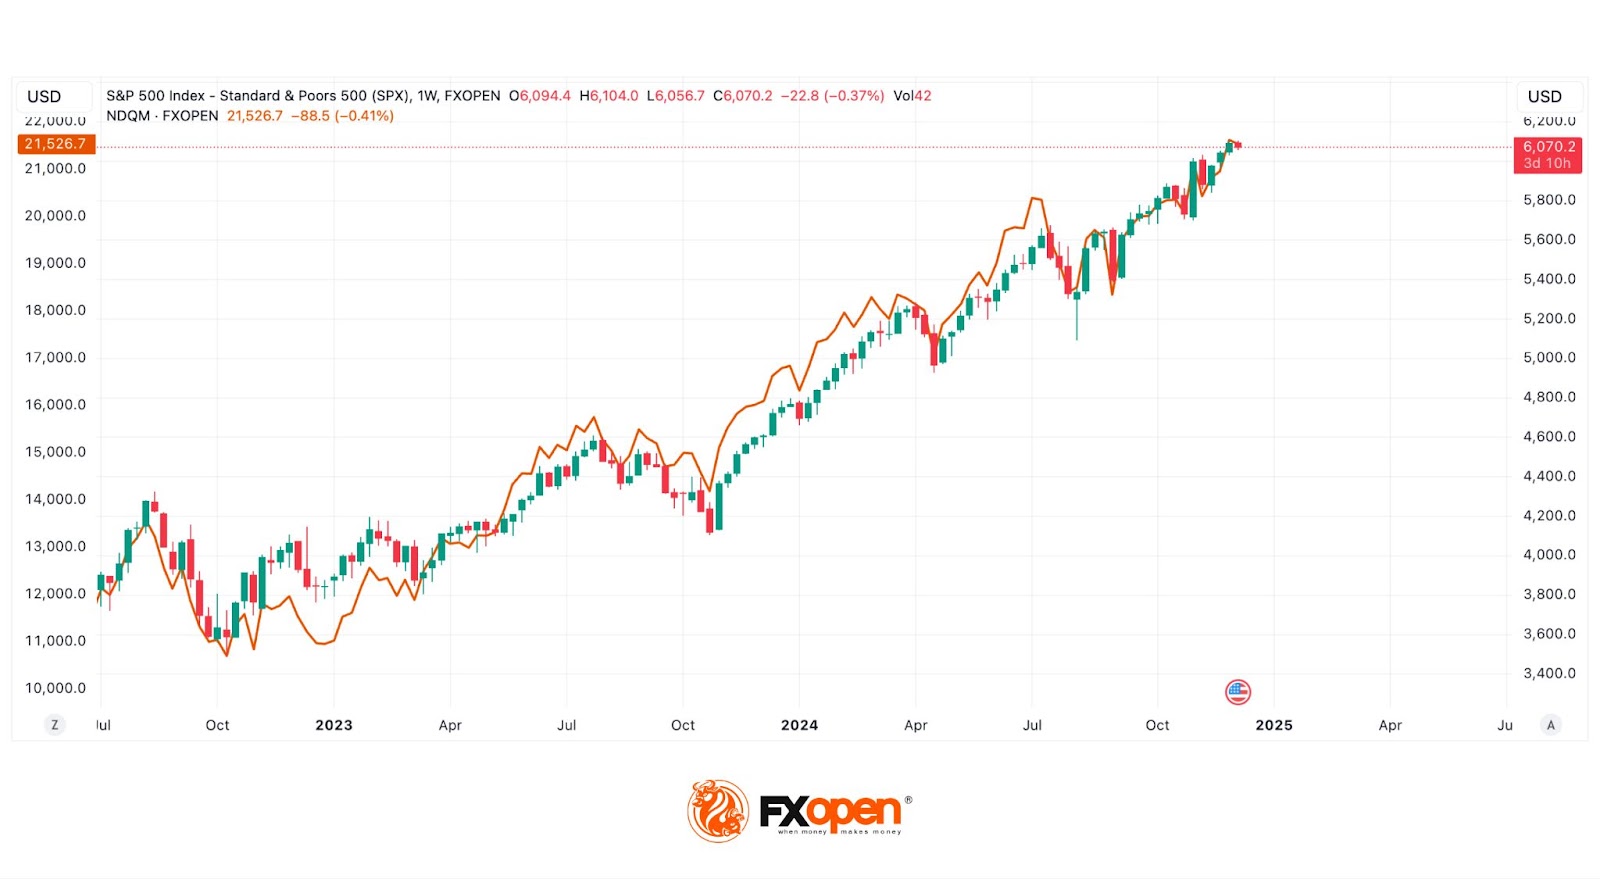
The US stock market delivered robust performances in 2024, reaching new record highs, with the technology sector at the forefront. Innovations in artificial intelligence (AI) played a pivotal role in driving growth, with major companies such as Microsoft, Nvidia, and Amazon reporting strong earnings. This momentum boosted broader indices, with the S&P 500 and Nasdaq 100 recording gains of 28.57% and 27.4%, respectively, as of 10th December.
The broader market also benefited from declining inflation, interest rate cuts, and better-than-expected corporate earnings. These factors may contribute to the stock market growth in 2025. However, stretched valuations temper some of the optimism, and concerns about potential trade tariffs add a layer of uncertainty.
Looking Ahead to 2025: Key Market Drivers
As we look ahead to 2025, several critical factors are poised to influence the direction of financial markets.
Central Bank Policies
Central banks will remain pivotal in shaping financial markets in 2025. The balance between maintaining growth and addressing inflationary pressures will be a key theme for central banks throughout the year, influencing the strength of equity markets. Interest rate differentials will play a significant role in determining currency movements.
Global Economic Recovery
The global economy is expected to continue rebounding from pandemic effects. GDP growth, employment trends, and trade balances will be key factors influencing financial markets.
Trade War Uncertainty
Potential trade tariffs pose a significant risk. The scope, products, and geographies targeted will determine the impact on global GDP, inflation, and interest rates. Any escalation in trade tensions could disrupt markets and strain economic recovery.
Artificial Intelligence and Innovation
AI and emerging technologies may drive productivity gains, offering an upside to global growth. By boosting efficiency and reducing costs, AI could also exert disinflationary pressure, influencing economic dynamics in the long term.
Geopolitical Tensions
Geopolitical risks, including trade disputes and political conflicts, remain unpredictable but could disrupt markets.
Final Thoughts: Embracing Opportunities Amid Volatility
The year 2024 brought its share of challenges and opportunities, showcasing the resilience and adaptability of global markets. From navigating geopolitical uncertainties and evolving monetary policies to embracing the transformative potential of technologies like artificial intelligence, market participants faced a dynamic landscape.
Looking ahead to 2025, the horizon offers new opportunities. Continued advancements in innovation, shifts in economic policies, and the resolution of key global tensions could set the stage for exciting market fluctuations. Use the new year to test your skills and look for new opportunities!
Trade over 50 forex markets 24 hours a day with FXOpen. Take advantage of low commissions, deep liquidity, and spreads from 0.0 pips. Open your FXOpen account now or learn more about trading forex with FXOpen.
This article represents the opinion of the Companies operating under the FXOpen brand only. It is not to be construed as an offer, solicitation, or recommendation with respect to products and services provided by the Companies operating under the FXOpen brand, nor is it to be considered financial advice.
Sunset Market Commentary
Markets
Slightly better-than-expected December EMU PMI’s showed business activity decreasing for the second month running. The rate of contraction was slower than in November though (49.5 from 48.3). A modest return to growth of services (51.4 from 49.5) was unable to erase the continuing downturn in manufacturing (45.2; unchanged). As has now been the case for several months, the overall reduction in business activity was reflective of falls in Germany and France. Both remained in contraction during December while the rest of the EMU posted a solid increase in output at the end of the year (6-month high). Overall, economic output was scaled back amid sustained reductions in new orders. Meanwhile, the pace of job cuts was the fastest in four years as companies responded to a drop in workloads by lowering their staffing levels (mainly manufacturing, near stagnation in services). EMU manufacturers reduced their purchasing activity again, with the sharp decline in input buying the most pronounced of any month in 2024. Further marked declines in inventories of both purchases and finished goods were also registered. Optimism in the 12-month outlook for output strengthened, but only marginally and coming off low levels. Rates of inflation of both input costs and output prices quickened at the end of the year, with charges rising at a pace that remained above the series average. These developments back the ECB’s “safe” 25 bps rate cut last week. ECB President Lagarde today said that she expected to lower interest rates further. Interestingly, she believes that price momentum in the services sector has dropped steeply recently. An ECB tracker sees wage growth slowing to about 3% next year, a level the central bank generally considers to be consistent with the 2% target. Recall that most recent (Q3) wage data showed EMU high wage inflation at 5.4% Y/Y. Risks to the inflation outlook became two-sided, but are clouded by a huge amount of (geo)political and economic uncertainty. EUR/USD reacted stoic to today’s European numbers with EUR/USD moving up and down the 1.05 handle. Friday night’s unexpected French credit rating downgrade by Moody’s (Aa3 from Aa2, stable outlook) didn’t pull the single currency down neither, even though French credit risk premia added a few bps and with the CAC40 underperforming (-0.90%) EMU stock markets. Core bonds try a modest rebound after last week’s weakness with German yields currently 3.7 bps (2-yr) to 1.5 bps (30-yr) lower. We witness some USD strength and Treasury weakness as we finish this report following December US PMI’s. US output growth ends 2024 on 33-month high (56.6 from 54.9) amid a service sector surge (58.5 from 56.1), but manufacturers report falling output (48.3 from 49.7) and higher prices.
News & Views
The Norges Bank (NB) announced that it will be buying Norwegian krone and sell foreign currency to fund the transfers of the NB to the government. The Norwegian government owns the NB and holds deposits in its government Treasury account. The profit from the NB and the interest rates on the government deposit account are transferred to the government annually. The NB decided to sell FX in the market to make the transfer of its dividends to the government. This way of working will avoid that the transfers increase the long term level of bank deposits in the Norges Bank. Previously the government issued debt to prevent the transfers to the government from increasing banks’ liquidities at the NB. However, the government now wants to halt this procedure of creating more debt. The NB will only publish its earnings and dividends for 2024 in February next year. Recent developments suggest that the transfer will amount to NOK 27bn. The sale of FX can be considered as FX interventions, but today the announcement had no (positive) impact on the krone. EUR/NOK even trades marginally higher in the 11.72 area.
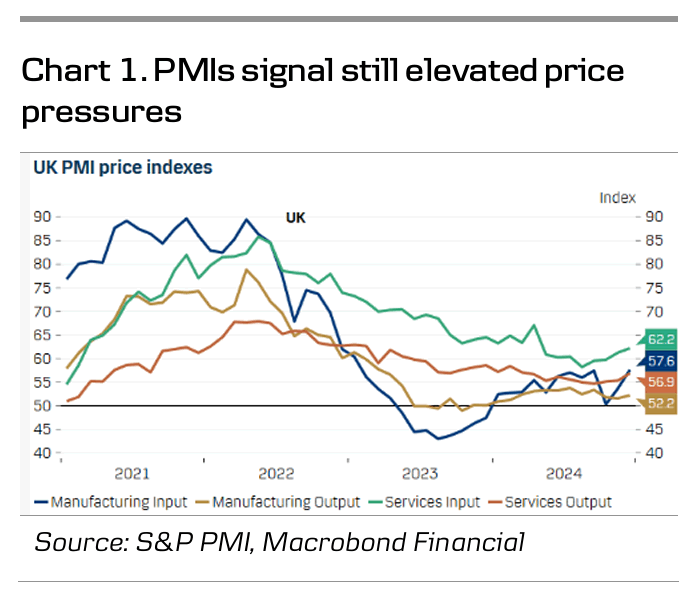
December UK PMI’s showed output increasing marginally (composite PMI 50.5 unchanged) as rising activity in the services sector (51.4 from 50.4) helped to offset an accelerated downturn in the manufacturing sector (45.7 from 48.3). S&P reported total new orders decreasing for the first time in 13 month on widespread reports of weaker business and consumer spending patterns. The combination of softer demand, rising employment costs and squeezed margins contributed to the further decline in headcounts, with the pace accelerating to the fastest pace in nearly four years. Rising salaries and elevated domestic inflationary pressures continue to push up input costs for business. S&P global concludes that “Businesses are reporting a triple whammy of gloomy news as 2024 comes to a close, with economic growth stalled, employment slumping and inflation back on the rise”.
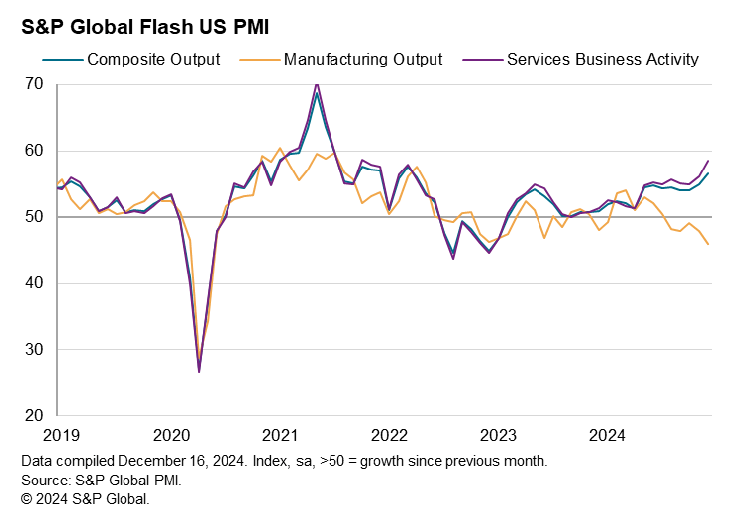
US PMI services surge to 38-mth high, upturn to persist into new year
The US economy ended 2024 on a strong note, propelled by robust activity in the services sector. December PMI Services index surged from 56.1 to 58.5, a 38-month high, highlighting the sector’s vital role in driving growth. This expansion lifted PMI Composite from 54.9 to 55.6, its highest level in 33 months, despite a continued contraction in the manufacturing sector, where PMI fell from 49.7 to 48.3.
According to Chris Williamson, Chief Business Economist at S&P Global Market Intelligence, "business is booming" in the services economy, which is experiencing its fastest growth since the post-COVID reopening in 2021. This momentum is consistent with GDP growing at an annualized rate of just over 3% in December.
Additionally, confidence in the 12-month outlook has reached a two-and-a-half-year high, suggesting that the current economic upturn could "persist into the new year" and broaden across more sectors.
However, challenges remain for the manufacturing sector, where optimism has been dampened by concerns over tariffs and their potential to increase costs.
December also saw sharp spikes in raw material prices, driven by supplier-led increases and higher shipping costs, reflecting busier supply chains ahead of anticipated protectionist measures in the new year. These inflationary pressures could present risks to the broader economy, even as services continue to underpin overall growth.
BoJ Rate Hike in Focus: USD/JPY, GBP/JPY Technical Analysis
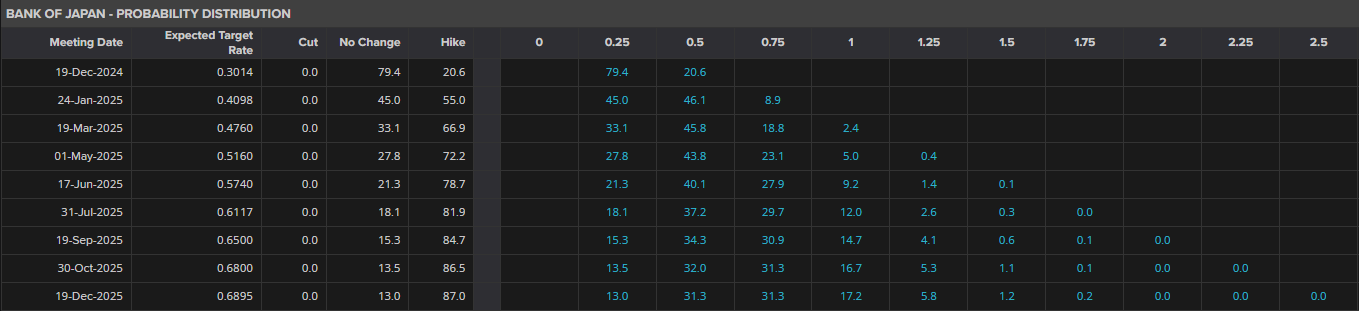
- Markets are pricing in a less than 20% chance of a BoJ rate hike this Thursday, despite earlier expectations of a 70% probability.
- JPY weakness has resumed as rate hike expectations have fallen, potentially pushing the BoJ to act.
- USD/JPY shows strong bullish momentum, but a BoJ hike could lead to a significant decline.
- A surprise rate hike by the BoJ could strengthen the JPY significantly, with more room for gains against the GBP than the USD.
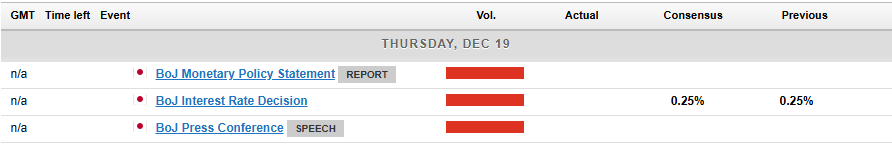
Bank of Japan: To hike or not?
The Bank of Japan (BoJ) is in the spotlight this week and looks to take center stage despite Central Bank meetings from the US and UK. The much anticipated normalization of policy from the BoJ may be upon us, hence all the interest in this week’s meeting.
The BoJ have for months been touting a more aggressive shift in policy. In 2024, the Bank of Japan have already made several changes to its monetary policy. Notably, in July, the BOJ increased its policy rate to around 0.25% while discontinuing its Quantitative and Qualitative Monetary Easing with Yield Curve Control policy framework.
Two weeks ago markets were pricing around a 70% probability of a 25bps hike by the BoJ. At the time I did think this was strange given the notoriously indecisive nature of the Central Bank. However, over the past two weeks, many reports have surfaced, leading the market to believe there’s less than a 20% chance the Bank of Japan will raise rates by 0.25% this Thursday.
Source: LSEG (click to enlarge).
The BoJ do have a tendency to spring a surprise when one least expects it. One of the key issues over the past few months for the BoJ has been JPY weakness which has resumed over the past two weeks as market expectations for a rate hike were peeled back.
Given USD/JPY is now approaching the psychological 155.00 handle, will the BoJ act? I stand by my take that we are likely to see a BoJ hold now and a potential rate hike in the new year. However a surprise cannot be ruled out and that is precisely what makes this week’s meeting all the more exciting.
There is of course the US Federal Reserve and Bank of England meetings as well which could stoke volatility and impact USD/JPY and GBP/JPY. The consensus for these two meetings are a 25 bps cut from the Fed and a hold of rates by Bank of England.
If the BoJ do surprise and raise rate by 25 bps the Yen could strengthen significantly with more room for gains against the GBP than the US Dollar in my opinion. The reason lies with US Dollar strength which is likely to continue into early 2025 at least. US Treasury yields are expected to rise in 2025 as well which further supports the narrative and why GBP/JPY could see more downside on a BoJ hike.
Technical Analysis
USD/JPY
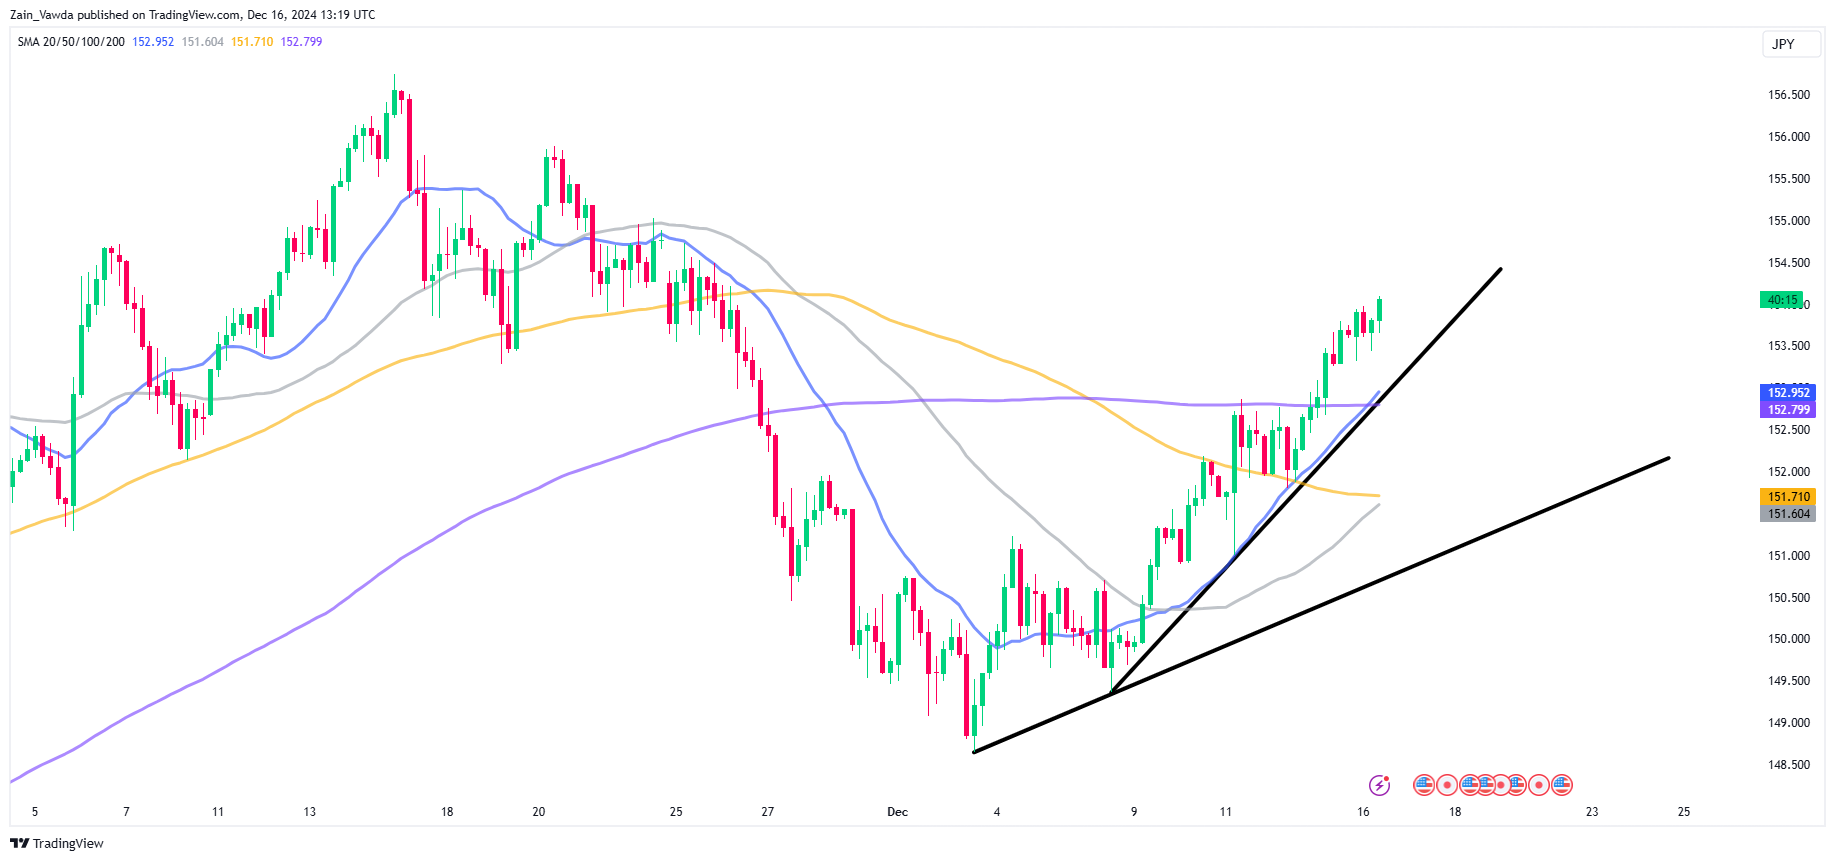
From a technical perspective, USD/JPY has been on a strong move to the upside since bottoming out on December 3, around the 148.600 handle.
The move to the upside has been swift and momentum was gained following a break of the descending trendline. As things stand, Bulls appear to be firmly in control heading toward the FOMC and BoJ meetings on Wednesday and Thursday respectively.
The 50-day MA is currently gearing up for a cross of the 100-day MA in what could be seen as a golden cross pattern hinting at further upside. Despite being a lagging indicator, this does demonstrate the bullish momentum that has built in USD/JPY over the month of December.
Historically the BoJ have relied on rhetoric at times to keep the exchange rate intact, but that ship has long sailed. One wonders if the central bank was trying to use a similar tactic heading into this BoJ meeting.
Looking at the chart below we have the inner and outer ascending trendlines which could come into play this week and present opportunity.
A hike by the BoJ could send USD/JPY tumbling toward the outer trendline and push toward 150.00 and beyond. Immediate support rests at 153.500 before the 151.80 and 150.00 handles come into focus.
Immediate resistance rests at the 155.00 handle with a break above this level, eyeing the swing high at 156.500.
USD/JPY Daily Chart, December 16, 2024
Source: TradingView (click to enlarge)
Support
- 153.50
- 151.80
- 150.00 (psychological level)
Resistance
- 155.00
- 156.500
- 157.74
GBP/JPY
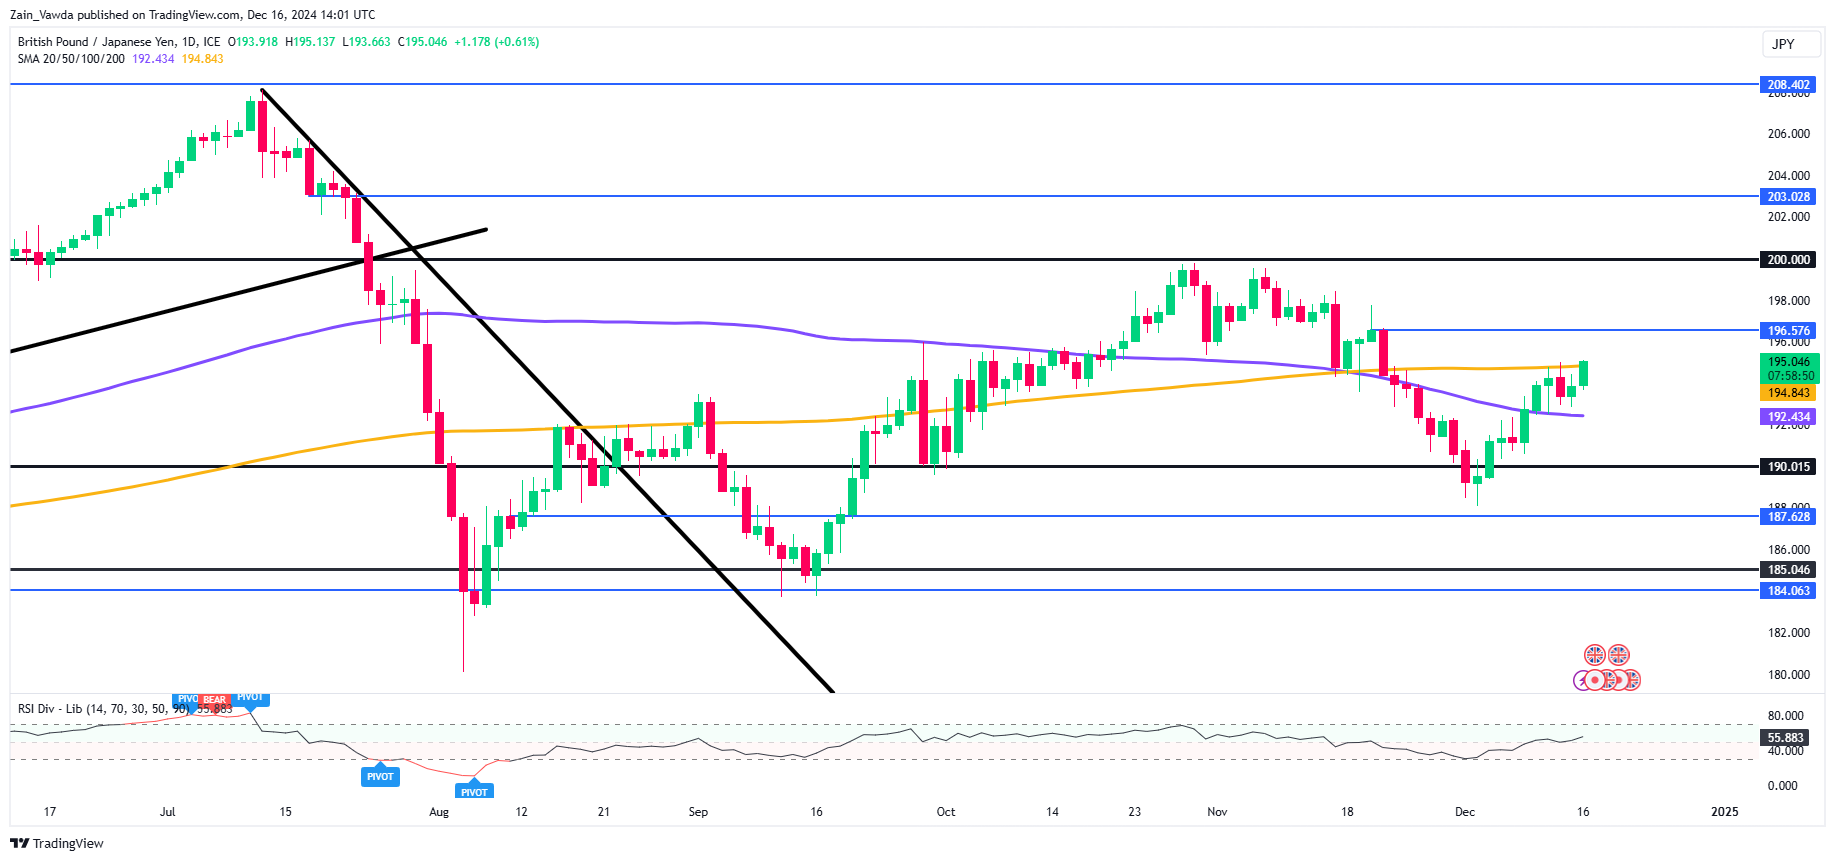
GBP/JPY continues to toil below the coveted 200.00 handle. Having breached the 200.00 hurdle, GBP/JPY has failed to find acceptance above this level since breaking below the 200.00 mark in August.
As things stand for GBP/JPY the bears remain in control for now with a break and daily candle close above the swing high at 196.57 needed for a change in structure to occur which could lead to increased bullish momentum.
Another sign of bullish momentum is presented by the RSI and the rejection of the 50 level which is now serving as a support of sorts.
GBP/JPY is flirting with a break above the 200-day MA which could embolden bulls and push for a break of the swing high at 196.57. A break of this level will bring focus toward the 198.00 handle before the psychological 200.00 mark comes into focus.
Alternatively, a move lower from here faces support at the 100-day MA which rests at 192.43 before the 190.00 handle comes back into focus.
GBP/JPY Daily Chart, December 16, 2024
Source: TradingView (click to enlarge)
Support
- 192.43
- 190.00
- 187.62
Resistance
- 196.57
- 198.00
- 200.00
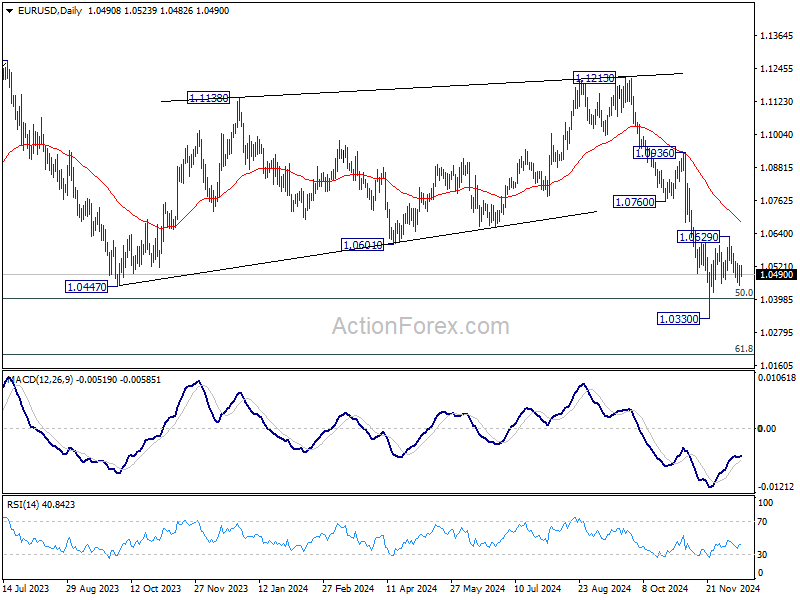
EUR/USD Mid-Day Outlook
Daily Pivots: (S1) 1.0463; (P) 1.0493; (R1) 1.0534; More...
Range trading continues in EUR/USD and intraday bias stays neutral first. Corrective pattern from 1.0330 might extend further. But outlook will stay bearish as long as 55 D EMA (now at 1.0678) holds. On the downside, below 1.0452 will bring retest of 1.0330 low.
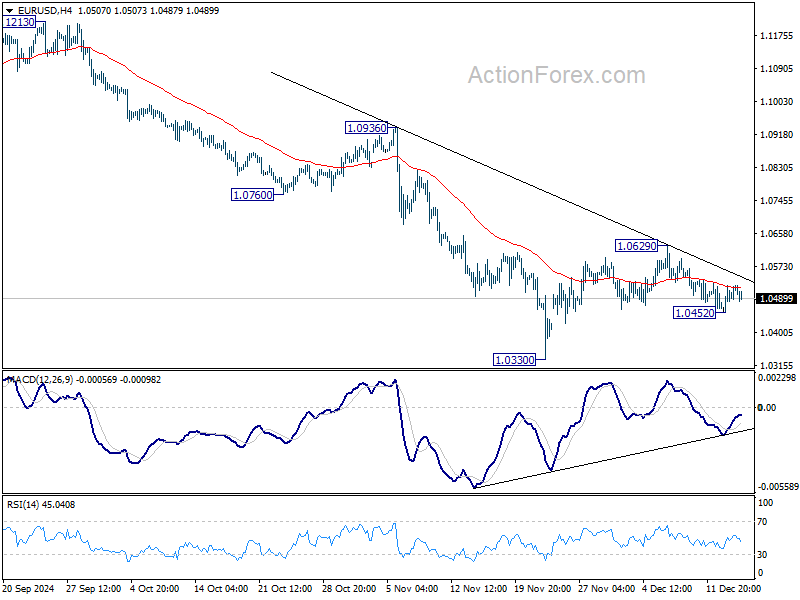
In the bigger picture, focus stays on 50% retracement of 0.9534 (2022 low) to 1.1274 at 1.0404. Strong rebound from this level will keep price actions from 1.1273 (2023 high) as a medium term consolidation pattern only. However, sustained break of 1.0404 will raise the chance that whole up trend from 0.9534 has reversed. That would pave the way to 61.8% retracement at 1.0199 first. Firm break there will target 0.9534 low again.
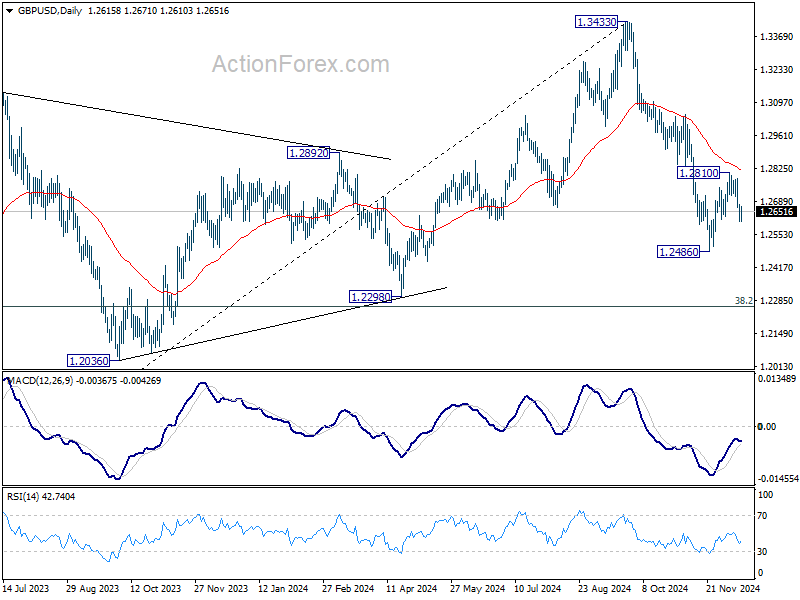
GBP/USD Mid-Day Outlook
Daily Pivots: (S1) 1.2592; (P) 1.2638; (R1) 1.2668; More...
No change in GBP/USD's outlook and intraday bias remains neutral first. As noted before, corrective recovery from 1.2486 might have completed at 1.2810 already. Break of 1.2615 will resume the fall from 1.3433 through 1.2486 to 1.2298 cluster support zone.
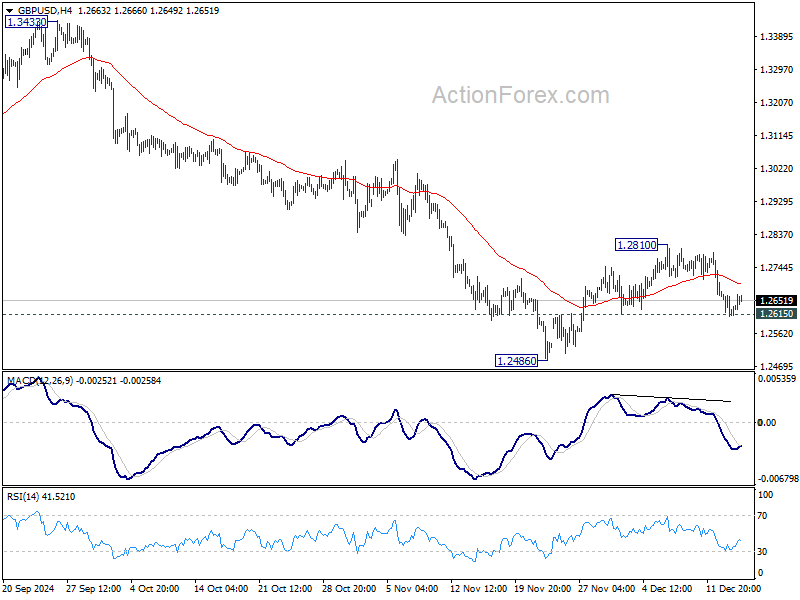
In the bigger picture, price actions from 1.3433 medium term are seen as correcting whole up trend from 1.0351 (2022 low). Deeper decline could be seen to 38.2% retracement of 1.0351 to 1.3433 at 1.2256, which is close to 1.2298 structural support. But strong support is expected there to bring rebound to extend the corrective pattern.