Sample Category Title
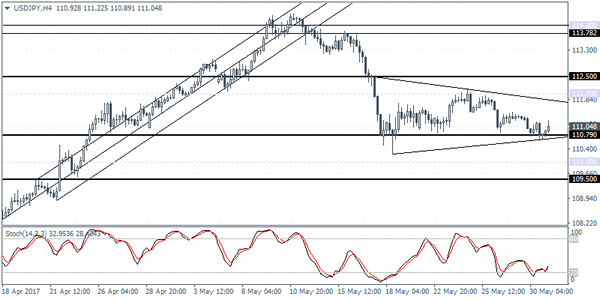
Technical Outlook: USDJPY – Key Supports At 110.50/23 Remain In Near-Term Focus
The pair remains at the back foot in early Wednesday's trading and returned below 111.00 handle after recovery attempts stalled at 111.22.
Tuesday's long red daily candle weighs on market, along with political uncertainty that prompted investors into safe haven assets.
Bearish setup of daily studies keeps the downside at risk, with focus on 110.50 (Fibo 61.8% of 108.11/114.36 rally) and key support at 110.23 (18 May low, reinforced by rising 200SMA.
Close below 110.50 is needed for bearish signal, while break below 110.23 would open another pivotal support at 110.00 (psychological support/daily cloud base).
Solid resistance at 111.34 (converged 10/55SMA's) should cap upside attempts and keep intact upper pivots at 111.80 (daily cloud top) and 112.12 (24 May recovery rejection).
Res: 111.34; 111.46; 111.80; 112.12
Sup: 110.66; 110.50; 110.23; 110.00
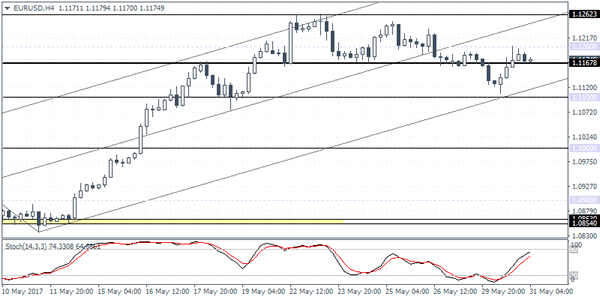
Technical Outlook: EURUSD Is Holding Positive Sentiment On Policy Change Speculation But So Far Unable To Clear 1.1200 Pivot
The Euro holds bullish near-term sentiment that was sparked by speculations about early change of the policy on Wednesday.
The pair rallies in early European trading after overnight's dips were contained above strong support at 1.1160 zone and is attacking 1.1200 barrier again.
Wednesday's long-tailed bullish daily candle is seen as bullish signal and break above daily Tenkan-sen (1.1182) and 10SMA (1.1187) will bring daily studies in full bullish setup.
Close above strong barrier at 1.1190/1.1207 zone (4-hr cloud top/Fibo 61.8% of 1.1268/1.1109 pullback/Wednesday's high) is needed to confirm reversal and open way for possible full retracement of 1.1268/1.1109 downleg.
Initial support lies at 1.1160, followed by strong support at 1.1109/04 (Wednesday's low/Fibo 38.2% of 1.0839/1.1268 upleg).
Today's release of EU inflation and unemployment data will be closely watched for further signals.
Res: 1.1207; 1.1234; 1.1250; 1.1268
Sup: 1.1 172; 1.1160; 1.1145; 1.1109
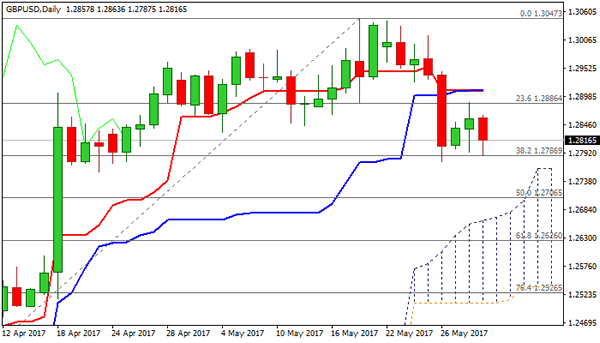
Technical Outlook: GBPUSD – Politics Remain Key Driver For Sterling
Cable was down in Asia and returned below 1.2800 handle on fall from session high at 1.2863. Sterling came under fresh pressure after release of results of the latest poll which showed that position of Conservative Party against its main rival, Labour party is weakening, just one week ahead of June 8 vote.
The pair dipped close to 26 May 1.2775 one-month low which offers solid support, reinforced by Fibo 38.2% of 1.2365/1.3047 rally.
Weak studies on lower timeframes see risk of further weakness after overnight’s recovery attempts were capped by hourly cloud and completion of asymmetric H&S pattern on hourly chart would generate stronger bearish signal.
Firm break below 1.2775 pivot would risk bearish acceleration towards 1.2706 (50% retracement and 1.2670 (top of rising daily cloud).
Bear-crosses 10/20SMA’s / daily Tenkan-sen/Kijun-sen) are forming on daily chart and signal increasing downside pressure.
Session high at 1.2863 marks initial resistance, followed by Tuesday’s high at 1.2887, which is expected to cap extended recovery attempts.
Res: 1.2820, 1.2831, 1.2863, 1.2887
Sup: 1.2787, 1.2775, 1.2755, 1.2706
ECB Policy Tightening Speculation Lifts EURUSD
The US dollar was mixed yesterday as the PCE data showed a 0.2% increase on the core or 1.5% on a year over year basis. This was below the Fed's 2.0% inflation target rate. However, personal income and spending both managed to post some modest gains, rising 0.4% on both as forecast.
The euro spiked higher back to $1.1200 before giving up the gains. The rally came on speculation that the ECB could remove the easing bias when it meets in June with the possibility of announcing further tapering as early as September. The euro, however, gave up the gains towards the close.
The monetary policy makers in the US, however, were slightly dovish with Lael Brainard saying that the soft inflation could lead her to reassess the path for monetary policy.
Looking ahead, the Eurozone's flash inflation estimates for May will be released today with expectations showing a modest decline following an increase in April. In Canada, the GDP numbers will be coming out for March with forecasts showing a 0.3% increase on a month over month basis.
EURUSD intraday analysis
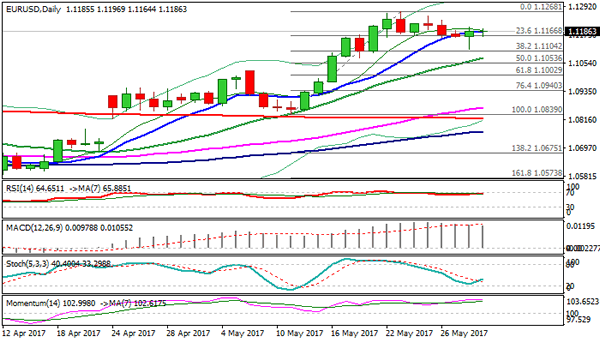
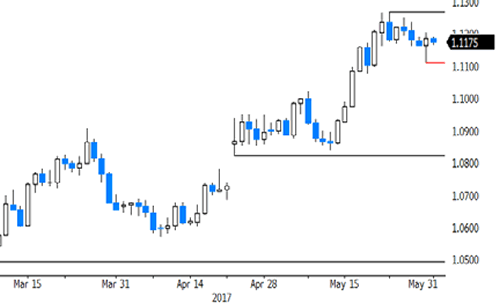
EURUSD (1.1174): The EURUSD remained a bit volatile as price slipped to a 7-day low at $1.1109 before pulling back higher to close at $1.1184. Price action is likely to remain range bound into this Friday's payrolls numbers.
On the 4-hour chart, support at 1.1167 is critical as a breakout above this level could signal a continuation to the upside which will see EURUSD test $1.1262, close to the recent highs that were posted previously. However, a downside break below 1.1167 could signal a continuation to $1.1100 where a test of support is yet to be established.
GBPUSD intraday analysis
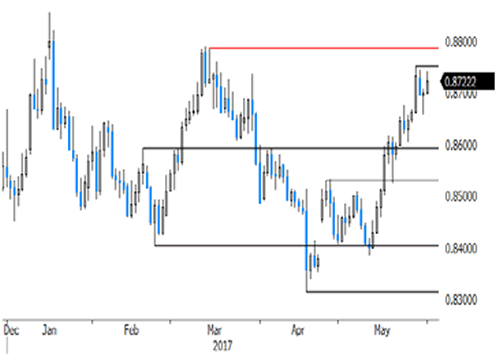
GBPUSD (1.2817): The British pound is seen consolidating near the $1.2800 support level with price action currently looking weaker and reversing yesterday's gains. However, the bias could remain to the upside in the near term.
Watch for a breakout above $1.2860 for further continuation towards $1.2900 and the possibility for theprice to test $1.3000 as well. Alternately, a break down below $1.12800 will signal a decline that will see price test $1.2600 support level. With the UK elections, just around the corner, the currency pair is likely to exhibit some volatility heading into the event
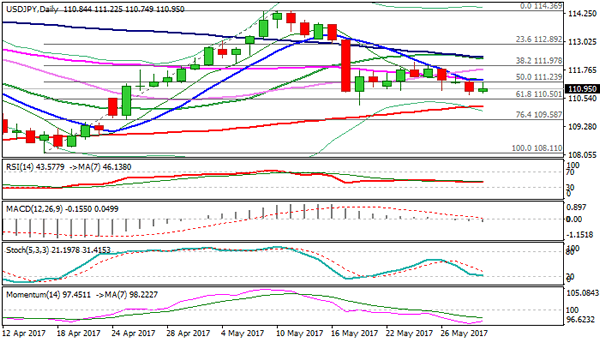
USDJPY intraday analysis
USDJPY (111.04): USDJPY is seen trading within 112.00 and 110.00 price levels since last week. The support level at 110.97 has been tested multiple times with price action consolidating into a triangle pattern.
A breakout to the upside could potentially signal a move towards 112.50 initially followed by a continuation in price towards 113.50. However, given the consolidation that has formed following the strong declines off 114.00, USDJPY could also slip towards 109.50 in the event of a break down below 110.79.
Currencies: Sterling Remains In The Defensive As Election Uncertainty Mounts
Sunrise Market Commentary
- Rates: Investors side-lined ahead of key US releases tomorrow and on Friday?
Today's market remains well-filled. We mainly focus EMU inflation. Risks, if any, are on the downside of consensus, but markets should be prepared after the slightly larger setbacks in German and Spanish inflation yesterday. We hold a rather neutral view with investors probably side-lined ahead of key US eco releases tomorrow and on Friday. - Currencies: Sterling remains in the defensive as election uncertainty mounts
The dollar and the euro are captured in some kind of balance of mutual softness. A soft EMU inflation figure might be slightly negative for the euro, but probably won't change the broader picture. Sterling might remain under pressure as opinion polls indicate that it isn't 100% sure that PM May's conservative party will secure a majority in the June election
The Sunrise Headlines
- US stock markets ended up to 0.25% lower. Main indices flat-lined after a softer opening. Overnight, most Asian bourses eke out small gains with Japan underperforming.
- Federal Reserve Governor Brainard said soft inflation could cause her to reassess the path forward for monetary policy should it linger, even as the global economic outlook brightens and US growth looks poised to rebound.
- Growth in activity at China's manufacturers was unchanged in May, with the official PMI remaining at the lowest level since September (51.2), but defying expectations of a drop. The non-manufacturing PMI rose from 54 to 54.5.
- British PM May's Conservative Party risks falling short of winning an overall majority of seats in parliament in a national election on June 8, The Times newspaper said, quoting research by polling firm YouGov.
- The Reserve Bank of New Zealand said risks at home and abroad to the country's financial system had receded in recent months, but it remained wary of any rise in house prices or global protectionism.
- The Pentagon conducted a successful test of a system designed to shoot down an intercontinental ballistic missile, US defence officials said, a demonstration that came amid rising tensions over North Korea's nuclear weapons program.
- Today's eco calendar heats up containing EMU CPI, EMU unemployment rate, Chicago PMI and US pending home sales. ECB governors Coeure, Visco, Lautenschlaeger and Fed Kaplan speak. The Fed releases its Beige Book.
Currencies: Sterling Remains In The Defensive As Election Uncertainty Mounts
Euro and dollar feel mutual softness
Different themes guided trading in the major FX cross rate yesterday. Eeuro weakness prevailed early in the session as markets pondered whether EMU political risk (Italy/Greece) would again become an issue for trading. However, the euro found its composure even as EMU data were slightly softer than expected. US data were also mixed to slightly softer than expected, putting the dollar again in the defensive later in US dealings. EUR/USD closed the session at 1.1186. USD/JPY even finished the day below the 111 mark (110.85).
Overnight, Asian markets show again a diffuse picture. Chinese equities opened strong as investors return after holidays. Early gains were supported by better than expected China PMI's, but the gains are evaporating. Japan underperforms. USD/JPY is holds in the 111 area. End of month USD buying from US importers is said to prevent a further decline, for now. EUR/USD drifts south in tight 1.1190/65 range.
The eco calendar is again well filled today. The EMU headline CPI is expected to decline from 1.9% Y/Y to 1.5% Y/Y in May. The core measure is expected to soften to 1.0%. The EMU unemployment rate is expected to decline further from 9.5% to 9.4. In the US, the volatile Chicago PMI (expected 57.0 from 58.3) and the pending home sales will be published.
Over the previous days, the dollar and the euro were captured by a balance of mutual weakens. US eco data couldn't convince. Fed speakers confirmed the case for a June rate hike, but further rate hikes might be delayed if inflation eases further. On the EMU side of the story, the ECB also maintains a soft tone. The ECB's case is supported by soft EMU inflation data. EMU political event risk lingers in the background. We don't expect today's data to be a game-changer for EUR/USD trading. If anything, a below consensus EMU CPI might be slightly negative for the euro. For now, corrections on the equity markets remain modest, but if sentiment turns risk-off, we think that it will also be a slightly euro negative (via EUR/JPY). In a daily perspective, we assume that the 1.1205/1.1268 area will be tough resistance for the euro
Of late, the dollar traded soft. US data were a bit disappointing, markets turned more cautious on Trump's pro-growth agenda and US yields declined, keeping the dollar in the defensive. At the same time, the euro profited of reduced political risk on the region.
Last week, there were tentative signs that the dollar decline could slow. Is enough USD softness discounted? This week's payrolls and manufacturing ISM might be important in this assessment. At the same time the euro positive momentum is also fading.
Technical picture
The USD/JPY rebound ran into resistance early May. A mini-sell-off pushed the pair back below the 112.20 previous top and made the short-term picture negative. Return action lower in the 108.13/114.37 range is possible.
Earlier this month, it looked that EUR/USD could revisit 1.0821/1.0778 support (gap). However, poor US data and political upheaval finally propelled EUR/USD north of the 1.1023 range top. The pair reached a short-term correction top at 1.1268. The correction top at 1.1300/1.1366 is next resistance. USD sentiment will have to be extremely negative to clear this hurdle short-term. Further ST EUR/USD gains might become tough. A return below 1.1023 would indicate that the upside momentum has eased.
EUR/USD: markets await key US eco data later this week
EUR/GBP
Growing uncertainty on a May victory weighs on sterling
Sterling selling eased (temporary) yesterday morning, digesting recent substantial losses after opinion polls indicated that that the lead of the conservative party in parliamentary election could be much smaller than assumed of late. EUR/GBP dropped to the 0.8655 area. Cable touched an intraday top in the 1.2885/90 area. However, sterling momentum dwindled again during the US trading session as political uncertainty lingered. There were no important eco data in the UK yesterday. EUR/GBP closed the session at 0.8699. Cable finished the day at 1.2859.
Overnight, a YouGov poll suggested that the conservative party is at risk to lose its majority in Parliament. Cable dropped to the 1.28 area. EUR/GBP rebounded well north of 0.87. GFK consumer confidence unexpectedly improved from -7 to -5, but this hardly helped sterling. Later today, the UK money Supply and lending data will be published, but they will be of second tier importance for sterling trading. The focus will remain on politics. The YouGov poll has a big margin of error, but won't go unnoticed on European/UK markets this morning. Yesterday, it looked that the EUR/GBP rally was ripe for a pause as selling pressure on sterling eased and as the euro was in the defensive. One day later, fortunes have changed again. A retest of the 0.8750 correction top might be on the cards, especially if uncertainty on the outcome of the June 8 election grows further. There is no reason to row against the sterling negative tide. Next resistance comes is 0.8788
EUR/GBP nears recent highs as election uncertainty grows
AUD/USD Daily Outlook
Daily Pivots: (S1) 0.7430; (P) 0.7450; (R1) 0.7483; More...
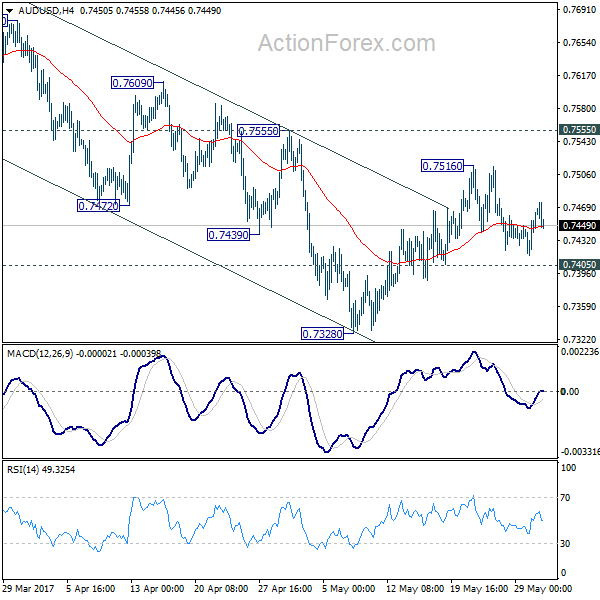
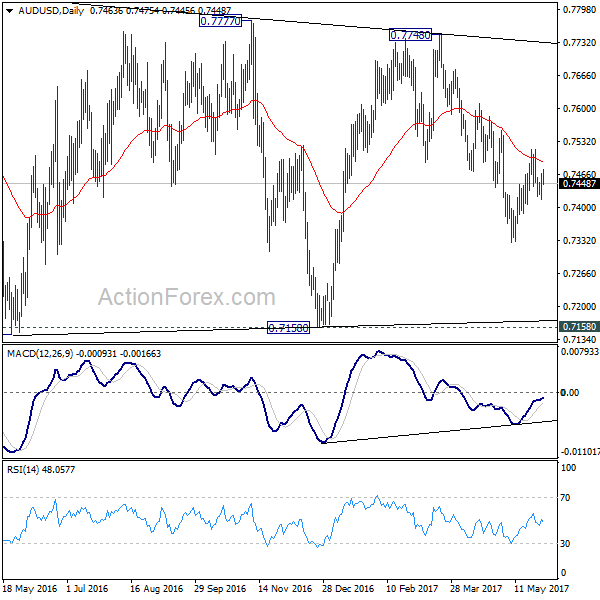
AUD/USD is staying in tight range between 0.7405/7516 and intraday bias remains neutral first. Again, as long as 0.7555 resistance holds, fall from 0.7748 is still expected to continue. Below 0.7405 minor support will turn bias to the downside for 0.7382. Break there will target 0.7144/7158 support zone. However, firm break of 0.7555 will argue that fall from 0.7748 is completed and turn bias back to the upside.
In the bigger picture, we're still treating price actions from 0.6826 low as a corrective pattern. And, as long as 38.2% retracement of 0.9504 to 0.6826 at 0.7849 holds, long term down trend from 1.1079 is expected to resume sooner or later. Break of 0.6826 low will target 0.6008 key support level. However, firm break of 0.7849 will indicate that rise from 0.6826 is developing into a medium term rebound, rather than a sideway pattern. In such case, stronger rise should be seen to 55 month EMA (now at 0.8115) and above.
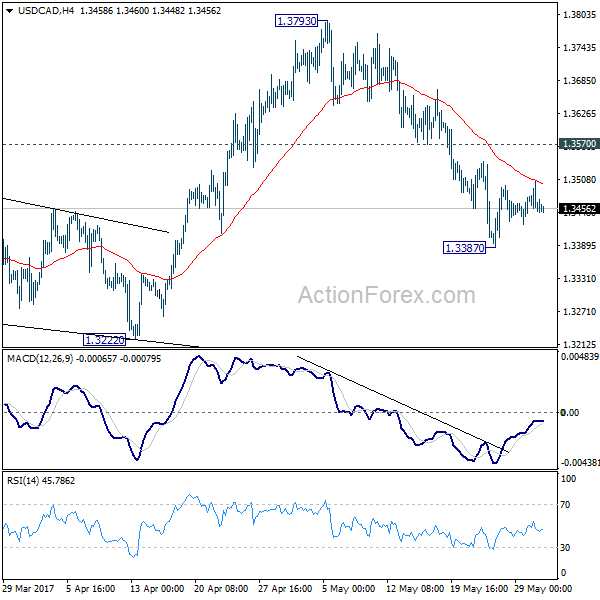
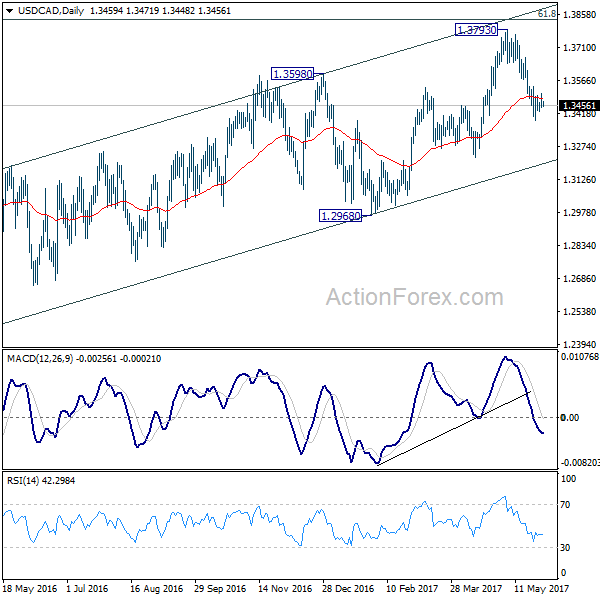
USD/CAD Daily Outlook
Daily Pivots: (S1) 1.3435; (P) 1.3471; (R1) 1.3494; More....
USD/CAD is staying in consolidation above 1.3387 temporary low and intraday bias remains neutral first. Upside of recovery should be limited by 1.3570 resistance and bring fall resumption. At this point, we're still favoring the case that rise from 1.2968 has completed. And the larger rise from 1.2460 could have finished too. Below 1.3387 will target 1.3222 support first. Break of 1.3222 will affirm our bearish view and target 1.2968 key support level for confirmation. However, break of 1.3570 will turn focus back to 1.3793 high instead.
In the bigger picture, price actions from 1.4689 medium term top are seen as a correction pattern. The first leg has completed at 1.2460. Rise from 1.2460 is seen as the second leg and could have completed at 1.3793, ahead of 61.8% retracement of 1.4689 to 1.2460 at 1.3838. Break of 1.3222 should indicate the start of the third leg while further break of 1.2968 should confirm. Nonetheless, sustained trading above 1.3838 would pave the way to retest 1.4689 high.
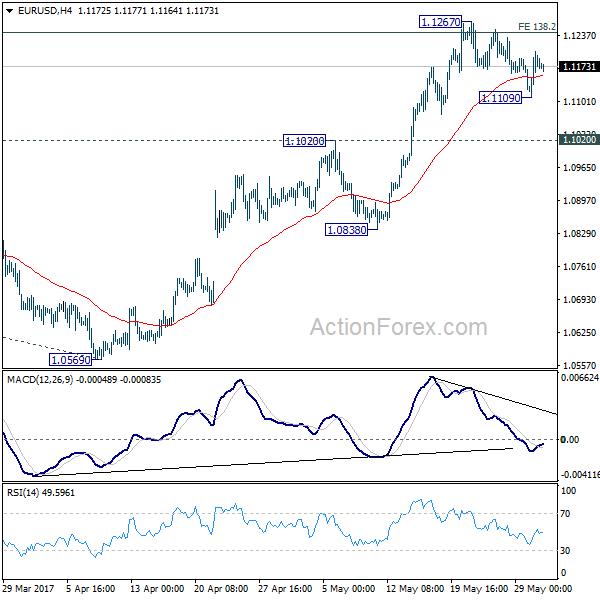
EUR/USD Daily Outlook
Daily Pivots: (S1) 1.1127; (P) 1.1166 (R1) 1.1223; More....
Intraday bias in EUR/USD remains neutral for the moment as consolidation from 1.1267 continues. Overall, we remain cautious on strong resistance from 1.1245/98 (138.2% projection of 1.0339 to 1.0828 from 1.0569 at 1.1245) to limit upside and bring reversal. But another rise is still mildly in favor as long as 1.1020 resistance turned support holds. Decisive break of 1.1298 will carry larger bullish implication and target 1.1615 resistance next. On the downside, break of 1.1020 will indicate rejection from 1.1245/98 and turn bias to the downside for 1.0838 support.
In the bigger picture, the case for medium term reversal continues to build up with EUR/USD staying far above 55 week EMA (now at 1.0888). Also, bullish convergence condition is seen in weekly MACD. Focus will now be on 1.1298 key resistance. Rejection from there will maintain medium term bearishness and would extend the whole down trend from 1.6039 (2008 high). However, firm break of 1.1298 will indicate reversal. In such case, further rally would be seen back to 1.2042 support turned resistance next.

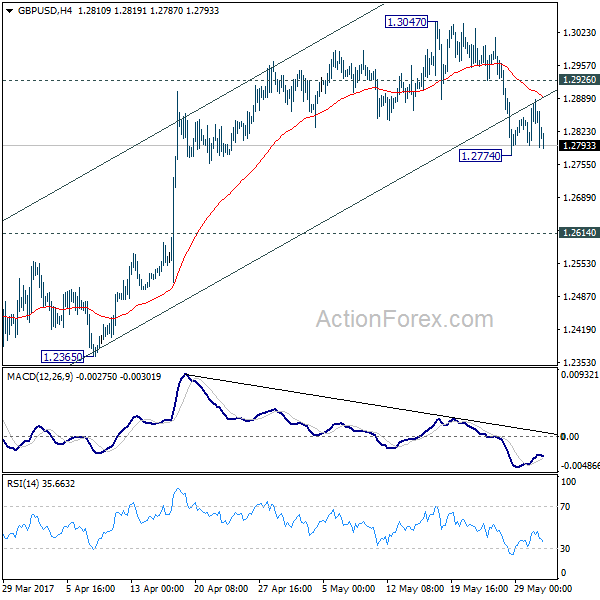
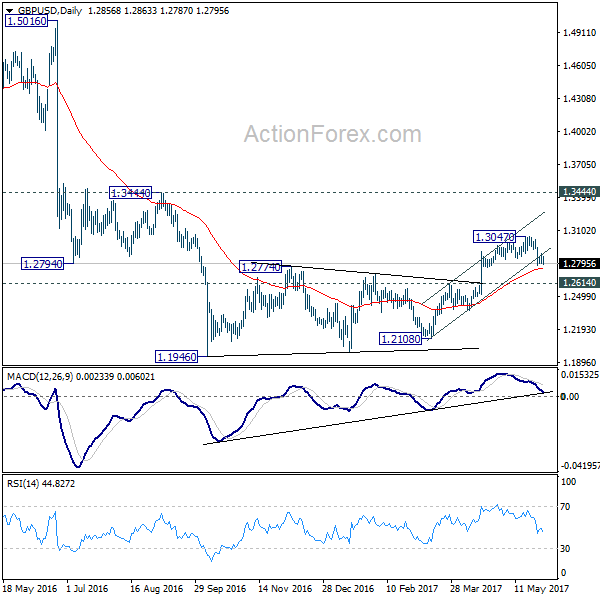
GBP/USD Daily Outlook
Daily Pivots: (S1) 1.2804; (P) 1.2846; (R1) 1.2898; More...
GBP/USD is staying in consolidation above 1.2774 temporary low and intraday bias remains neutral for the moment. We're holding on to view that rise from 1.2108 is completed. Hence, upside of current recovery should be limited by 1.2926 minor resistance and bring another decline. Below 1.2774 will target 1.2614 resistance turned support next. Break there should also indicate completion of whole consolidation pattern from 1.1946 and target a retest on this low. Meanwhile, above 1.2926 minor resistance will turn focus back to 1.3047 high instead.
In the bigger picture, fall from 1.7190 is seen as part of the down trend from 2.1161. The rejection from 55 week EMA is maintaining bearishness in the pair. Also, at this point, as long as 1.3444 resistance holds, fall from 1.7190 is still expected to continue. Break of above mentioned 1.2614 support will affirm this bearish case.
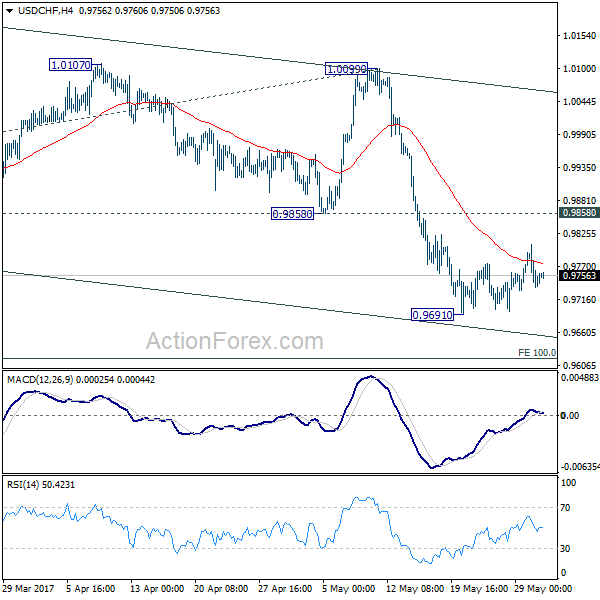
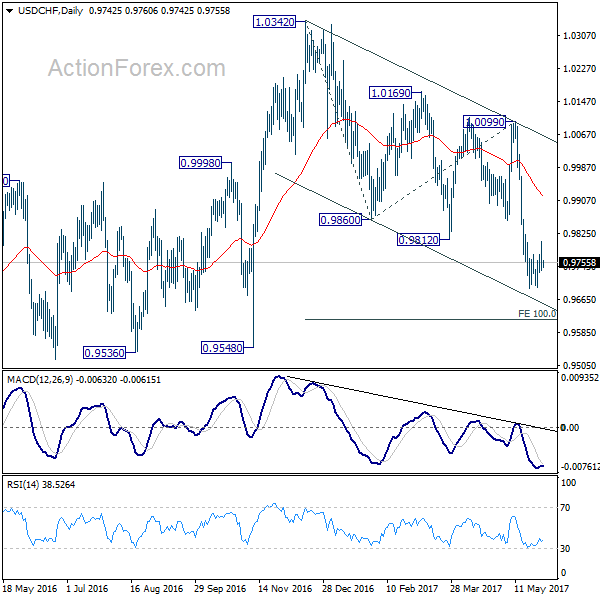
USD/CHF Daily Outlook
Daily Pivots: (S1) 0.9718; (P) 0.9763; (R1) 0.9789; More.....
No change in USD/CHF's outlook as the consolidation pattern from 0.9691 is still in progress. Intraday bias remains neutral first. In case of another rise, upside should be limited by 0.9858 support turned resistance and bring fall resumption. Whole decline from 1.0342 is still in progress and below 0.9691 will target 100% projection of 1.0342 to 0.9860 from 1.0099 at 0.9617. We'll start to look for reversal signal below there.
In the bigger picture, USD/CHF is bounded in medium term range of 0.9443/1.0342 for the moment. Consolidative trading would likely continue and medium term outlook remains neutral. Break of 1.0342 key resistance is needed to confirm underlying bullish momentum in the pair. Meanwhile, downside attempts should be contained by 0.9443 key support level.