
Sample Category Title
British Pound Weak as YouGov Model Suggests Hung Parliament after Election
Sterling weakens mildly as a new poll indicates that Prime Minister Theresa May's Conservative could fall short of an overall majority in the upcoming election on June 8. According to a new modelling by YouGov for the Times, it predicts that the Conservative would get 310 seat in the parliament, down from the prior 330 seat. On the other hand, Labour would get 257 seats, up from prior 229 seat. As the required majority is 326 seats, it now means that a hung parliament is a realistic possibility.
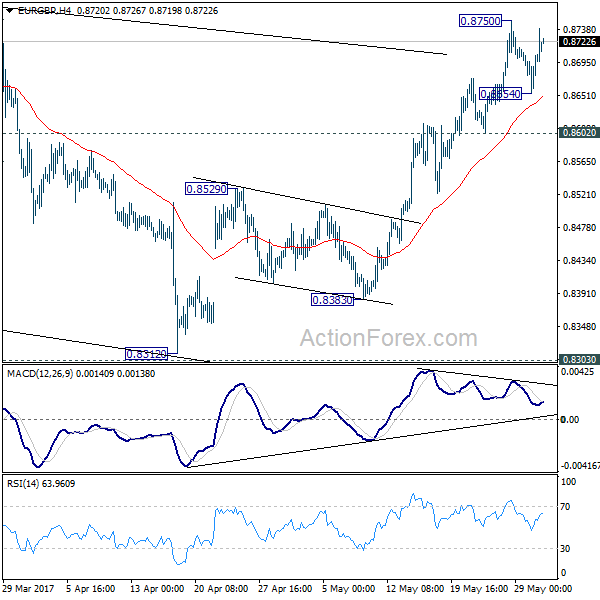
Technically, the British Pound is staying generally bearish. GBP/USD's near term trend is likely reversed after hitting 1.3047 earlier in the month. And deeper fall is expected to test on 1.2614 support as long as 1.2926 minor resistance holds. Near term outlook in EUR/GBP also stays bullish with 0.8602 support intact. Upside momentum in EUR/GBP could accelerate on firm break of 0.8786/8851 resistance zone. More decline is in favor in GBP/JPY with 143.35 minor resistance intact, but we'd be cautious on support from 140.35 fibonacci level.
Dollar rebound lacks momentum
In US, Fed Governor Lael Brainard suggested that she expected a further Fed rate hike soon, but cautioned that "if the soft inflation data persist, that would be concerning and, ultimately, could lead me to reassess the appropriate path of policy". Separately, Dallas Fed President Robert Kaplan indicated at an interview that CNBC that the economy would expand by about 2%. According to Kaplan, "two things drive GDP: growth in the labor force and growth in productivity... The problem is labor force growth is very sluggish... It's going to continue to be sluggish the next 10 years because the population is aging and labor force growth therefore is slowing".
Dollar index's recovery from 96.97 is clearly corrective looking. It's so far struggling to stay above 4 hour 55 EMA. It's also limited well below 38.2% retracement of 99.88 to 96.75 at 97.97. Hence, we'd expect recent decline to resume sooner or later. The near term bearishness in dollar index is in line with the cautiously bullish outlook in EUR/USD and the bearish outlook in USD/JPY.
China PMIs show stabilizing in the slowdown
In China, the National Bureau of Statistics PMI manufacturing, the official one, was unchanged at 51.2 in May. While that stayed at the lowest level in six months, it was above expectation of 51.0. Looking at the details, new orders was unchanged at 52.3, export orders rose 0.1 to 50.7. Production dropped to 53.4, down from 53.8. Employment rose to 49.4 from 49.2. Input price dropped to 49.5 from 51.8. Output prices dropped to 47.6 from 48.7. The official PMI services rose to 54.5, up from 54.0. Overall, the set of data at least showed no further deterioration in growth momentum. Nonetheless, the picture will still be closely monitored by economists in the coming months. The impact from Moody's downgrade of China's credit ratings for the first time in nearly 30 years is yet to be seen.
New Zealand businesses upbeat
New Zealand ANZ business confidence rose to 14.9 in May, up from 11.0. ANZ noted that "the economy's excellent adventure continues". And, "firms are upbeat, and prepared to hire and invest. That's an economic expansion that is still going full steam. Survey indicators are elevated but not stratospheric, consistent with the economy evolving into a mature stage of the expansion; we're growing nicely off a good base, as opposed to lifting rapidly off a low level."
Eurozone CPI to highlight the day
Elsewhere, Japan industrial production rose 4.0% mom in April. UK Gfk consumer confidence rose to -5 in May, BRC shop price dropped -0.4% yoy. Eurozone inflation will be a main focus in European session. Headline Eurozone CPI is expected to slow to 1.5% yoy in May while core CPI is expected to slow to 1.0% Yoy. Germany will release retail sales and unemployment. Swiss will release UBS consumption indicator. UK will release mortgage approvals and M4. Later in US session, Canada will release GDP. US will release Chicago PMI, pending home sales and Fed's Beige Book report.
EUR/GBP Daily Outlook
Daily Pivots: (S1) 0.8667; (P) 0.8686; (R1) 0.8717; More...
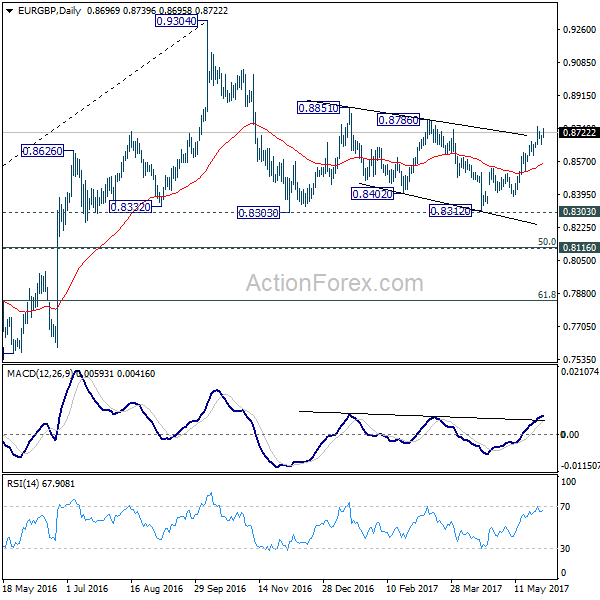
EUR/GBP recovers after dipping to 0.8654 but it's staying below 0.8750. Intraday bias remains neutral first and some more consolidations could be seen. But near term outlook will remain mildly bullish as long as 0.8602 support holds and further rally is expected. Above 0.8750 will target 0.8786 resistance first. Break of 0.8786 would pave the wave for retesting 0.9304 high. Break of 0.8602, however, will argue that the rebound from 0.9312 has completed and turn bias back to the downside for 0.8529 first.
In the bigger picture, price actions from 0.9304 are viewed as a medium term corrective pattern. The leg from 0.9304 should have completed after taking 0.8332 structural support. But it's too early to say that larger rise from 0.6935 is resuming. Rejection from 0.9304 will extend the consolidation with another falling leg. Meanwhile, firm break of 0.9304 will target 0.9799 (2008 high). In case of another decline, we'd expect strong support from 0.8116 cluster support (50% retracement of 0.6935 to 0.9304 at 0.8120) to contain downside and bring rebound.
Economic Indicators Update
| GMT | Ccy | Events | Actual | Forecast | Previous | Revised |
|---|---|---|---|---|---|---|
| 23:01 | GBP | GfK Consumer Confidence May | -5 | -8 | -7 | |
| 23:01 | GBP | BRC Shop Price Index Y/Y May | -0.40% | -0.30% | -0.50% | |
| 23:50 | JPY | Industrial Production M/M Apr P | 4.00% | 4.10% | -1.90% | |
| 1:00 | NZD | ANZ Business Confidence May | 14.9 | 11 | ||
| 1:00 | CNY | Manufacturing PMI May | 51.2 | 51 | 51.2 | |
| 1:00 | CNY | Non-manufacturing PMI May | 54.5 | 54 | ||
| 5:00 | JPY | Housing Starts Y/Y Apr | 1.9% | -1.50% | 0.20% | |
| 6:00 | EUR | German Retail Sales M/M Apr | 0.40% | 0.10% | ||
| 6:00 | CHF | UBS Consumption Indicator Apr | 1.5 | |||
| 7:55 | EUR | German Unemployment Change May | -14k | -15k | ||
| 7:55 | EUR | German Unemployment Rate May | 5.70% | 5.80% | ||
| 8:30 | GBP | Mortgage Approvals Apr | 66K | 67K | ||
| 8:30 | GBP | M4 Money Supply M/M Apr | 0.40% | 0.30% | ||
| 9:00 | EUR | Eurozone Unemployment Rate Apr | 9.40% | 9.50% | ||
| 9:00 | EUR | Eurozone CPI Estimate Y/Y May | 1.50% | 1.90% | ||
| 9:00 | EUR | Eurozone CPI - Core Y/Y May A | 1.00% | 1.20% | ||
| 12:30 | CAD | GDP M/M Mar | 0.30% | 0.00% | ||
| 13:45 | USD | Chicago PMI May | 57 | 58.3 | ||
| 14:00 | USD | Pending Home Sales M/M Apr | 0.60% | -0.80% | ||
| 18:00 | USD | Fed Beige Book |
APAC Commodities: Oil Refuses To Boil As Gold Melts Away
Overnight data fails to spark oil as Gold is starting to possibly look overextended in the short term.
Gold
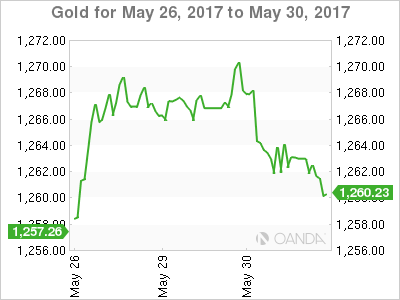
Gold's listless trading continued overnight with a more bearish tone in early Asia trading to start the day following its overnight failure to close above 1270 for the third day in a row. Holiday markets aside, the extended short term long positioning and a lack of upside momentum may be signalling that a correction lower may be on the cards. At least in the near term.
Gold traded up to 1270.50 overnight but then fell to finish 1262.80, down some -0.5 percent. Gold is presently 1261.40 in early Asia, just above rising trend line support at 1260 with a break targeting 1253 followed by the key 1245 region.
Resistance continues to be in the 1270/1272 area, which has contained gold for all of May. We will need to see a daily close above this level to signal more gold strength in the short term.
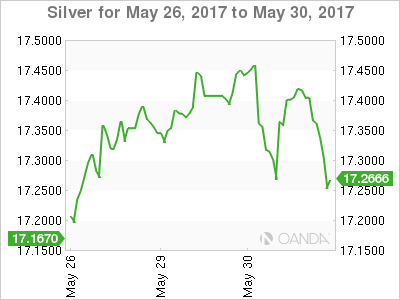
Silver
Silver looks a little ominous as well, failing at the 100-day moving average and yesterday's high at 17.4750. The 200-day moving average is just above here as well at 17.6000, meaning silver has some wood to chop at those levels.
In the bigger picture, the technicals show silver continuing to trade constructively but a break of near term support at 17.2000, yesterday's low, may have a few traders questioning this view. A break of the next support at 16.9000 could see more short-term long positioning retreating to the sidelines.
OIL
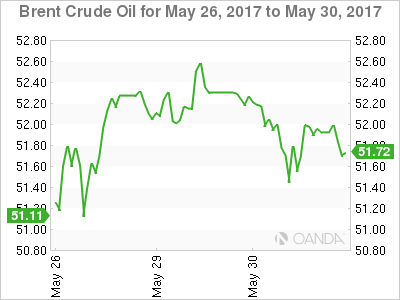
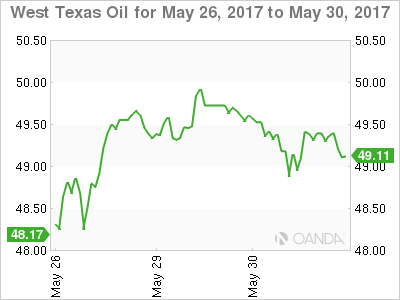
Oil prices weakened slightly overnight but overall, both contracts appear to be in a consolidation range. A lack of news and a listless dollar contributed to the becalmed nature of Brent and WTI with the street now looking ahead to tomorrow night's U.S. Crude Inventory Report. With an expected drawdown of minus 3 million barrels, the main risk will be a lower than expected drop which would see crude prices come under pressure again.
Brent spot opened at 52.00 this morning, unchanged from its New York close. Initial resistance is at 52.70 and 53.00 with support at 51.30 and 50.70.
WTI spot is also unchanged at 49.40 in early trading. Resistance is at 50.00 where it failed on Monday followed by 50.60 its 100-day moving average. Support is at 48.75 followed by the more important 48.85 region.
Elliott Wave View: GBP/JPY Downside Has Resumed
Short Term GBPJPY Elliott Wave view suggests the decline from 5/10 peak is unfolding as a double three Elliott Wave structure where Minor wave W ended at 143.33 and Minor wave X ended at 145.45. The subdivision of Minor wave W unfolded as a zigzag Elliott Wave structure where Minute wave ((a)) ended at 145.61, Minute wave ((b)) ended at 147.12, and Minute wave ((c)) of W ended at 143.33. After ending Minor wave X at 145.45, pair has since resumed lower and broken below 143.33. This creates a bearish 5 swing incomplete sequence from 5/10 peak and favors more downside in the near term.
GBPJPY Elliott Wave structure of the decline from 145.45 looks to be in a zigzag where Minute wave ((a)) ended at 142.11 and Minute wave ((b)) is proposed complete at 143.09 as a Flat Elliott Wave structure. Pair has broken below 141.81 irregular Minutte wave (b) which suggests that Minute wave ((c)) lower has already started. Near term, while bounces stay below 143.09 in the first degree, but more importantly below 5/25 high (145.45), expect pair to continue lower towards 139.51 – 140.65 area before cycle from 5/10 peak ends. Buyers should then appear from the aforementioned area for an extension higher or at least a 3 waves bounce. We do not like selling the proposed move to the downside.
GBPJPY Elliott Wave 1 Hour Chart
Market Morning Briefing: The Chances Of The Year-End Inflation Figure Coming Short
STOCKS
Dow (21029.47, -0.24%) dipped slightly yesterday but made an intra-day low at immediate support levels of 21009. If it holds today, we could see a bounce back towards 21100 and higher; else failure to bounce from current levels could open up lower levels of 20900-20800.
Dax (12598.68, -0.24%) is quite and could remain sideways within the narrow 12700-12485 region for the coming sessions (broad range of 12800-12400).
Shanghai (3129.22, +0.62%) is trying to rise eventually targeting levels near 3170 and higher for the near term. Immediate resistance is visible near 3195 from where a short dip is possible in the medium term. For now, Shanghai looks bullish.
The downside limit for Nikkei (19650.86, -0.14%) may be limited to 19450 in the near term whereas the upside seems to be open towards 20000. A test of 19450 is possible before we see a sharp bounce from there towards current levels.
Nifty (9624.55, +0.20%) is rallying upwards as expected and could move towards 9700-9800 as we have been mentioning in the past few editions.
COMMODITIES
Overall mostly all commodities look bearish for the near term and could move lower in the next few sessions.
Gold (1259.74) may fall in the near term as resistance near 1275-1280 seems to be holding well now. A fall towards 1240 or lower to 1220 could be possible in the coming sessions. Near term looks bearish.
Silver (17.23) is trading lower today and could come off towards 17.00 in the coming sessions. A bounce back from 17 could be expected thereafter.
Copper (2.57) has also come off from short term channel resistance near 2.62/65 and while that holds, Copper could come down towards 2.45/40 in the medium term.
Brent (51.61) is trading below immediate resistance near 52.65/70 and while that holds, a dip towards 50 is possible in the next 2-3 sessions before again bouncing back towards 53. On the other hand, WTI (49.30) may also re-test levels near 48.50 in the next few sessions. Near term looks bearish.
FOREX
The chances of the year-end inflation figure coming short of the Fed forecast have increased with the deceleration seen in the Fed's preferred price measure and weighs heavy on the Dollar Index (97.42). The higher resistance of 98.00 may stand firm now and a gradual decline towards the month low of 96.80 can be expected in the coming sessions.
Euro (1.1175) has tested and bounced back sharply from our support of 1.1100 just as expected and the journey for 1.1300 may have resumed.
There's no directional preference for Dollar Yen (111.15) in the near term as it keeps oscillating in the sideways range of 110-112 and any attempt to gauge any directional clue from these oscillations may turn out to be deceiving. Better to wait for a breakout.
The pre-election volatility continues for Pound (1.2826) and the possibility of the ruling Conservative party losing majority in the coming election keeps Pound soft but it has managed to hold above the major support of 1.2750-00 so far, keeping the upside chances of seeing 1.2900-1.3000 still open. Repeat - 1.2750-00 is the make or break support level for the near to medium term trend.
Aussie (0.7453) is another clueless currency which may continue its sideways consolidation in the range of 0.74-0.75 for another 2-3 days.
Dollar Rupee (64.66) tested the upper end of the near term range of 64.35-70 yesterday. The rest of the week may see the price contained in the same range with outside chances of testing the major resistance of 64.85 as the bias remains bullish as long as the support of 64.40-35 holds.
INTEREST RATES
The US yields are headed lower in the near term. The 10YR (2.22%), 30YR (2.89%) and the 5Yr (1.77%) are all down from 2.24%, 2.90% and 1.78% respectively and looks bearish on the near term charts. But note that there is an immediate support on the medium term charts which gives some hope of an immediate bounce back in the near term.
The German yields are trading low and looks bearish for the near term. The 10Yr (0.29%) and the 30Yr (1.14%) are down from previous levels of 0.31% and 1.16% respectively.
The German-US 10YR (-1.93%) and the German-US 2Yr (-2.04%) are trading just above support levels and while that holds, the yield spreads could move up in the near term along with the Euro.
The US-Japan 10Yr (2.18%) is also heading towards support just below current levels and while that holds, we could see a bounce back towards 2.2% or higher. But before that the yield spread and Dollar Yen could dip for a couple of sessions.
The 10Yr GOI (6.80%) has fallen from levels near 6.81% seen yesterday. We continue to look for levels near 6.75-6.70% in the medium term.
Why All The Risk?
Why all the Risk?
European risk steadied overnight after yesterday's very wobbly Asia session after Greek government spokesman Tzanakopoulos denied the German newspaper Bild report that Greece could forego next bailout payment. But for those of us that worked through the Greek debt saga, this has an all too familiar ring suggesting there's likely more drama to unfold.
The Merkle -Trump War of Words is catching dealers attention after President Trump called out Germany's massive trade deficit question their financial contribution to Nato.But this is typical Trump modus operandi and apparently not overly concerned about ruffling a few feathers when it comes to calling out Germany for its unfair trade advantage. And while it is disconcerting for investors to see these two go toe-to-toe., but let's face it, Trump is only stating what every trade economist and other German ally has known for years but were unable to negotiate more favourable terms of trade.
Add another event risk to the calendar as Former Italian PM Matteo Renzi on Sunday said he was for holding an election at the same time as Germany's in September. Anti-establishment parties are making the huge inroads in Italy potentially escalating risk for the Euro. The hyper-emotional Italian elections always take a tricky path and will be fraught with uncertainty down to the wire.
The UK election chances will likely see the GBP go through a bad case of Yo-Yo syndrome in the weeks ahead. Trading and speculating sentiment polls is always a dangerous game so fasten your seatbelt, turbulence ahead
Euro
Despite the mounting Euro risk, the single currency has not gone out of favour and rebounded convincingly from the 1.11 levels. Driven by the Greece's Bild retraction along with an active EUR bid after a Reuters headline – RTRS – ECB LIKELY TO DISCUSS REMOVING EASING BIAS AT JUNE MEETING BUT DECISION FAR FROM CERTAIN – SOURCES., the EURUSD surged to 1.1204 as the market is super sensitive to ECB headlines ahead of June 8 meeting.That said, it's hard to make a meal out of the headline after ECB President Draghi sounded oh so cautious the day before. But it does highlight just how trigger-happy and ECB headline sensitive dealers are these days.
The ECB headlines overshadowed US data as PCE core printed slightly higher than consensus but provided little more than light tail winds for the Greenbacks sail.
I suspect the Traders will continue to fret about the mounting Eur risk which could temper upside expectations until further clarity into the ECB'S forward guidance at next week's meeting There remains lots of vulnerabilities in this trade which could make for a rough week ahead.
Japanese Yen
USDJPY continues to trade in a mild risk-averse state undercut by softer US Treasury yields. The bid US fixed income emerged when oil prices continued to spill, and US equities turned south
Is it all about oil? Likely not as investors should be resonating with Fed Bullard who pulled few punches yesterday on Bloomberg TV and stated it's time for Washington to “get off the pot. ““Washington does have to deliver at some point, and I think that is a concern going forward, whether the honeymoon period would end at some point, and maybe the reality of American politics would settle in,” Bullard remarked, before delivering the following rather skeptical assessment: “We'll see if that happens or not. I think the jury is out on all that.”
Australian Dollar
A soundless overnight session as the market's focus was more on shifting Euro and Risk sentiment and the AUD remained rather sidelined trading within defined short term ranges. In tepid trade, the Aussie was the beneficiary of a weaker US dollar driven in part by month-end portfolio rebalancing demand.
The Aussie received a bounce on this morning after China May Manufacturing PMI which beat market expectation which is providing a better than expected growth pulse in the region and should provide a temporary boost to risk sentiment. But we should expect the Aussie sold on rallies as the outlook for hard commodities continues to sour, and the PMI print was not robust enough to shift growing forward-looking concerns about Chinas economy
New Zealand Dollar
The Kiwi is trading very confidently after the ANZ business confidence published a 3-month high sending the AUDNZD cross, a current market favourite below the 1.05 level .
Chinese Yuan
The Fixing is back online today, but traders are more focused on the current CNH funding crisis. So far Tom next is trading at 40 pips as the market is hoping for some front end ease from the PBOC. Todays Fixing midpoint is at 6.8633 vs. 8.8698 prior
EURUSD – Rallies, Eyes Further Upside
EURUSD - With the pair rejecting lower prices to close higher on Tuesday, further bullishness is likely in the days ahead. Resistance comes in at 1.1250 level with a cut through here opening the door for more upside towards the 1.1300 level. Further up, resistance lies at the 1.1350 level where a break will expose the 1.1400 level. Conversely, support lies at the 1.1150 level where a violation will aim at the 1.1100 level. A break of here will aim at the 1.1050 level. All in all, EURUSD faces further recovery pressure.
USD/CAD Canadian Dollar Lower Even As USD Caught In Political Drama
USD/CAD Canadian Dollar Lower Even as USD Caught in Political Drama
The Canadian dollar was lower versus its American counterpart on Tuesday. The loonie had no support from oil prices as concerns about Libyan output will tip the scales in favour of the oil glut remaining in the market despite the efforts of the Organization of the Petroleum Exporting Countries (OPEC) and other major producers to cut production levels for another 9 months.
The price of West Texas remains under $50 after the news that Libyan production will return to 800,000 daily barrels after the disruption in the Sharara field has been sorted. The release of weekly inventories on Thursday at 11:00 am EDT will be a powerful driver of oil prices as there is a lot of scepticism in the market about the expected results from the OPEC cut agreement extension when the US shale industry is rapidly ramping production.
The Canadian stock market was mixed as Scotiabank beat earnings forecasts bringing solid results for Canadian banks after their surprise downgrade by Moody's. The ratings agency deemed that the housing market is facing a speculative bubble that threatens the banks. Energy stocks fell alongside the price of oil and in general the stock market was subdued as political risks rose in Europe and the United States.
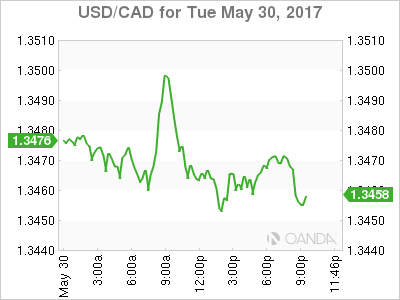
The USD/CAD gained 0.043 percent in the last 24 hours. The currency pair is trading at 1.3454 after producer prices rose in Canada for the eight month in a row. Canadian fundamentals have been mixed and tomorrow's release of the Canadian monthly GDP will bring clarity on the direction of the loonie.
The US dollar got a boost from Fed Speaker Brainard as the known dove deemed a rate hike soon to be appropriate. Investors are pricing in the possibility of a rate hike in June as 88.8 percent using the CME Fedwatch tool methodology based on Fed funds futures prices. Consumer confidence was lower than expected earlier today but remains strong at 117.9. The paradigm between a strong consumer confidence but weak retail sales continues as Americans are opting to save. Employment data has been the strongest evidence of a recovery, but the headline numbers are not enough for the U.S. Federal Reserve that is now more focused on wage growth. The U.S. non farm payrolls (NFP) report will be published this Friday, June 2 at 8:30 am EDT, with a forecast of 186,000 new jobs added in May.
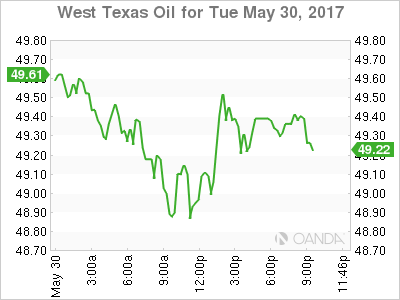
The price of oil lost 0.611 percent on Tuesday. The West Texas Intermediate is trading at $49.42 as concerns that the OPEC and other major producers agreement to extend the production cut might not be enough to curb the current glut in crude inventories. Energy prices fell in 2014 as Saudi Arabia pushed a market share grab strategy by ramping up production to drive prices and force US shale producers into default. The strategy backfired as low rates helped shale operations service their debts even at lower prices and the OPEC is now caught in a vicious circle where it is up to them to rebalance the market by removing the excess production.
Weekly US crude inventories are usually published on Wednesday's but due to the Memorial Day holiday it will be pushed back a day to Thursday at 11:00 am EDT.
Market events to watch this week:
Wednesday, May 31
8:30 am CAD GDP m/m
9:30 pm AUD Private Capital Expenditure q/q
9:30 pm AUD Retail Sales m/m
Thursday, Jun 1
4:30 am GBP Manufacturing PMI
8:15 am USD ADP Non-Farm Employment Change
8:30 am USD Unemployment Claims
10:00 am USD ISM Manufacturing PMI
11:00 am USD Crude Oil Inventories
Friday, Jun 2
4:30 am GBP Construction PMI
8:30 am CAD Trade Balance
8:30 am USD Average Hourly Earnings m/m
8:30 am USD Non-Farm Employment Change
8:30 am USD Unemployment Rate
Uncertain Fed & Uncertain UK Politics
The Fed's Brainard gave the strongest hint yet that low inflation won't dissuade a June hike but at the same time warned the Fed may pause afterwards. The New Zealand dollar led the way, while the Canadian dollar lagged. A UK election polls sent the pound plunging in early Asia-Pacific trade. The latest video for Premium subscribers is found below.
The April PCE report had something for everyone. The dollar initially rallied on the headlines because core PCE rose 0.2% m/m, slightly more than the +0.1% consensus. USD/JPY ticked 25 pips higher to 111.20 but that was the high for US trading.
Weighing on the dollar was a decline in year-over-year core inflation to 1.5% from 1.6%. It was expected but it extends the trend of slipping core inflation. Downward revisions to personal income also weighed but were balanced by rosy numbers on rising service sector salaries.
The change of a June hike rose to 88% from 84% according to the CME's Fedwatch measure but the dollar later declined. A big reason is because of eroding faith in longer term rate hikes.
Later in the day, the Fed's Brainard warned the FOMC may need to reassess its projected rate hikes. For the moment, she said it was premature to make that call and that's a signal that a June 14 rate rise is coming. But along with that hike, the statement is now more likely to include language that indicates more hikes will only come if inflation rises.
The bond market is now beginning to question whether those hikes will come at all. The 10-year yield fell 3.7 bps to 2.21% and is closing in on the post-election low of 2.16%. The US dollar is following yields lower.
Meanwhile, the pound took a sharp spill briefly below 1.28 in early Asia-Pacific trading. The trigger was a poll from YouGov that modeled the distribution of votes across ridings. It showed Theresa May's Conservatives winning but falling 16 seats short of a majority. That would seriously jeopardize Brexit negotiations and cripple the government.
From here, the focus will shift to China where the official PMIs are due at 0100 GMT. The manufacturing measure is forecast to slip to 51.0 from 51.2. the prior non-manufacturing reading was 54.0.
Note that it's also the final trading day of the month so flows could be a factor.
Consumer Confidence Declines Modestly in May
The Consumer Confidence Index fell slightly more than expected in May, with the overall index falling 1.5 points to 117.9. All of the decline was in the expectations component, which fell 2.8 points.
Consumers Remain Relatively Upbeat About Jobs and Income
The Consumer Confidence Index declined slightly more than expected, as the overall index fell 1.5 points to 117.9. Even with the drop, consumer confidence remains relatively solid. The overall index remains above the average for the six full months of data since the election, which had raised hopes that some growth-oriented fiscal stimulus would be enacted this year. That still may happen, but consumers have clearly scaled back their expectations. After hitting a post-recession high of 112.3 in March, the expectations series has fallen 9.7 points over the past two months.
The decline in expectations does not signal any increase in anxiety about the economy. The proportion of consumers expecting business conditions to increase, more jobs to be created and incomes to increase over the next six months spiked during the first three months of this year and has come back down from its cycle highs. All three series remain solidly positive, with more than twice as many consumers expecting business conditions to get better over the next six months than to get worse. At least twice as many consumers also expect their income to rise over the next six months than expect it to fall.
Employment prospects are likely the most important driver of consumer confidence today. The proportion expecting fewer jobs to be created over the next six months fell 1.8 points in May and is now at its lowest level since September 2000. The improvement is consistent with the continued slide in weekly unemployment claims and drop in the unemployment rate.
Improving employment conditions were responsible for the all of the increase in the present situation component, which rose 0.4 points to 140.7 in May. The proportion of consumers stating that jobs were hard to get tumbled 1.2 points in May to 18.2, while the proportion stating that jobs were plentiful fell 0.4 points to 29.9 percent. The labor market differential, which takes the difference between these two series, rose 0.8 points to 11.7.
Consumers took a slightly more cautious view of current business conditions, with the proportion stating present business conditions were good falling 1.4 points to 29.4 percent and the proportion stating present conditions were normal rising 1.4 points to 56.9. The proportion of consumers rating present conditions as bad in May was unchanged at 13.7. The employment components of the Conference Board survey are often looked to for any possible clues for the upcoming employment report. This May data were up on balance, but not decisively.
Buying plans for automobiles, homes and major appliances all declined. While these data are notoriously volatile, all three series hit their lowest levels this year. This bears watching but runs counter to recent reports citing improving consumer finances.
Solid Spending in April, Confirms Q2 Rebound is on Track
Personal income and spending both rose 0.4% in April, in line with the consensus forecasts.
Personal spending rose 0.2% in real terms, led by a 1.1% increase in durable goods. Services spending was largely flat in real terms, after a sizeable rebound in March (+0.6%).
Consumer prices rose 0.2% in April, bringing the year-on-year inflation rate to 1.7% (from 1.8% in March). Core prices (excluding food & energy) also rose 0.2% month-on-month - bringing year-on-year price growth to 1.5% (from 1.6% previously).
The personal saving rate was steady in April at 5.3%.
Key Implications
The second quarter rebound in consumer spending is right on track. Solid spending in April, combined with upward revisions to March data put spending on track to grow slightly above a 3% annualized pace. The good news is that personal spending gained momentum through the soft first quarter. The jump up in spending on durable goods is particularly encouraging that despite Q1 weakness, consumers remain confident to purchase big ticket items.
Another bright spot in the report was the continued gains in real income growth. After decelerating sharply at the end of 2016, real personal income grew at a 3.8% annualized pace over the past three months. That combined with solid job growth should underpin healthy consumer spending through the remainder of the year.
The weakness in core inflation in recent months may provide some fodder for the doves on the FOMC to delay further rate hikes until inflation pressures become clearer. Given the strength in the labor market, and the number of one-time factors that have put downward pressure on inflation recently, we think the Fed will be inclined to look past the recent softness and hike rates a quarter point in June.