Sample Category Title
GBP/USD Daily Outlook
Daily Pivots: (S1) 1.2804; (P) 1.2846; (R1) 1.2898; More...
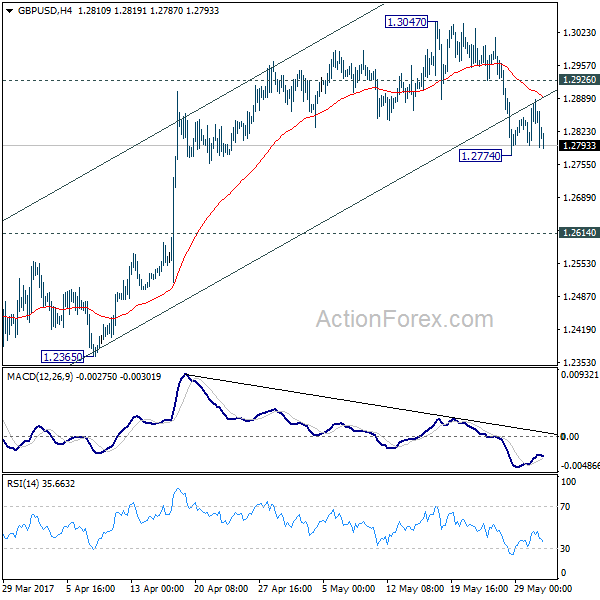
GBP/USD is staying in consolidation above 1.2774 temporary low and intraday bias remains neutral for the moment. We're holding on to view that rise from 1.2108 is completed. Hence, upside of current recovery should be limited by 1.2926 minor resistance and bring another decline. Below 1.2774 will target 1.2614 resistance turned support next. Break there should also indicate completion of whole consolidation pattern from 1.1946 and target a retest on this low. Meanwhile, above 1.2926 minor resistance will turn focus back to 1.3047 high instead.
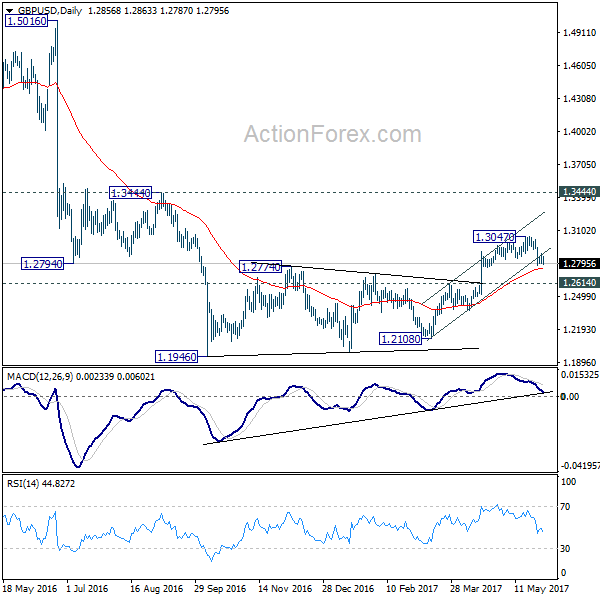
In the bigger picture, fall from 1.7190 is seen as part of the down trend from 2.1161. The rejection from 55 week EMA is maintaining bearishness in the pair. Also, at this point, as long as 1.3444 resistance holds, fall from 1.7190 is still expected to continue. Break of above mentioned 1.2614 support will affirm this bearish case.
USD/CHF Daily Outlook
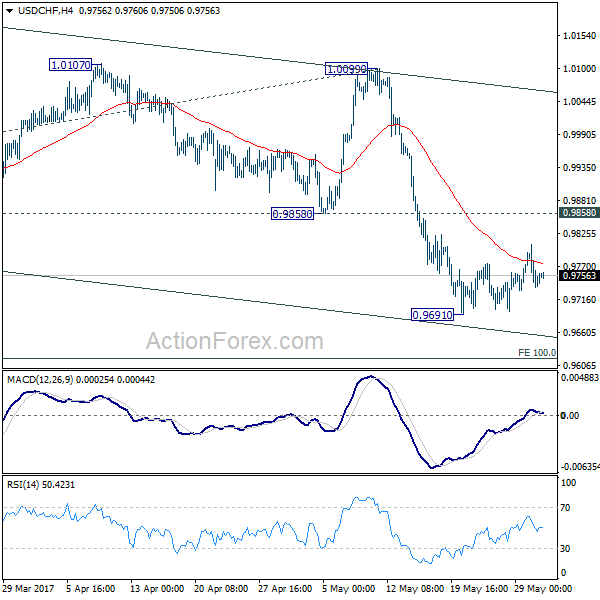
Daily Pivots: (S1) 0.9718; (P) 0.9763; (R1) 0.9789; More.....
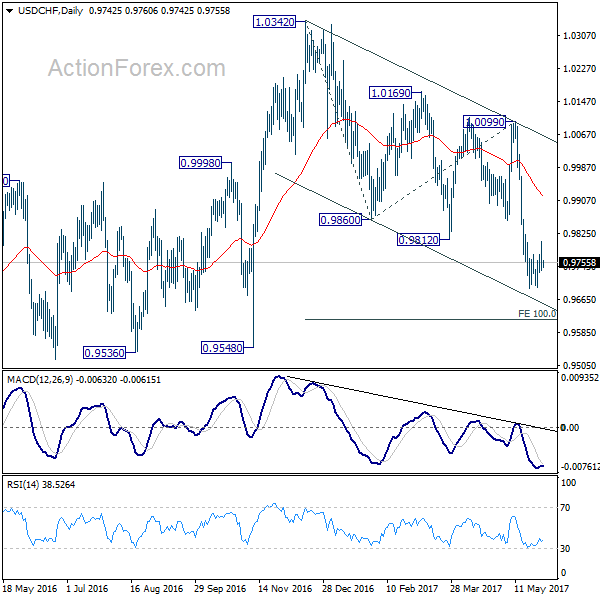
No change in USD/CHF's outlook as the consolidation pattern from 0.9691 is still in progress. Intraday bias remains neutral first. In case of another rise, upside should be limited by 0.9858 support turned resistance and bring fall resumption. Whole decline from 1.0342 is still in progress and below 0.9691 will target 100% projection of 1.0342 to 0.9860 from 1.0099 at 0.9617. We'll start to look for reversal signal below there.
In the bigger picture, USD/CHF is bounded in medium term range of 0.9443/1.0342 for the moment. Consolidative trading would likely continue and medium term outlook remains neutral. Break of 1.0342 key resistance is needed to confirm underlying bullish momentum in the pair. Meanwhile, downside attempts should be contained by 0.9443 key support level.
Market Update – Asian Session: China PMIs Find Footing, GBP Falls On Another Dire UK Election Survey
US Session Highlights
(US) APR PERSONAL INCOME: 0.4% V 0.4%E ; PERSONAL SPENDING: 0.4% V 0.4%E
(US) APR PCE CORE M/M: 0.2% V 0.1%E ; Y/Y: 1.5% V 1.5%E
(US) APR PCE DEFLATOR M/M: 0.2% V 0.2%E; Y/Y: 1.7% V 1.7%E
(US) MAR S&P / CASE-SHILLER 20-CITY M/M: 0.87% V 0.90%E; Y/Y: 5.89% V 5.61%E; HOUSE PRICE INDEX (HPI): 195.39 V 193.50 PRIOR
(US) MAY CONSUMER CONFIDENCE: 117.9 V 119.5E
(US) MAY DALLAS FED MANUFACTURING ACTIVITY: 17.2 V 15.0E
(US) Dallas Fed Kaplan (moderate; voter): we should begin the process of bringing down the balance sheet soon; base case remains for two more hikes this year
(US) Fed's Brainard (dove, voter): expects to begin shrinking bond portfolio before too long, perhaps this year; soft inflation is a source of concern; Another US rate hike is likely appropriate soon - comments in NY
US investors saw the markets resume amid a swath of US data releases and more tweets from President Trump. The President showed no inclination of calming the rhetoric that escalated between him and Germany's Merkel coming out of the G7 meeting, while the latest economic figures suggest the Fed could still be on a course to raise rates next month. Crude prices remained heavy, having a hard time holding close to $50 in the WTI. The Dollar index has tried to consolidate just above 97, but the stabilization feels tenuous. The Euro is bumping up against 112 as focus has continued to shift towards the June ECB meeting and the cover the next round of staff projections may give officials to begin reshaping expectations. Stocks drifted lower on both sides of the pond, while US Treasury markets outperformed that of European fixed income.
US markets on close: Dow -0.2%, S&P500 -0.1%, Nasdaq -0.1%
Best Sector in S&P500: Telecom
Worst Sector in S&P500: Energy
Biggest gainers: FSLR +7.2%; BWA +3.3%; MU +3.2%
Biggest losers: KMI -4.3%; SWN -3.9%; DVN -3.7%
At the close: VIX 10.4 (+0.6pts); Treasuries: 2-yr 1.30% (+1bp), 10-yr 2.22% (-3bps), 30-yr 2.89% (-3bps)
US movers afterhours
EXAS: Strength attributed to circulation of notice from UnitedHealth Group indicating it will cover Cologuard effective 7/1; +8.1% afterhours
NX: Reports Q2 $0.11 adj v $0.06e, R$209.1M v $206Me; affirms outlook; +4.9% afterhours
MNK: Reportedly has hired advisers to explore sale of generic drug division; could be worth up to $2B - press; +2.1% afterhours
Politics
(UK) YouGov/Times general election poll: UK Conservative Party would fall short of outright majority by 16 seats
(US) Former National Security Adviser Flynn to provide some documents to the Senate Intelligence Panel – US press
Key economic data
(CN) CHINA MAY MANUFACTURING PMI (GOVT OFFICIAL): 51.2 (matches 7-month low; 10th month of expansion) V 51.0E; NON-MANUFACTURING PMI: 54.5 V 54.0 PRIOR
(JP) JAPAN APR PRELIMINARY INDUSTRIAL PRODUCTION M/M: 4.0% V 4.2%E (rises at the fastest pace since June 2011); Y/Y: 5.7% V 6.1%E
(AU) AUSTRALIA APR PRIVATE SECTOR CREDIT M/M: 0.4% V 0.4%E; Y/Y: 4.9% V 4.9%E
(NZ) NEW ZEALAND MAY ANZ BUSINESS CONFIDENCE: 14.9 (3-month high) V 11.0 PRIOR; ACTIVITY OUTLOOK 38.3 v 37.7 PRIOR
Asia Session Notable Observations, Speakers and Press
Asian indices traded mixed following modest declines in US markets, where multi-month low in annualized Core PCE inflation was balanced by commitment to near-term tightening from Fed's Brainard and Kaplan. Probabilities for June rate hike are now around 88%, even as the outlook for a total of 3 hikes this year are still just below 50%. Yield curve is also flatter with a bid in Treasuries on the long end - spread on the 10-2-yr maturities has fallen to lowest level since Oct of last year.
China markets returned from a 2-day holiday and rallied as much as 1% in the morning session before giving it all back heading into the break. Official PMIs, which saw steady declines over the past couple of months, found some footing but still not giving much hope for Q2. April manufacturing PMI beat consensus with 10th straight month of expansion, but also matched a 7-month low. New Export Orders remained steady, but Employment contracted for 2nd straight month and Input Price gauge was at the weakest level in over a year. AUD/USD initially rallied on the results to session highs but then reversed its gains. Also of note in China, the latest Yuan fix was set firmer, and CNY hits its best level in the offshore market since early Feb around 6.803.
In other FX majors, GBP/USD fell abruptly after YouGov/Times general election study showed that based on latest pols, the Conservative Party would fall as many as 16 seats short of outright majority. Recall the April announcement of snap election was predicated on expectation of more broad support as PM May leads UK into Brexit negotiations, but her poor execution during the election season continues to backfire and cloud UK political landscape. Elsewhere, NZD rallied above $0.71 for the first time since early March after the release of ANZ business confidence, and its inflation outlook component for New Zealand was revised higher to 2.0% from 1.8%.
China
(CN) China National Stats Bureau (NBS): PMI shows external and domestic demand keep improving; Expect services sector to keep steady and fast growth
(CN) China may face liquidity issues in June amid higher Fed interest rates and mid-year inspections of banks – China Securities Journal
Japan
(JP) Japan may cut the settlement period for JGBs from May 2018 – Japanese Press
Australia/New Zealand
(NZ) New Zealand RBNZ Semiannual Financial Stability Report: financial system is sound but facing risks
(NZ) RBNZ Gov Wheeler: Very pleased house price inflation has slowed - press
Korea
(KR) South Korea to try and approve extra budget in June - Korean press
Asian Equity Indices/Futures (00:00ET)
Nikkei -0.1%, Hang Seng -0.1%, Shanghai Composite +0.1%, ASX200 +0.3%, Kospi +0.1%
Equity Futures: S&P500 flat; Nasdaq +0.1%, Dax flat, FTSE100 +0.1%
FX ranges/Commodities/Fixed Income (00:00ET)
EUR 1.1170-1.1195; JPY 110.75-111.20; AUD 0.7445-0.7475; NZD 0.7080-0.7115
June Gold -0.2% at 1,260/oz; July Crude Oil -0.6% at $49.37/brl; July Copper +0.1% at $2.57/lb
(CN) PBOC SETS YUAN MID POINT AT 6.8633 V 6.8698 PRIOR; Strongest Yuan fix since May 18th
(CN) PBOC to inject combined CNY210B v CNY40B prior
(HK) Overnight CNY HIBOR 21.0793% (highest level since Jan 6th)
(AU) Australia sells A$800M in 2.25% 2028 bonds; avg yield 2.4978%; bid-to-cover 2.83x
Asia equities notable movers
Australia
Shaver Shop (SSG) +2.3%; Guides FY17
Japan
NTT Docomo (9437) -1.1%; Cut at Goldman
Toshiba (6502) -4.0%; Working with auditor to file full earnings report by June 30th deadline; Also: signs agreement to split off three core businesses on July 1st - press
Hong Kong
Lenovo (992) +5.8%; CEO Yang denies press speculation that the company will go private
Yue Yuen (551) +0.5%; To continue to expand its capacity, product development and research
CRRC (1766) -0.8%; In final stage talks to acquire Skoda Transportation for CZK30B
USD/JPY Daily Outlook
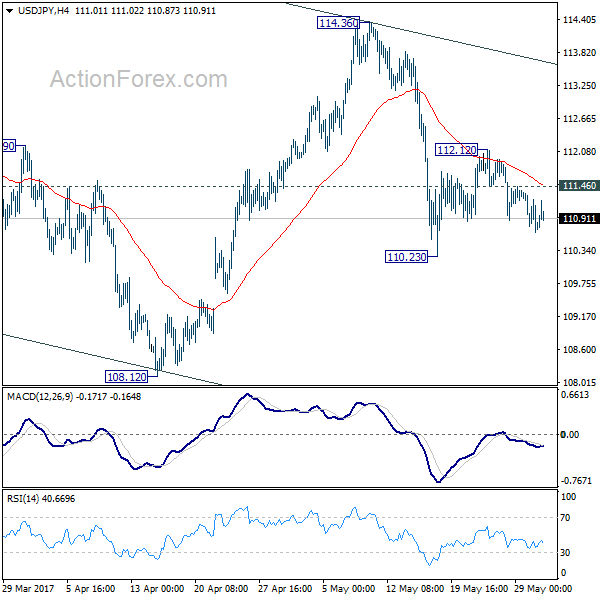
Daily Pivots: (S1) 110.56; (P) 110.93; (R1) 111.22; More...
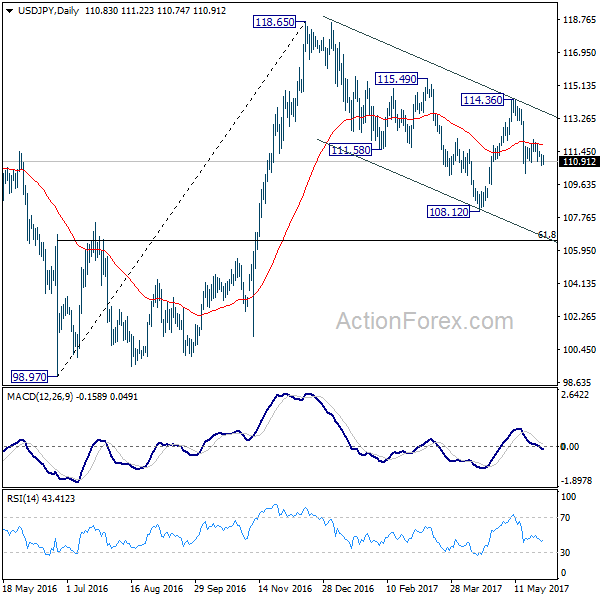
At this point, intraday bias in USD/JPY remains mildly on the downside for 110.23. Break will resume the fall from 114.36 to 108.12 and below. Note again that decline from 118.65 is seen as a correction. In that bearish case, we'll look for bottoming signal again at 61.8% retracement of 98.97 to 118.65 at 106.48. On the upside, above 111.46 minor resistance will turn intraday bias neutral again first.
In the bigger picture, price actions from 125.85 high are seen as a corrective pattern. It's uncertain whether it's completed yet. But in case of another fall, downside should be contained by 61.8% retracement of 75.56 to 125.85 at 94.77 to bring rebound. Overall, rise from 75.56 is still expected to resume later after the correction from 125.85 completes.
USDCNY In Selloff Mode As RMB Fixing Changed
Key Points:
- PBOC changes the fixing process for the Renminbi.
- Move has stabilised the Renminbi and may lead to appreciation.
- USDCNY has fallen to the lowest level since early 2017.
In a move that is likely to please the Trump administration, the Chinese government has taken action to revalue the Renminbi and subsequently sent the USDCNY pair tumbling. Last week saw the Peoples Bank of China (PBOC) adding some additional factors into the model which determines the Yuan’s daily fixing rate with the ultimately aim of further stabilising the currency. This is likely to be seen as a welcome move from the central bank given the sharp selloff in the Yuan over the past year.
However, there are some negatives to the move with many market participants criticizing the lack of a free market driven valuation and suggesting that the latest move simply again pushes towards full government control. Subsequently, although the fixing alteration certainly takes immediate moves to stabilise the currency it does so in an artificial way, especially for a currency which has recently been added to the reserve basket of currencies.
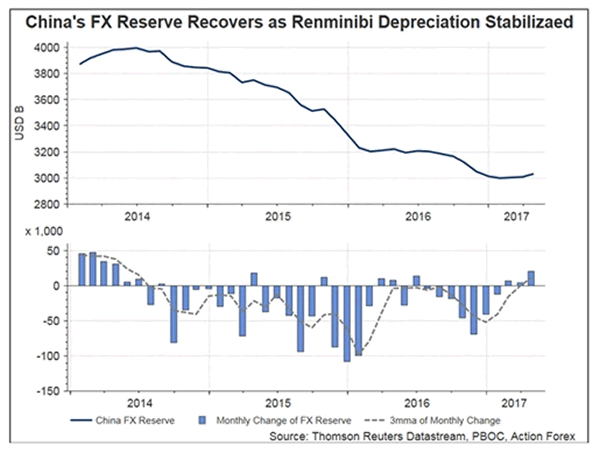
The reality is that the changing of the fixing factors is largely strategic with the currently depressed value of the greenback providing a unique opportunity to add a “cushion” for when the USD roars again. In addition, the domestic slowdown in China has largely meant that currency outflows have reduced significantly and might help to increase expectations around an appreciation in the value of the Yuan. Subsequently, the timing shouldn’t really be of surprise to anyone given that the depressed state of the greenback provided the central bank with a very unique window of opportunity.
Ultimately, the move is likely to further relive the PBOC of the pressures of capital outflows and might help to actually reduce the political pressure on the nation to not be seen as a “currency manipulator”. However, this comes at the risk of the Renminbi being seen as government controlled rather than market driven which is a strange situation for a reserve currency to be in. Regardless, the move is likely to stabilise the Yuan in the medium term and we might actually see some appreciation over the coming month.
GBP/JPY Daily Outlook
Daily Pivots: (S1) 141.84; (P) 142.46; (R1) 143.12; More....
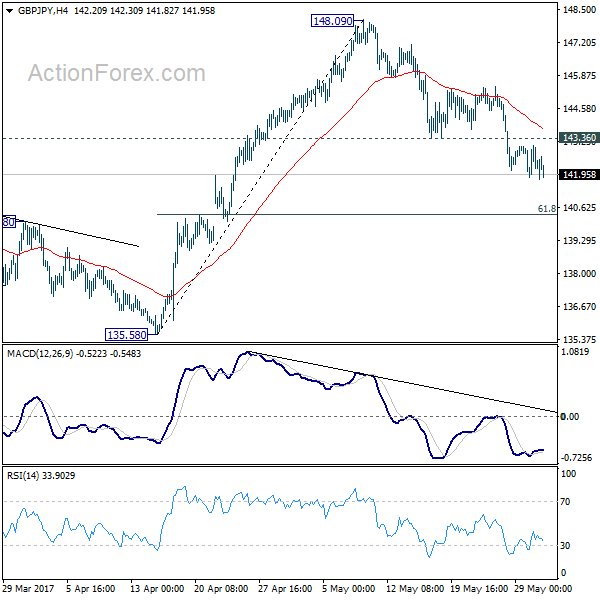
GBP/JPY is losing some downside momentum as seen in 4 hour MACD. But intraday bias stays on the downside with 143.36 minor resistance intact. Fall from 148.09 is expected to extend to 61.8% retracement of 135.58 to 148.09 at 140.35. At this point, we'd still expect rebound from 122.36 to resume later. Hence, we'd look for strong support below 140.35 to contain downside and bring rebound. On the upside, above 143.36 minor resistance will turn bias back to the upside. However, sustained trading below 140.35 will dampen our bullish view and turn focus back to 135.58 key near term support instead.
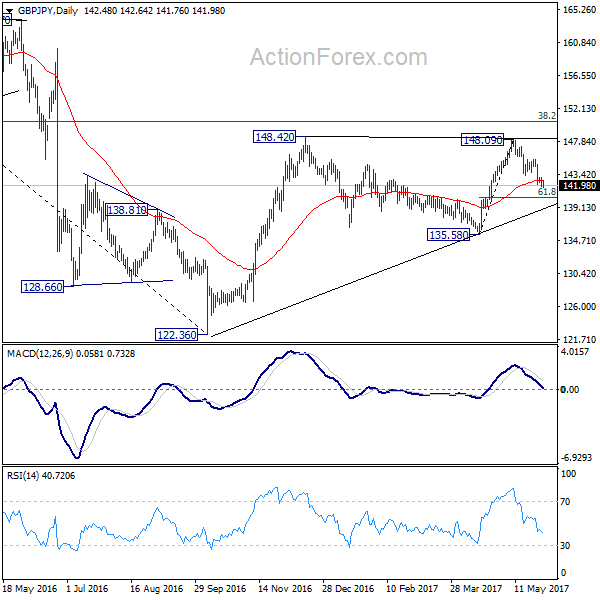
In the bigger picture, rise from 122.36 medium term bottom is still expected to extend to of 195.86 to 122.36 at 150.42. And decisive break there could pave the way to 61.8% retracement at 167.78. However, as the cross is starting to lose upside momentum, rejection below 150.42 and break of 135.58 support will indicate reversal and bring deeper fall back to retest 122.36 instead.
EUR/JPY Daily Outlook
Daily Pivots: (S1) 123.28; (P) 123.84; (R1) 124.52; More...
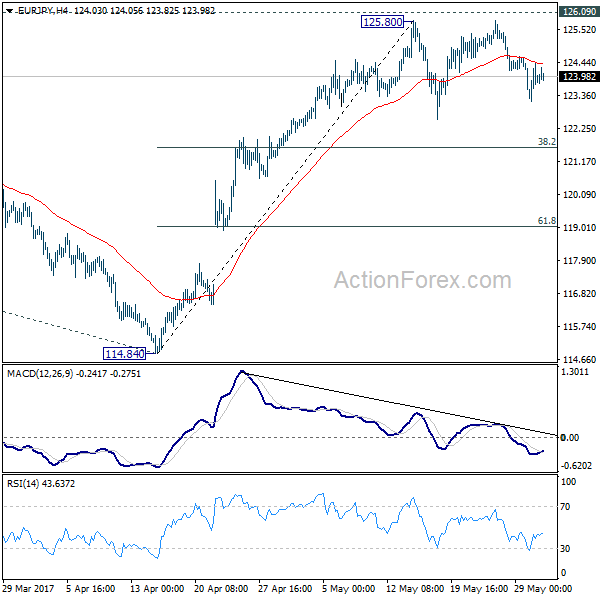
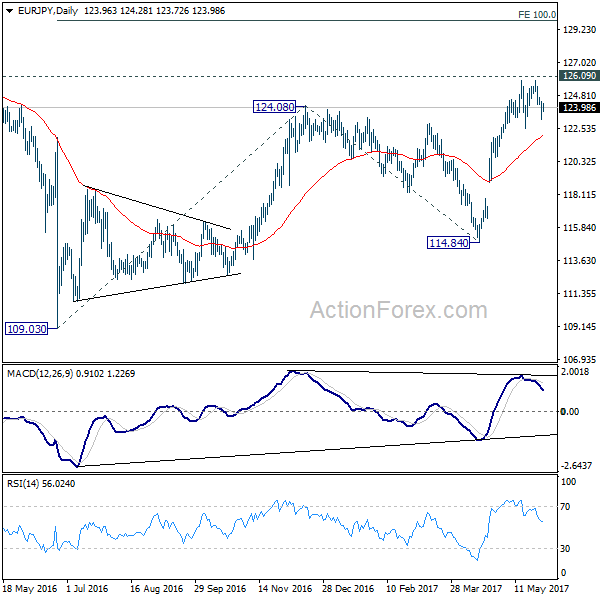
No change in EUR/JPY's outlook as consolidation from 125.80 is still in progress. Intraday bias remains neutral for the moment. In case of another fall, we'd expect downside to be contained by by 38.2% retracement of 114.84 to 125.80 at 121.61 to bring rise resumption. We're staying mildly bullish in the cross. And, break of 126.09 key resistance will extend the whole rebound from 109.03 to 100% projection of 109.03 to 124.08 from 114.84 at 129.89. Nonetheless, firm break of 121.61 will dampen our bullish view and bring deeper fall to 61.8% retracement at 119.02.
In the bigger picture, focus is back on 126.09 support turned resistance. Decisive break there will confirm completion of the down trend from 149.76. And in such case, rise from 109.20 is at the same degree and should target 141.04 resistance and above. Meanwhile, rejection from 126.09 and break of 114.84 will extend the fall from 149.76 through 109.20 low.
Cable Looking Resilient Despite Last Week’s Bearishness
Key Points:
- The technical bias is rather bullish despite recent setbacks.
- A reversal could see the pair back up above the 1.30 handle.
- Fundamentals still proving to be a drag on the Cable's performance.
The Cable had been making steady progress over recent weeks but a near-term slide is beginning to suggest we may unceremoniously sink back below the 1.2772 handle. Indeed, given May's weakening grasp on the UK elections and the fallout from the Manchester attack, it seems more than reasonable to suggest a grim outlook for the pair. However, contrary to this seemingly reasonable forecast, the technical bias suggests we may have something altogether different instore.
As is made apparent in the below chart, the Cable has been laying the groundwork for an Elliot wave that could see it well and truly back above the 1.30 handle. Of course, this is largely contingent on the current level of support around the 1.2772 mark remaining intact and this is not exactly a given. Nevertheless, there is a relatively robust argument to be made that we will see support hold as we can see that this price coincides with both the 38.2% Fibonacci level and a historical reversal point. Moreover, stochastics are flirting with becoming oversold which will be helping to cap downsides.
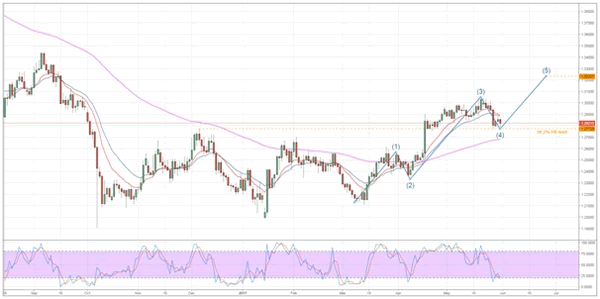
If we do indeed see support remain in place, the subsequent reversal could be the start of an advance that might take the pair back above the 1.30 handle. Such an uptrend would be in line with our current EMA bias which, as is shown above, is highly bullish despite the recent spate of losses. Furthermore, the recent foray to the downside has pushed the Cable back to its lower Bollinger band which would typically indicate that buying pressure is about to return.
Whilst the technicals have a fairly clear bias, the fundamentals remain decidedly more opaque. Setting aside individual economic news items, the spectre of Brexit continues to hang over the UK and generates significant headwinds with which the GBP must contend. In addition, any of the bullishness inspired by early beliefs that Theresa May would lead the Tories to a landslide victory – and thereby strengthen her hand in negotiating Brexit – could evaporate as the latest polls are suggesting that her lead is narrowing.
Ultimately, despite this fundamental bias, the outlook is still more positive than it has been previously. This reflects the end of the ‘Trump Bump' for the Greenback and, more recently, the improving technical forecast which is laid out above. As a result, the bulls may finally be back in business as we move ahead which should lead to an interesting few weeks for the pair.
EUR/CHF Daily Outlook
Daily Pivots: (S1) 1.0883; (P) 1.0898; (R1) 1.0916; More...
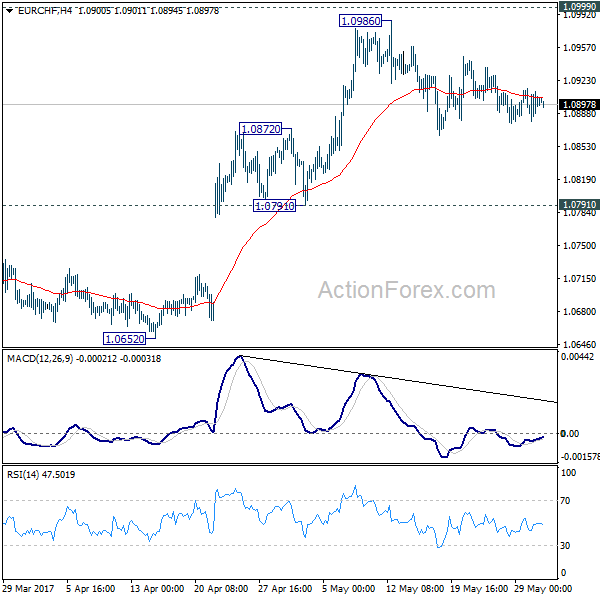
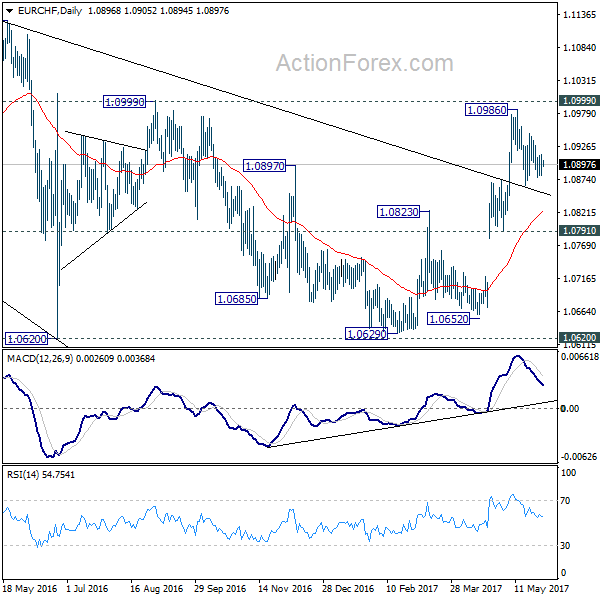
The consolidation pattern from 1.0986 is still extending and intraday bias in EUR/CHF remains neutral at this point. Deeper fall cannot be ruled out. But downside should be contained by 1.0791/0872 support zone to bring rise resumption. As noted before, the consolidative pattern from 1.1198 should be completed. Firm break of 1.0999 resistance will pave the way for a retest on 1.1198 high.
In the bigger picture, the price actions from 1.1198 are seen as a corrective move. Current strong rebound is raising the chance that it's completed after defending 38.2% retracement of 0.9771 to 1.1198 at 1.0653. Decisive break of 1.0999 resistance will target a test on 1.1198 high. For now, this will be the preferred case as long as 1.0791 support holds.
EUR/AUD Daily Outlook
Daily Pivots: (S1) 1.4933; (P) 1.4976; (R1) 1.5024; More...
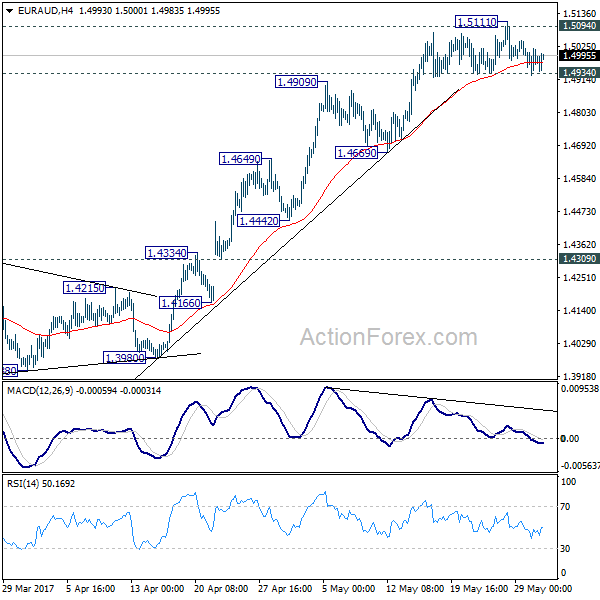
Intraday bias in EUR/AUD remains neutral for the moment. On the downside, firm break of 1.4934 minor support will confirm short term topping, on bearish divergence condition in 4 hour MACD, after hitting 1.5094 key resistance. In that case, deeper pull back would be seen to 55 day EMA (now at 1.4570). Meanwhile, sustained break of 1.5094 resistance will extend the rally from 1.3624 to next medium term fibonacci level at 1.5455.
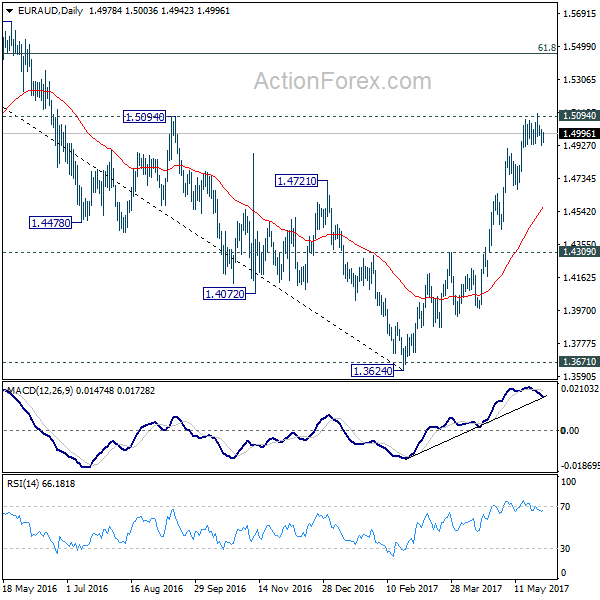
In the bigger picture, price actions from 1.6587 medium term top are viewed as a corrective pattern. Such correction should be completed at 1.3624 after defending 1.3671 key support. Rise from 1.3642 is now expected to target 61.8% retracement of 1.6587 to 1.3624 at 1.5455 and above. In any case, outlook will now stay cautiously bullish as long as 1.4309 resistance turned support holds.