Sample Category Title
European Open Briefing: Markets Were Surprised By A Downgrade Of China’s Credit Rating By Moody’s
Global Markets:
- Asian stock markets: Nikkei up 0.55 %, Shanghai Composite fell 0.40 %, Hang Seng declined 0.15 %, ASX 200 gained 0.05 %
- Commodities: Gold at $1251 (-0.30 %), Silver at $16.98 (-0.90 %), WTI Oil at $51.60 (+0.20 %), Brent Oil at $54.25 (+0.20 %)
- Rates: US 10-year yield at 2.28, UK 10-year yield at 1.08, German 10-year yield at 0.41
News & Data
- Japan Reuters Tankan Index May: 24 (prev 26)
- Australian Construction Work Done (QoQ) Q1: -0.7% (exp -0.5%; prev -0.2%)
- New Zealand Trade Balance (MoM) (NZD) Apr: 578M (prev 332M)
- New Zealand Trade Balance (YoY) (NZD) Apr: -3.481B (prev -3.67B)
- New Zealand Exports (NZD) Apr: 4.75B (prev 4.65B)
- New Zealand Imports (NZD) Apr: 4.17B (prev 4.31B)
- Fed's Harker: Repeats Support for Shedding Bonds This Year and Two More Rate Hikes This Year
- Fed's Harker: Labour Market Has Very Little Slack Left
- Fed's Harker: Fed Will Adjust Pace of Rate Hikes If Needed
- Fed's Harker: June Rate Hike 'A Distinct Possibility'
Markets Update:
Markets were surprised by a downgrade of China's credit rating by Moody's. The rating agency lowered China's rating from A1 to AA3 and the outlook from “stable” to “negative”. This put stocks in Asia under pressure, especially in Shanghai and Hong Kong.
The announcement had also an effect on the FX market. The Australian Dollar declined, as Australia's economy is quite sensitive to developments in China. AUD/USD fell from 0.7480 to a low of 0.7480. The breakout in the pair now looks like a false one, and losses could extend to 0.7380, where the next notable support level lies.
This put also some pressure on the New Zealand Dollar, which fell despite better than expected trade data, which showed a solid increase in exports. NZD/USD declined from 0.7040 to 0.70.
The Euro retraced some of the recent gains, amid broad USD strength in the market. A break below 1.1170 support would indicate that EUR/USD could fall back to 1.11 soon.
This evening, the Federal Reserve will publish its latest meeting minutes. The central bank is likely to signal a rate hike in June. Given that the market is already expecting that, the release will likely be a non-event.
Upcoming Events:
- 13:45 BST – ECB President Draghi speaks
- 15:00 BST – US Existing Home Sales
- 15:00 BST – Bank of Canada Rate Decision
- 15:30 BST – US Crude Oil Inventories
- 19:00 BST – FOMC Meeting Minutes
The Euro Could Be Moving Into The Final Stages Of An Elliot Wave
Key Points:
- An Elliot wave could spell near-term losses for the EUR.
- A number of technical readings are now bearish.
- Medium to long-term bias remains bullish.
The Euro's most recent surge higher is beginning to show signs of cracking as the bears are now putting up a bit of a fight. Indeed, last session's slip could be the start of a rather pronounced tranche of losses that may see the pair back down at around the 1.0971 level. Although, things aren't altogether grim as this may actually be a necessary correction in the Euro's journey all the way back to last year's highs.
Firstly, let's take a look at just why a reversal and subsequent slip back to support is warranted. One vital reason to suspect a change in bias is the stochastic oscillator which is clearly overbought. However, given that this has been the case for some time, it alone is unlikely to convince the bulls to give up the ghost just yet. Fortunately, if we focus in on the last two candles it also becomes clear that we have either a tweezer top or bearish engulfing taking place which would also suggest losses are now on the way.
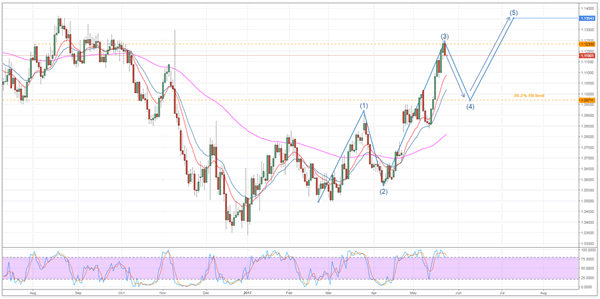
Incidentally, this bearish reversal is occurring at around the right price for an Elliott wave’s third leg to complete. As shown above, the recent spate of gains has stalled at the 1.1233 mark which had been a likely candidate level for a reversal given the historical resistance present at this price. Importantly, this leads us into the second part of our forecast which is concerned with how far we expect to see the EUR tumble and how high we expect the following rally to carry the pair.
Currently, it is assumed that any near-term decline could reach as low as the 1.0971 mark before the bulls regain control. Such a tumble would be appropriate for the above Elliott wave and would also respect the 38.2% Fibonacci level. As a result, it would in all likelihood require a major fundamental upset to see support at this level broken, especially as the 100 day EMA will be a source of dynamic support around this price.
Due to the relative robustness of the forecasted support level, we remain tentatively optimistic that a secondary reversal would occur around here. This should, in turn, lead into a period of gains for the EURUSD which might extend as high as the 1.1354 mark by late July. Bullishness beyond this level is currently doubtful as we would then begin to stray into the highs of last year which may prove to be a medium to long-term limit amid the ongoing Brexit fears.
Ultimately, even if the long-term bias is incorrect, the near-term slip is looking rather likely. As mentioned, the combination of being overbought and the historic zone of resistance around the 1.1233 level should be more than a match for the already exhausted bulls. However, as always, keep an eye on the fundamental side of things as the ECB has been toying with the idea of raising rates as early as June which could prematurely end the forecasted downtrend.
GBP/JPY Daily Outlook
Daily Pivots: (S1) 144.05; (P) 144.60; (R1) 145.43; More....
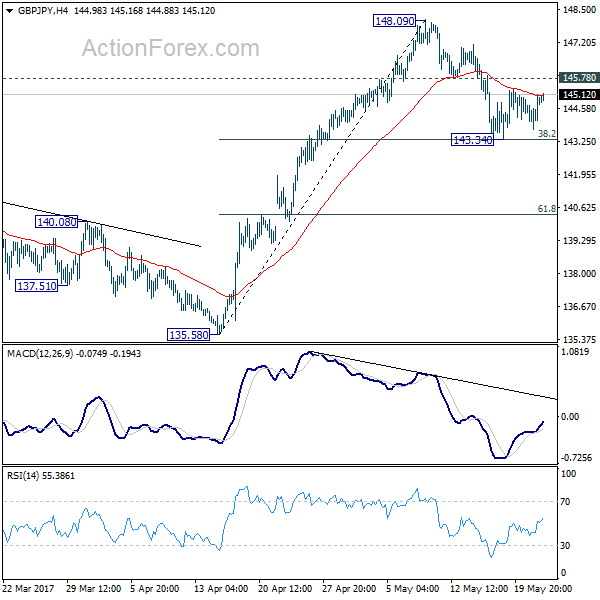
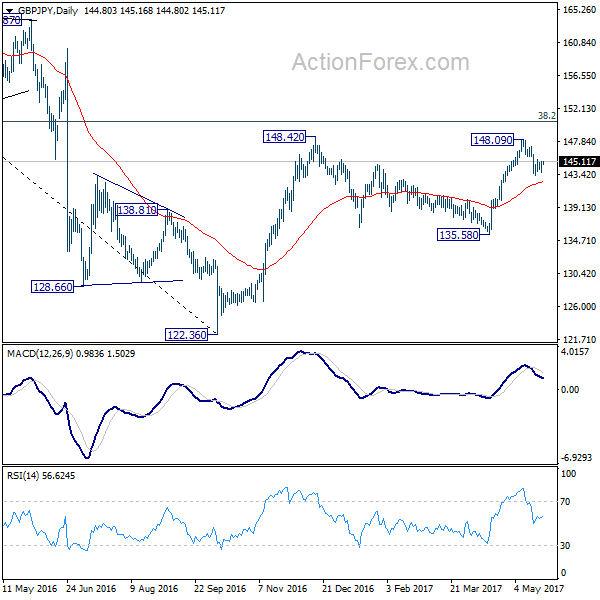
Intraday bias in GBP/JPY is still neutral at this point. The corrective pattern from 148.09 short term top could extend. On the upside, above 145.78 will turn bias back to the upside for retesting 148.09 first. Meanwhile, break of 143.34 will extend the pull back from 148.09 to 61.8% retracement at 140.35. Overall, we'd still expect the rise from 122.36 to resume after pull back from 148.09 completes. Break of 148.09 will target 150.42 long term fibonacci level first.
In the bigger picture, based on current momentum, rise from 122.36 bottom should be developing into a medium term move. Break of 38.2% retracement of 195.86 to 122.36 at 150.42 should pave the way to 61.8% retracement at 167.78. This will now be the favored case as long as 135.58 support holds.
EUR/JPY Daily Outlook
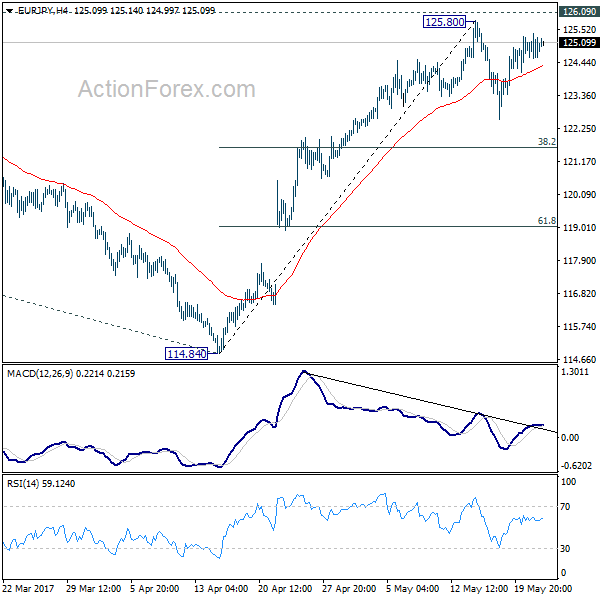
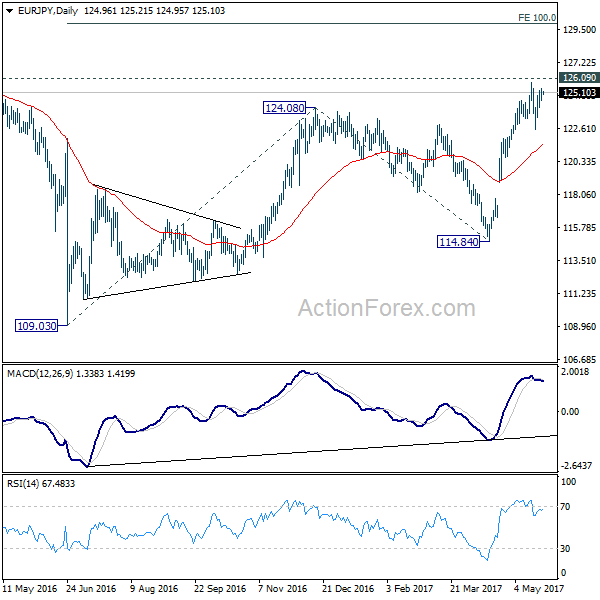
Daily Pivots: (S1) 124.57; (P) 124.97; (R1) 125.39; More...
EUR/JPY is still bounded in the consolidation pattern from 125.80 and intraday bias remains neutral. Another fall could be seen but downside should be contained by 38.2% retracement of 114.84 to 125.80 at 121.61 to bring rise resumption. We're staying mildly bullish in the cross. And, break of 126.09 key resistance will extend the whole rebound from 109.03 to 100% projection of 109.03 to 124.08 from 114.84 at 129.89.
In the bigger picture, focus is back on 126.09 support turned resistance. Decisive break there will confirm completion of the down trend from 149.76. And in such case, rise from 109.20 is at the same degree and should target 141.04 resistance and above. Meanwhile, rejection from 126.09 and break of 114.84 will extend the fall from 149.76 through 109.20 low.
The Impact Of Moody’s China Downgrade On FX
Key Points:
- China's sovereign debt rating downgraded.
- Rising risks of an FX intervention from the PBOC.
- Watch for continual Yuan depreciation in the weeks ahead.
The last 24 hours has been a watershed moment for the Chinese economy, as well as the Yuan, as Moody's have moved to decisively downgrade the countries credit rating from A1 to Aa3. Although markets have reacted with shock, the reality is that macro economists have, for some time, questioned the veracity of China's economic reporting. Subsequently, it comes as no surprise that Moody's have finally taken action to confirm a negative outlook for the manufacturing power house. However, it remains to be seen what impact the downgrade will have specifically on the FX markets.
Subsequently, at the time of writing, the USDCNY is currently trading around the 6.8945 mark and the pair has seen plenty of upside momentum which is likely to continue in the coming session. This is a direct effect from the credit downgrade as the market starts to focus on the rising Chinese debt levels and stalling economy. In addition, most economists have suggested that indirect and contingent liabilities will continue to increase and that we are likely to see debt levels around 40% of GDP by 2018. Clearly, this sentiment is likely to be reflected in the FX markets in the coming weeks as traders continue to pile up against the Yuan.
The first impact has largely been to do with restricting capital flows in the aftermath of the credit downgrade. This has seen the PBOC setting stronger daily Yuan fixings to offset some of the capital outflow pressures that have been evident during today's session. However, this is little respite given the trading pressures around the onshore Yuan and the high demand for the U.S. Dollar. Subsequently, despite firmer fixings, the capital outflows are likely to accelerate in the face of the credit downgrade and this poses a problem for the PBOC in their management of the Yuan.
Subsequently, the Chinese authorities are likely to have to revert to FX interventions in an attempt to help stem the flow of capital from the Asian powerhouse. However, this poses its own difficulties as the nation will need to access their foreign currency reserves to stump up the Yuan's value and, typically, that can be a losing proposition given the difficulties in holding back the market.
Ultimately, the next few months are likely to be relatively rough for both the onshore and offshore Yuan and a slow but concerted depreciation is likely to be the order of the day. However, be mindful of the risk of FX intervention by the PBOC because, in all likelihood, they are going to be unwilling to give up the battlefield without a solid fight first. Whichever way you look at it, concern about an economic slowdown in China is likely to grow beyond the implications for an FX market, especially if there is a further fall in global trade.
EUR/GBP Daily Outlook
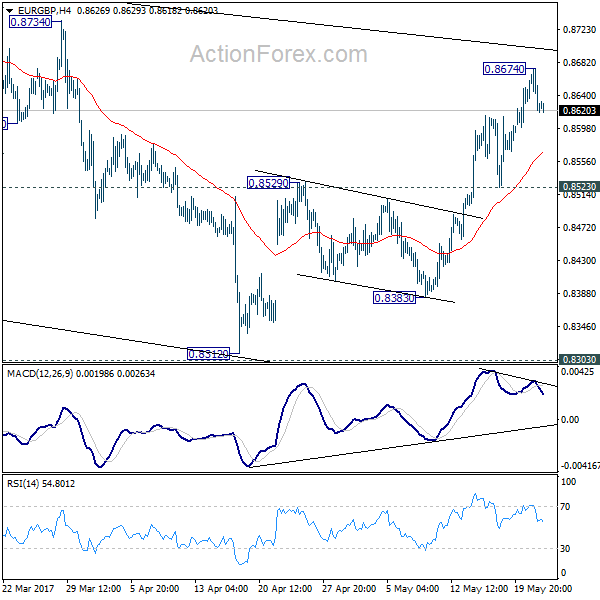
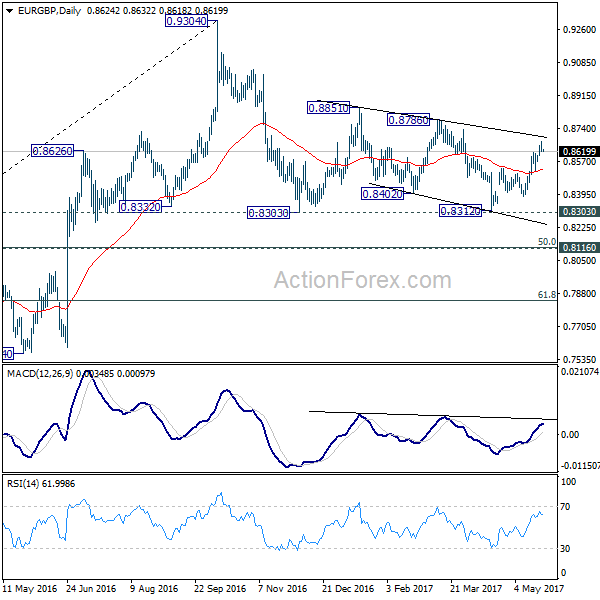
Daily Pivots: (S1) 0.8605; (P) 0.8639; (R1) 0.8661; More...
A temporary top is in place at 0.8674 and intraday bias in EUR/GBP is turned neutral first. Further rise is expected as long as 0.8523 support holds. Above 0.8674 will extend the rise from 0.8312 to 0.8786 resistance. Note again that price actions 0.9304 are viewed as a medium term corrective pattern that is extending. Break of 0.8786 would now pave the way to retest 0.9304 high. However, break of 0.8523 will indicate that rebound from 0.8312 has completed and turn bias back to the downside.
In the bigger picture, price actions from 0.9304 are viewed as a medium term corrective pattern. In case of deeper fall, we'd expect strong support from 0.8116 cluster support (50% retracement of 0.6935 to 0.9304 at 0.8120) to contain downside. Rise from 0.6935 (2015 low) will resume at a later stage to 0.9799 (2008 high). However, sustained break of 0.8116 could bring deeper decline to next key support level at 0.7564 before the correction completes.
Elliott Wave View: ES_F Ending Impulse
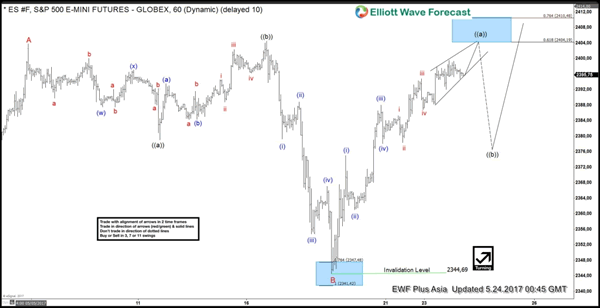
Short Term Elliott Wave view in ES_F suggests the rally to 2403.75 ended Minor wave A. Minor wave B unfolded as an Expanded Flat Elliott Wave structure where Minute wave ((a)) ended at 2379, Minute wave ((b)) ended at 2404.5, and Minute wave ((c)) of B ended at 2344.5. After ending the pullback, the Index started a new leg higher and the rally from 2344.5 low looks to be unfolding as a 5 waves Elliott Wave impulse structure where Minutte wave (i) ended at 2375, Minutte wave (ii) ended at 2361, Minutte wave (iii) ended at 2388 and Minutte wave (iv) ended at 2378. Minutte wave (v) is in progress and the Index has scope to extend higher towards 2404.2 – 2410.5 area and this last push higher should also end Minute wave ((a)).
Once Minute wave ((a)) is complete, the Index is expected to pullback within Minute wave ((b)) in 3, 7, or 11 swing to correct cycle from 5/18 low (2344.7) before the rally resumes again. Ideally the last push higher in Minutte wave (v) of ((a)) breaks above the previous peak at 2404.5 as a break above that level will give confirmation that the Index has started the next leg higher. If Minute wave ((a)) can end above 2404.5, there’s a better chance that Minute wave ((b)) pullback can hold above 2344.7 for the next leg higher. We don’t like selling the proposed pullback and expect buyers to appear again once Minute wave ((b)) pullback is complete at later stage, provided that pivot at 2344.7 low remains intact.
ES_F 1 Hour Elliott Wave Chart
EUR/AUD Daily Outlook
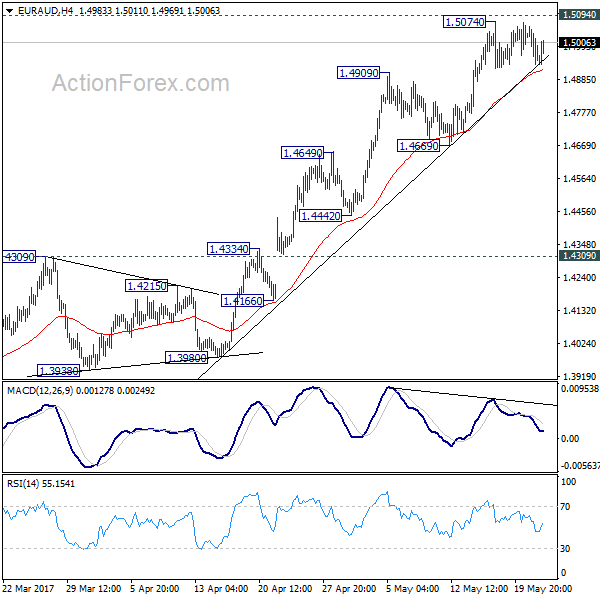
Daily Pivots: (S1) 1.4906; (P) 1.4981; (R1) 1.5028; More...
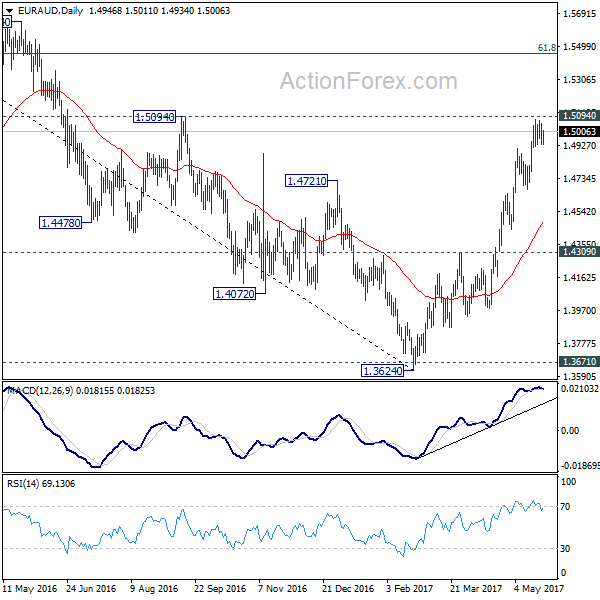
Intraday bias in EUR/AUD remains neutral as consolidation from 1.5074 continues. Another fall cannot be ruled out but downside should be contained above 1.4669 support and bring rise resumption. We're holding on to the bullish view that the medium term trend has reversed. Break of 1.5094 resistance will extend the rally from 1.3624 to next medium term fibonacci level at 1.5455. However, considering bearish divergence condition in 4 hour MACD, break of 1.4669 will confirm short term topping and bring deeper pull back, possibly to 55 day EMA (now at 1.4469).
In the bigger picture, price actions from 1.6587 medium term top are viewed as a corrective pattern. Such correction should be completed at 1.3624 after defending 1.3671 key support. Rise from 1.3642 is now expected to target 61.8% retracement of 1.6587 to 1.3624 at 1.5455 and above. In any case, outlook will now stay cautiously bullish as long as 1.4309 resistance turned support holds.
Market Morning Briefing: Overall Markets Are Mixed Globally
STOCKS
Overall markets are mixed globally. Dow and Dax could re-test crucial resistances in the near term while Nikkei is in a consolidation phase. Shanghai could start moving up soon and Nifty may also bounce back from near term support levels.
Dow (20937.91, +0.21%) and Dax (12659.15, +0.31%) have risen slightly. Both Dow and Dax has important resistances in the 21000-21200 region and 12800-13200 region respectively and while that holds, the indices could consolidate sideways if not fall to lower levels in the near term.
Shanghai (3042.75, -0.64%) has tested the support on the 3-day candle charts and if that holds, it may move up towards 3150-3170 in the medium term. While above 3000, trend looks bullish.
Nikkei (19707.87, +0.48%) has been trying to move up towards resistance near 20000 again but movement has been very narrow in the past few sessions. Trade within 20000-19400 region may be seen in the coming sessions without much attempt to break on either side just now.
Nifty (9386.15, -0.55%) is tested decent support at 9370 yesterday before closing at slightly higher levels. 9350-9370 is an important near term support zone and while that holds, a bounce could be expected in the near term.
COMMODITIES
Gold (1252) could not hold its ground above 1260 levels and fell towards its crucial support of 1249, which could be a level where the price action has to be checked to assess the chances of further bounce to 1260-80 regions. A failure to hold 1249 could keep the price range-bound in the 1220-1250 regions.
Similar kind of trading pattern has been seen in silver (17.01) also though the same it still above its crucial support of 16.90. The recent trading range could be 17.50-16.90 and we will remain bearish while it is trading below 17.50 levels. A close below 16.90 could open up 16.50 levels as well.
Copper (2.57) has found resistance at 2.62 levels. Only above 2.62, higher resistances of 2.68-72 can come into consideration. In the medium term 2.55 are going to be a strong support now but a close below that could open up 2.44-35 levels as well.
Both Brent (54.20) and the current NYMEX July contract of WTI (51.64) are trading within the range of 54.20 – 56.32 and 51.28 – 53 respectively. Both the contracts are highly overbought in near term time frame thus a correction will be anticipated. Besides we have U.S crude oil inventory data today at 8.00 P.M with an expectation of a decrease of 2.4 MB. If the actual figures are higher than the expected, we might be able to see further rally (less preferred view) otherwise a move below the respective supports could drag Brent and WTI towards 52 and 50 levels.
FOREX
Dollar Index (97.37) held previous day's low of 96.80 to recover to a minor degree but the corrective bounce can reach 98.30 at best if it manages to break and sustain above the interim resistance of 97.45. Our downside target of 96.50-00 remains unchanged. Euro (1.1179) is seeing a normal correction while the larger uptrend remains intact so far. This correction can take it to 1.1100-1.1075 where fresh buying can be expected again. Repeat - if any profit booking is seen in Euro either near 1.1300-30 or near the higher long term resistance of 1.1400-50, then corresponding short covering can be expected in Dollar near 96.50 or 96.00.
Dollar Yen (111.90) is testing the upper end of the near term range of 110-112. A firm break above 112 may open up the higher levels of 112.80 or even 113.40. From a larger perspective, the price action in the coming 5-10 days may be contained in the broader range of 11.50-114.00 with no major direction.
Pound (1.2968) is still lacking the bullish momentum. The chances of a fresh high above 1.3050 can't be ruled out but a without a break above 1.3100 soon, it may be very difficult for the currency to sustain the higher levels. Immediate support comes at 1.2950 and 1.2900.
Aussie (0.7451) hit a high of 0.7517, rising above the resistance of 0.7500 just for a brief moment before coming down. The key support at this point comes at 0.7430-20 which must hold to keep the chances of another bounce open. In case 0.7420 gives way, a sharp decline to 0.7330-00 can be seen.
Coming to Dollar Rupee (64.55). the rise above 64.67-72 has negated the immediate bearish momentum and the closing at the day high of 64.89 indicates possible testing of 65.10-25, provided the bullish momentum remains intact. The price action near 65.10-25 may determine the next course of action.
INTEREST RATES
The US yields has risen as expected. The 5Yr (1.83%), 10YR (2.28%) and the 30Yr (2.94%) are all up from 1.79%, 2.25% and 2.91% respectively. The yields could continue to move up in the near term.
The Japan-US (2.23%) has bounced from support near v2.17% and while that holds, we could expect a rise in the yield spread as well as Dollar-Yen.
The German-US 10 Yr (-1.87%) and German-US 2Yr (-2.00%) have fallen sharply pulling down Euro also to levels below 1.12. The 10Yr yield spread has come off from resistance and while that holds, some downward correction is possible in the near term.
EUR/CHF Daily Outlook
Daily Pivots: (S1) 1.0897; (P) 1.0920; (R1) 1.0936; More...
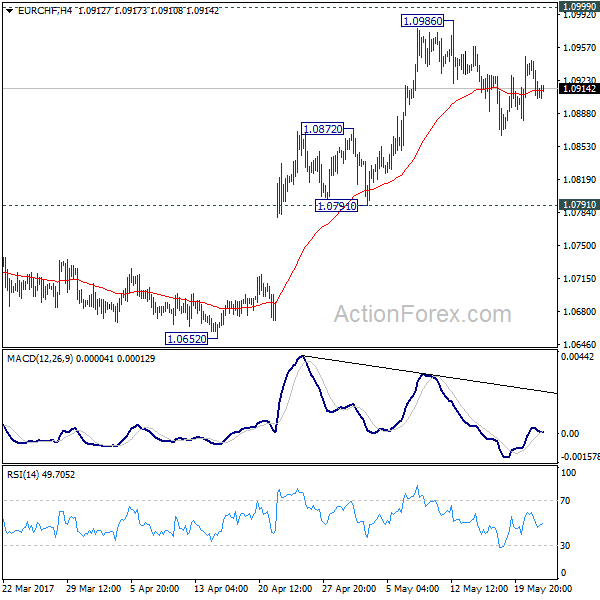
Intraday bias in EUR/CHF remains neutral as consolidation from 1.0986 is still in progress. Deeper fall could be seen but downside is expected to be contained by 1.0791/0872 support zone to bring rise resumption. As noted before, the consolidative pattern from 1.1198 should be completed. Firm break of 1.0999 resistance will pave the way for a retest on 1.1198 high.
In the bigger picture, the price actions from 1.1198 are seen as a corrective move. Current strong rebound is raising the chance that it's completed after defending 38.2% retracement of 0.9771 to 1.1198 at 1.0653. Decisive break of 1.0999 resistance will target a test on 1.1198 high. For now, this will be the preferred case as long as 1.0791 support holds.