Sample Category Title
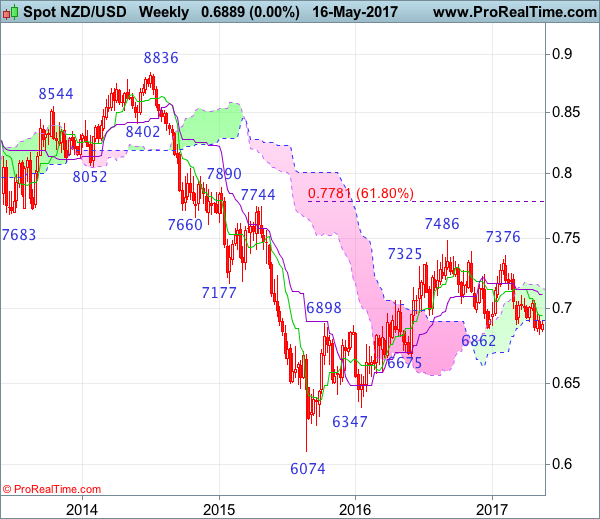
NZD/USD Candlesticks and Ichimoku Analysis
Weekly
• Last Candlesticks pattern: Shooting star
• Time of formation: 5 Sep 2016
• Trend bias: Down
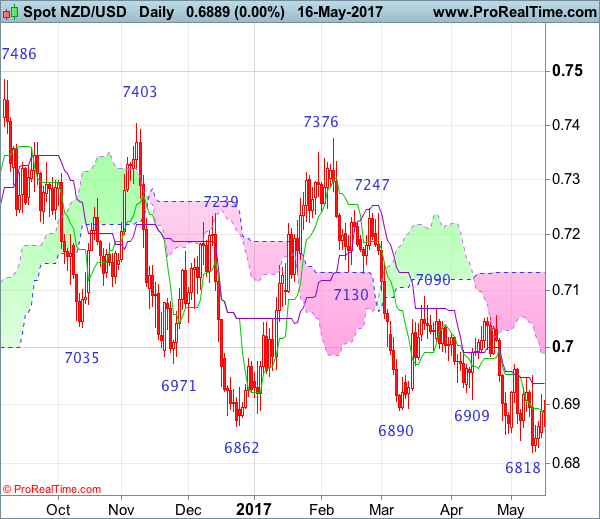
Daily
• Last Candlesticks pattern: Hammer
• Time of formation: 14 Mar 2017
• Trend bias: Near term up
NZD/USD – 0.6974
Although kiwi fell briefly to 0.6818 support, lack of follow through selling on break of previous support at 0.6839 and the subsequent recovery suggest consolidation above this level would be seen and test of the Kijun-Sen (now at 0.6937) is likely, however, a daily close above resistance at 0.6969 is needed to signal a temporary low is formed, bring retracement of recent decline to 0.7015 and possibly towards resistance at 0.7056. Having said that, price should falter below resistance at 0.7090 and kiwi shall head south again from there later this month.
On the downside, below said support at 0.6818 would signal the fall from 0.7486 is still in progress and may extend weakness to 0.6780 (50% Fibonacci retracement of 0.6074-0.7486), however, near term oversold condition should prevent sharp fall below 0.6700 and reckon 0.6675 support would hold from here, price should stay well above 0.6610-15 (61.8% Fibonacci retracement), risk from there is seen for a rebound to take place later.
Recommendation: Stand aside for this week.
On the weekly chart, although kiwi has remained under pressure, initial upside risk has increased for a corrective bounce to the Tenkan-Sen (now at 0.6954) and possibly towards 0.7000, however, reckon upside would be limited to 0.7045-50 and price should falter below the Kijun-Sen (now at 0.7097), bring another decline later. Below support at 0.6818 would extend recent fall from 0.7486 top to 0.6780 (50% Fibonacci retracement of 0.6074-0.7486) and later towards previous chart support at 0.6675, however, reckon downside would be limited to 0.6610-15 (61.8% Fibonacci retracement) and price should stay above 0.6550, bring rebound later.
On the upside, whilst recovery to the Tenkan-Sen (now at 0.6954) and possibly 0.7000 cannot be ruled out, reckon upside would be limited to 0.7045-50 and the Kijun-Sen (now at 0.7097) should hold, bring another decline later. A weekly close above the Kijun-Sen would suggest a temporary low is formed, bring retracement of recent decline to the upper Kumo (now at 0.7141) and then towards 0.7200 but resistance at 0.7247 should remain intact and price should falter well below 0.7300, bring further broad consolidation later.
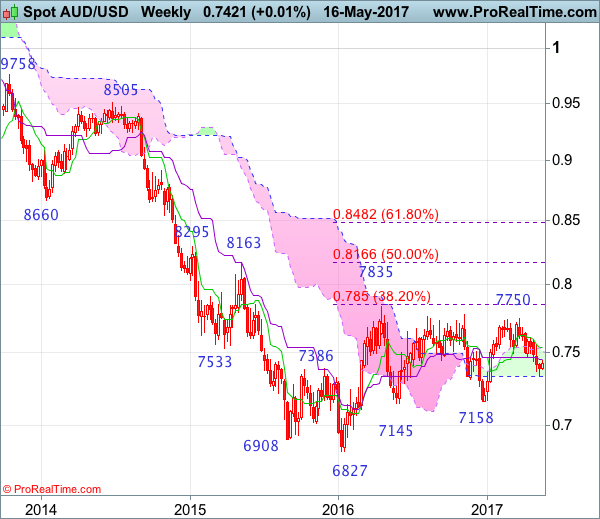
AUD/USD Candlesticks and Ichimoku Analysis
Weekly
• Last Candlesticks pattern: Shooting doji
• Time of formation: 20 Feb 2017
• Trend bias: Sideways
Daily
• Last Candlesticks pattern: Bearish engulfing pattern
• Time of formation: 21 Mar 2017
• Trend bias: Near term down
As aussie has recovered after falling to 0.7329 last week, suggesting consolidation above this level would be seen, however, reckon upside would be limited to the Kijun-Sen (now at 0.7470) and bring another decline later, below said support at 0.7329 would extend recent fall from 0.7750 top to 0.7300 and possibly 0.7250-60 but oversold condition should prevent sharp fall below 0.7200-10 and price should stay well above indicated previous chart support at 0.7158, bring rebound later.
On the upside, whilst marginal recovery from here cannot be ruled out, reckon the Kijun-Sen (now at 0.7470) would limit upside and bring another decline later. A daily close above 0.7490-00 would defer and risk a stronger rebound towards resistance at 0.7556 but break there is needed to signal a temporary low is formed instead, bring a stronger rebound to 0.7590-95 but price should falter below resistance at 0.7611 and bring another decline later.
Recommendation: Hold short entered at 0.7440 for 0.7240 with stop above 0.7540.
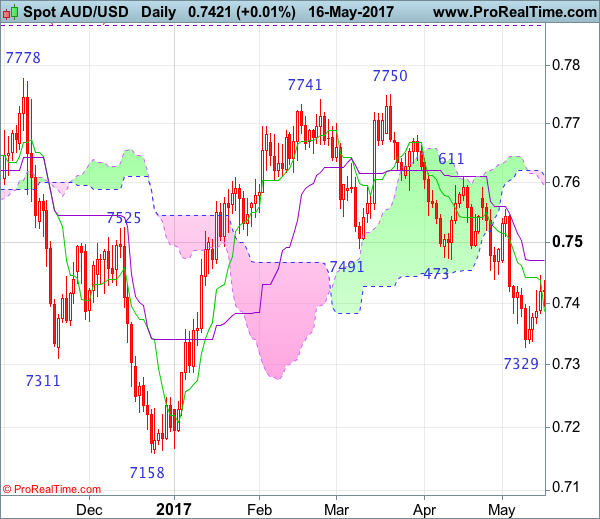
On the weekly chart, although aussie recovered after falling to 0.7329 last week and minor consolidation above this level would be seen, reckon upside would be limited to previous support at 0.7473 and bring another decline later, below said support at 0.7329 would extend recent decline from 0.7750 to 0.7290-00 and possibly towards 0.7230, however, downside should be limited to 0.7200 and price should stay well above previous support at 0.7158, risk from there is seen for a rebound to take place later.
On the upside, expect recovery to be limited to the Kijun-Sen (now at 0.7454) and bring another decline later. Above the upper Kumo (now at 0.7508) would risk test of the Tenkan-Sen (now at 0.7540 but only break of indicated resistance at 0.7556 would abort and signal low is formed instead, risk a stronger rebound to 0.7590-95, however, break of resistance at 0.7611 is needed to add credence to this view, bring further gain towards resistance at 0.7680, having said that, price should falter below said resistance at 0.7750.
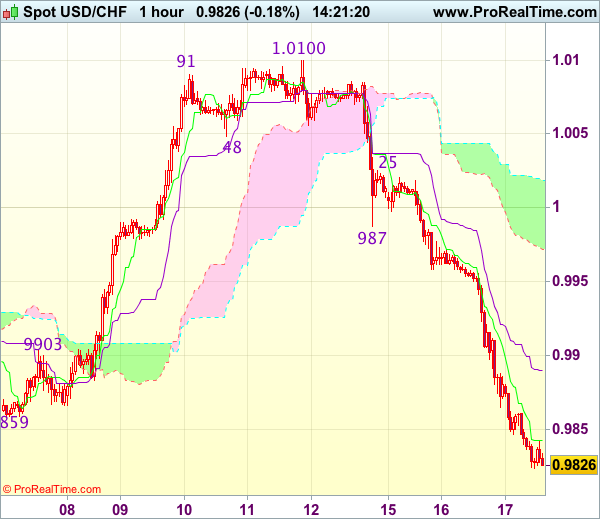
Trade Idea : USD/CHF – Sell at 0.9910
USD/CHF - 0.9835
Most recent candlesticks pattern : N/A
Trend : Near term down
Tenkan-Sen level : 0.9841
Kijun-Sen level : 0.9888
Ichimoku cloud top : 1.0018
Ichimoku cloud bottom : 0.9972
Original strategy :
Sell at 0.9960, Target: 0.9860, Stop: 0.9995
Position : -
Target : -
Stop : -
New strategy :
Sell at 0.9910, Target: 0.9800, Stop: 0.9945
Position : -
Target : -
Stop : -
As dollar has continued heading south and broke below indicated previous support at 0.9859, confirming our bearish view that the decline from 1.0108 top is still in progress, hence bearishness remains for this move to extend further weakness to 0.9813 support, break there would bring subsequent fall to 0.9790-95 (1.236 times projection of 1.0108-0.9859 measuring from 1.0100), however near term oversold condition should limit downside to 0.9770 and reckon 0.9745-50 would hold on first testing.
In view of this, would not chase would be prudent to sell dollar on recovery as 0.9910-20 should limit upside. Above 0.9940-45 would defer but only break of previous support at 0.9987 would abort and signal a temporary low is formed instead, risk rebound to 1.0000 and then test of 1.0025 resistance.
UK’s Consumer Price Inflation Jumped To A Nearly 4-Year High Level In April
For the 24 hours to 23:00 GMT, the GBP rose 0.13% against the USD and closed at 1.2915, after data indicated that annual inflation in the UK soared in April.
Data showed that Britain's consumer price index (CPI) advanced more-than-anticipated by 2.7% on an annual basis in April, surging to its highest level since September 2013, thus posing a serious challenge to the nation's households as wages fail to keep pace with rising inflation. Markets expected the CPI to rise 2.6%, after registering a gain of 2.3% in the previous month.
In the Asian session, at GMT0300, the pair is trading at 1.2917, with the GBP trading slightly higher against the USD from yesterday's close.
The pair is expected to find support at 1.2868, and a fall through could take it to the next support level of 1.2820. The pair is expected to find its first resistance at 1.2961, and a rise through could take it to the next resistance level of 1.3006.
Going ahead, UK's ILO unemployment rate for the three months to March along with average earnings data, scheduled to release in a few hours, will keep investors on their toes.
The currency pair is trading above its 20 Hr and 50 Hr moving averages.

Japan’s Industrial Production Declined In March
For the 24 hours to 23:00 GMT, the USD declined 0.72% against the JPY and closed at 112.81.
On the macro front, Japan's machinery orders rose 1.4% MoM in March, compared to a rise of 1.5% in the prior month, while markets anticipated for an advance of 2.5%.
In the Asian session, at GMT0300, the pair is trading at 112.46, with the USD trading 0.31% lower from yesterday's close.
Earlier in the session, data showed that the nation's final industrial production dropped 1.9% in March. In the prior month, industrial production had climbed 3.2%, while the preliminary figures had indicated a drop of 2.1%.
The pair is expected to find support at 111.99, and a fall through could take it to the next support level of 111.52. The pair is expected to find its first resistance at 113.33, and a rise through could take it to the next resistance level of 114.2.
Going ahead, investors will keep a close watch on Japan's flash 1Q GDP data, set to release overnight.
The currency pair is trading below its 20 Hr and 50 Hr moving averages.

Swiss Franc Trading On A Stronger Footing This Morning
For the 24 hours to 23:00 GMT, the USD declined 1.1% against the CHF and closed at 0.9848.
In the Asian session, at GMT0300, the pair is trading at 0.9828, with the USD trading 0.2% lower against the CHF from yesterday’s close.
The pair is expected to find support at 0.9782, and a fall through could take it to the next support level of 0.9736. The pair is expected to find its first resistance at 0.9915, and a rise through could take it to the next resistance level of 1.0002.
Amid a lack of economic releases in Switzerland today, investors will look forward to global macroeconomic news for further direction.
The currency pair is trading below its 20 Hr and 50 Hr moving averages.

Loonie Trading Higher In The Asian Session
For the 24 hours to 23:00 GMT, the USD declined 0.15% against the CAD and closed at 1.3609.
In the Asian session, at GMT0300, the pair is trading at 1.3603, with the USD trading marginally lower against the CAD from yesterday’s close.
The pair is expected to find support at 1.3564, and a fall through could take it to the next support level of 1.3524. The pair is expected to find its first resistance at 1.3651, and a rise through could take it to the next resistance level of 1.3698.
The currency pair is showing convergence with its 20 Hr moving average and trading below its 50 Hr moving average.

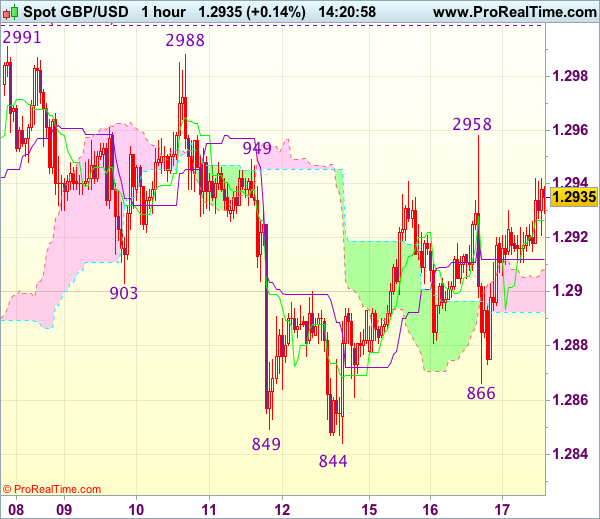
Trade Idea : GBP/USD – Hold short entered at 1.2925
GBP/USD - 1.2915
Most recent candlesticks pattern : N/A
Trend : Near term up
Tenkan-Sen level : 1.2925
Kijun-Sen level : 1.2912
Ichimoku cloud top : 1.2908
Ichimoku cloud bottom : 1.2893
Original strategy :
Sold at 1.2925, Target: 1.2825, Stop: 1.2960
Position : - Short at 1.2925
Target : - 1.2825
Stop : - 1.2960
New strategy :
Hold short entered at 1.2925, Target: 1.2825, Stop: 1.2960
Position : - Short at 1.2925
Target : - 1.2825
Stop : - 1.2960
Although cable found support at 1.2866 yesterday and rebounded on dollar’s broad-based weakness, outlook remains consolidative and as long as indicated resistance at 1.2958 holds, prospect of another retreat remains, below said support at 1.2866 would signal the rebound from 1.2844 has ended, however, break there is needed to extend the fall from 1.2991 to 1.2831 support, then 1.2805.
In view of this, we are holding on to our short position entered at 1.2925. A firm break above said resistance at 1.2958 would abort and suggest correction from 1.2991 has ended at 1.2844, bring further gain to 1.2970 but said resistance at 1.2991 should hold on first testing. Only a break of 1.2999-00 (1.236 times projection of 1.2109-1.2616 measuring from 1.2365 and psychological resistance) would revive bullishness and bring resumption of upmove for headway to 1.3040-50 first.
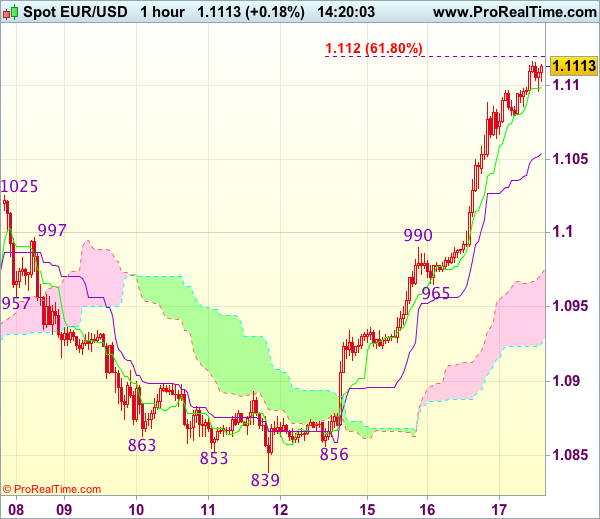
Trade Idea : EUR/USD – Buy at 1.1050
EUR/USD - 1.1118
Most recent candlesticks pattern : N/A
Trend : Near term up
Tenkan-Sen level : 1.1100
Kijun-Sen level : 1.1055
Ichimoku cloud top : 1.0972
Ichimoku cloud bottom : 1.0925
Original strategy :
Buy at 1.1020, Target: 1.1120, Stop: 1.0985
Position : -
Target : -
Stop : -
New strategy :
Buy at 1.1050, Target: 1.1150, Stop: 1.1015
Position : -
Target : -
Stop : -
As the single currency has continued moving higher after recent rally above previous resistance at 1.1025 (now support), adding credence to our view that recent upmove has resumed and bullishness remains for further gain to 1.1150-55 (1.236 times projection of 1.0839-1.0990 measuring from 1.0965), then towards 1.1175-80, however, near term overbought condition should limit upside and reckon 1.1205-10 (1.618 times projection) would hold from here, bring retreat later.
In view of this, would not chase this rise here and we are looking to buy euro on pullback as 1.1050 should limit downside. Below previous resistance at 1.1025 (now support) would defer and suggest top is possibly formed instead, risk test of another previous resistance at 1.0990 first.
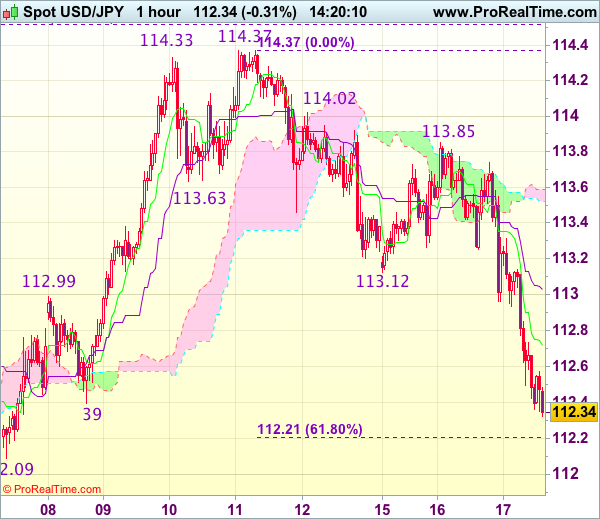
Trade Idea : USD/JPY – Stand aside
USD/JPY - 112.34
Most recent candlesticks pattern : N/A
Trend : Near term down
Tenkan-Sen level : 112.72
Kijun-Sen level : 113.03
Ichimoku cloud top : 113.59
Ichimoku cloud bottom : 113.52
Original strategy :
Bought at 112.70, stopped at 112.35
Position : - Long at 112.70
Target : -
Stop : - 112.35
New strategy :
Stand aside
Position : -
Target : -
Stop : -
As the decline from 114.37 has accelerated on dollar’s broad-based weakness, dampening our near term bullishness and downside risk remains for the selloff from 114.37 top to extend weakness to previous support at 112.09, break there would bring subsequent decline to 111.75-80 but near term oversold condition should limit downside to another previous support at 111.43, bring rebound later.
In view of this, would not chase this fall here and would be prudent to stand aside in the meantime. Above the Tenkan-Sen (now at 112.71) would bring recovery to the Kijun-Sen (now at 113.03) but previous support at 113.12 should limit upside and price should falter well below 113.40-50, bring another decline later.