Sample Category Title
EUR/CHF Daily Outlook
Daily Pivots: (S1) 1.0911; (P) 1.0935; (R1) 1.0948; More...
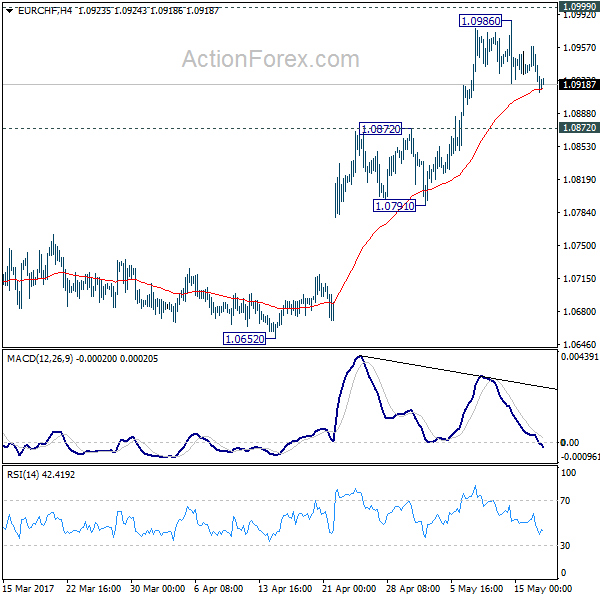
EUR/CHF's consolidation from 1.0986 is still in progress and intraday bias remains neutral. Deeper pull back cannot be ruled out. But downside should be contained by 1.0791/0872 support zone to bring rise resumption. Outlook is unchanged that corrective pattern from 1.1198 has completed already after defending 1.0653 fibonacci level. Firm break of 1.0999 resistance will pave the way for a retest on 1.1198 high.
In the bigger picture, the price actions from 1.1198 are seen as a corrective move. Current strong rebound is raising the chance that it's completed after defending 38.2% retracement of 0.9771 to 1.1198 at 1.0653. Decisive break of 1.0999 resistance will target a test on 1.1198 high. For now, this will be the preferred case as long as 1.0791 support holds.
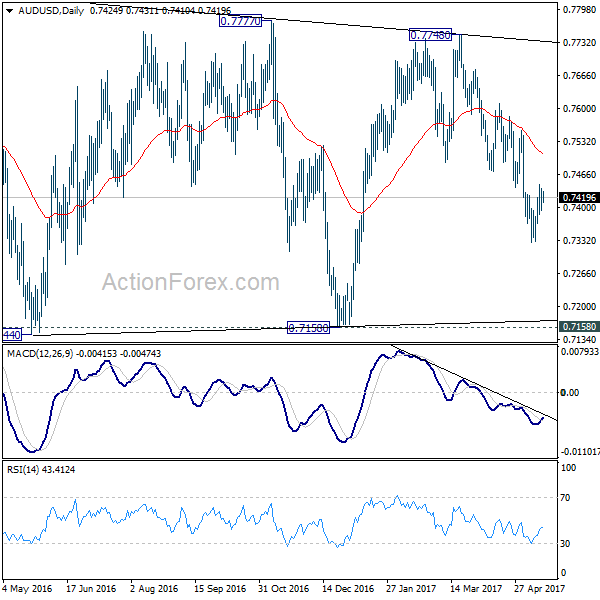
AUD/USD Daily Outlook
Daily Pivots: (S1) 0.7402; (P) 0.7419; (R1) 0.7444; More...
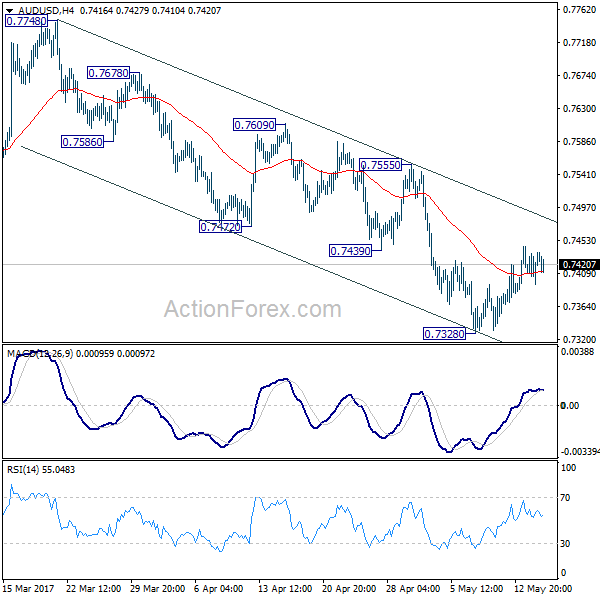
No change in AUD/USD's outlook. Corrective rise from 0.7328 is still in progress and could extend higher. But upside should be limited below 0.7555 resistance to bring fall resumption. Below 0.7382 will target 0.7144/7158 support zone. However, there is no clear sign of larger down trend resumption yet. Hence we'll be cautious on strong support from 0.7144/58 to contain downside and bring rebound. On the upside, firm break of 0.7555 will argue that fall from 0.7748 is completed and turn bias back to the upside.
In the bigger picture, we're still treating price actions from 0.6826 low as a correction pattern. And, as long as 38.2% retracement of 0.9504 to 0.6826 at 0.7849 holds, long term down trend from 1.1079 is expected to resume sooner or later. Break of 0.6826 low will target 0.6008 key support level. However, firm break of 0.7849 will indicate that rise from 0.6826 is developing into a medium term rebound, rather than a sideway pattern. In such case, stronger rise should be seen to 55 month EMA (now at 0.8115) and above.
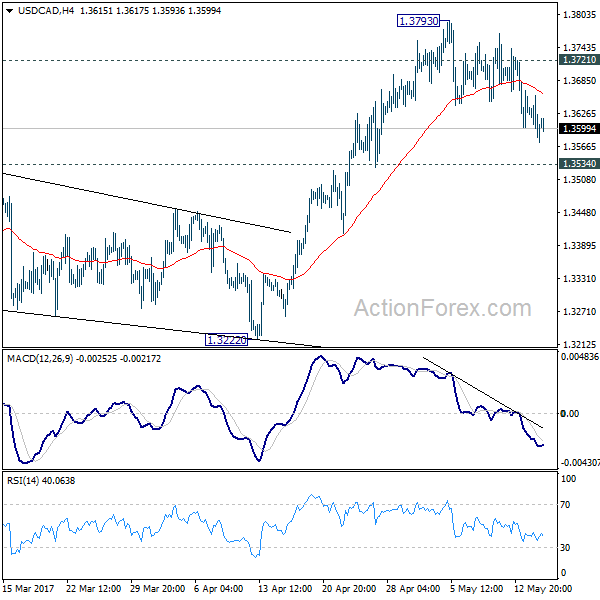
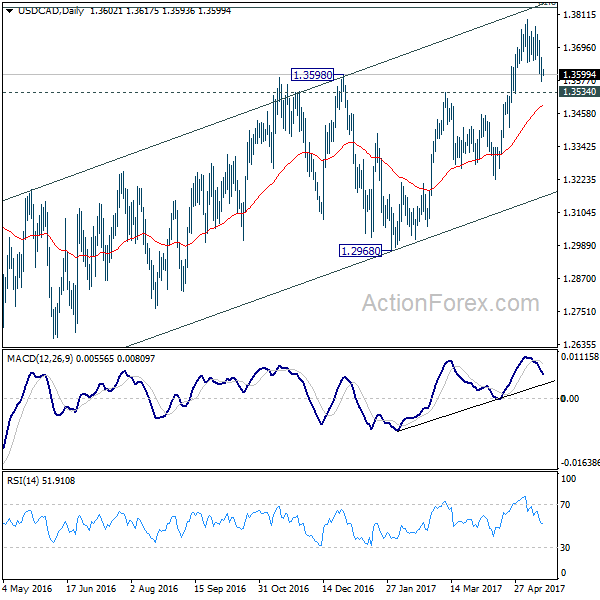
USD/CAD Daily Outlook
Daily Pivots: (S1) 1.3566; (P) 1.3612; (R1) 1.3650; More....
USD/CAD's fall from 1.3793 is still in progress and intraday bias stays cautiously on the downside for 1.3534 resistance turned support. Break there should confirm completion of the rise from 1.2968 and target 1.3222 support next. On the upside, above 1.3721 will turn bias back to the upside and target 1.3793 and above. However, as noted before, choppy rise from 1.2460 is seen as a corrective move. In case of an extension, upside should be limited by 1.3838 fibonacci level to bring reversal.
In the bigger picture, price actions from 1.4689 medium term top are seen as a correction pattern. The first leg has completed at 1.2460. Rise from 1.2460 is seen as the second leg and would end at around 61.8% retracement of 1.4689 to 1.2460 at 1.3838. Break of 1.3222 should indicate the start of the third leg while further break of 1.2968 should confirm. Nonetheless, sustained trading above 1.3838 would pave the way to retest 1.4689 high.
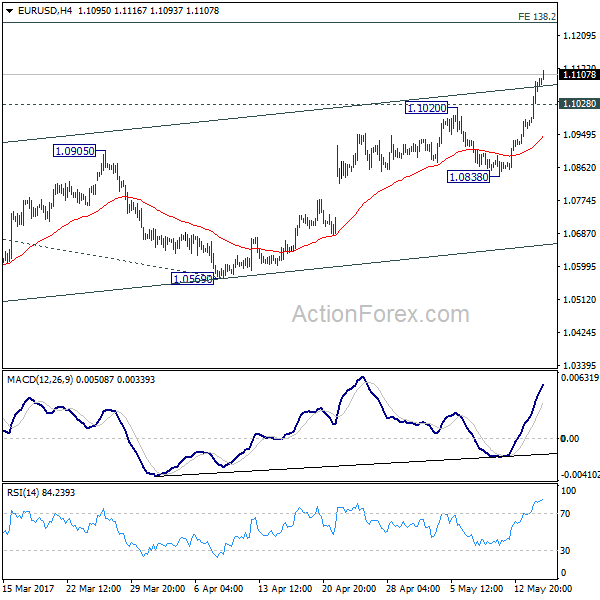
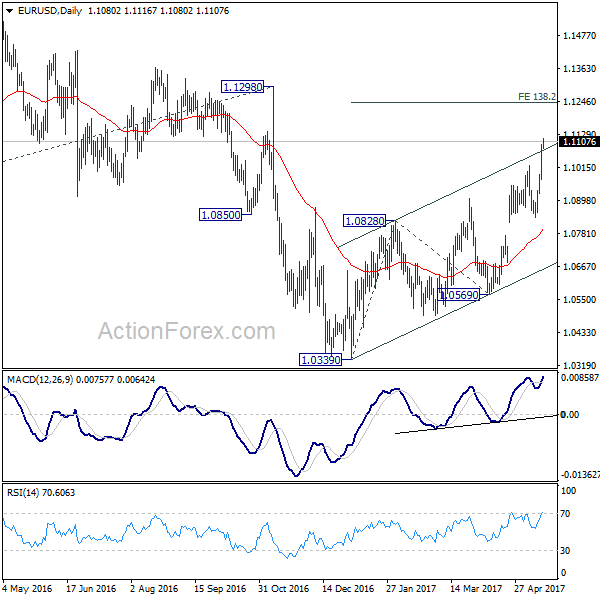
EUR/USD Daily Outlook
Daily Pivots: (S1) 1.1003; (P) 1.1050 (R1) 1.1128; More....
EUR/USD's rally continues today and reaches as high as 1.1116 so far. Break of upper channel resistance suggests upside acceleration. Intraday bias remains on the downside for 38.2% projection of 1.0339 to 1.0828 from 1.0569 at 1.1245, which is close to 1.1298 key resistance. For now, rise from 1.0339 is still viewed as a corrective move. Hence we'd expect strong resistance below 1.1245/98 to limit upside and bring reversal. On the downside, below 1.10289 minor support will turn bias neutral and bring consolidation. But break of 1.0838 support is needed to indicate short term topping. Otherwise, further rise will remain in favor.
In the bigger picture, as long as 1.1298 key resistance holds, whole down trend from 1.6039 (2008 high) is still expected to continue. Break of 1.0339 low will send EUR/USD through parity to 61.8% projection of 1.3993 to 1.0461 from 1.1298 at 0.9115. However, considering bullish convergence condition in weekly MACD, break of 1.1298 will indicate long term reversal.
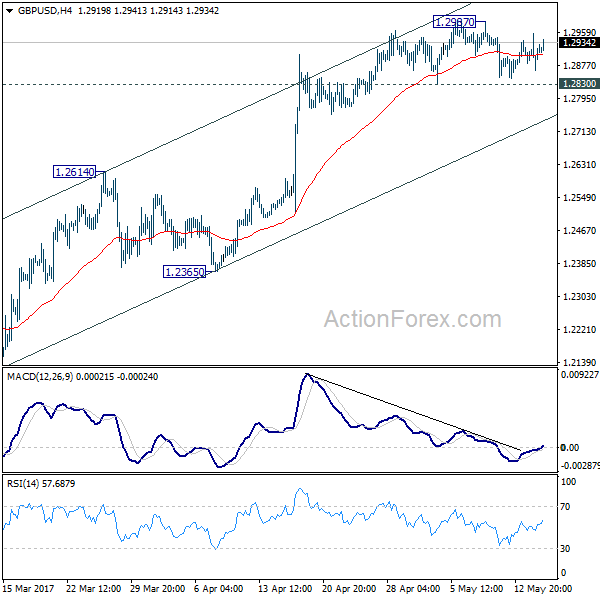
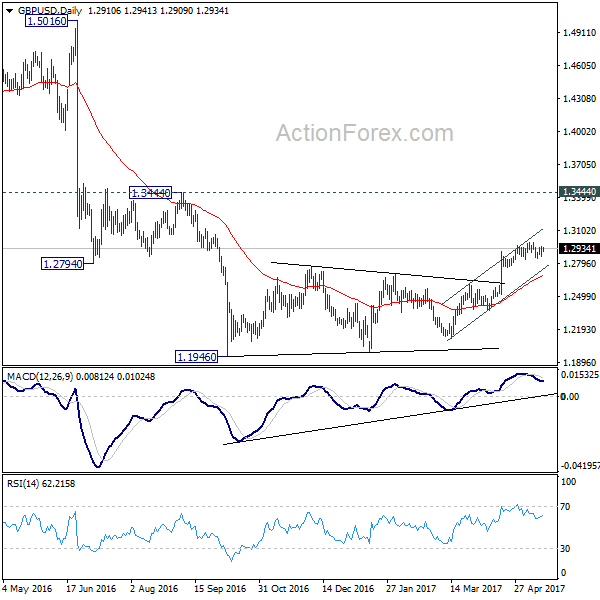
GBP/USD Daily Outlook
Daily Pivots: (S1) 1.2870; (P) 1.2913; (R1) 1.2962; More...
Intraday bias in GBP/USD remains neutral for the moment as it's staying in range of 1.2830/2987. With 1.2830 minor support intact, another rise cannot be ruled out. However, price actions from 1.1946 are viewed as a corrective pattern. Hence, in case of another rise, we'd start to look for reversal signal again above 1.2987. Meanwhile, break of 1.2830 will indicate short term topping. In such case, intraday bias is turned back to the downside for 1.2614 resistance turned support first.
In the bigger picture, fall from 1.7190 is seen as part of the down trend from 2.1161. There is no sign of medium term reversal yet. Sustained trading below 61.8% projection of 2.1161 to 1.3503 from 1.7190 at 1.2457 will target 100% projection at 0.9532. Overall, break of 1.3444 resistance is needed to confirm medium term bottoming. Otherwise, outlook will remain bearish.
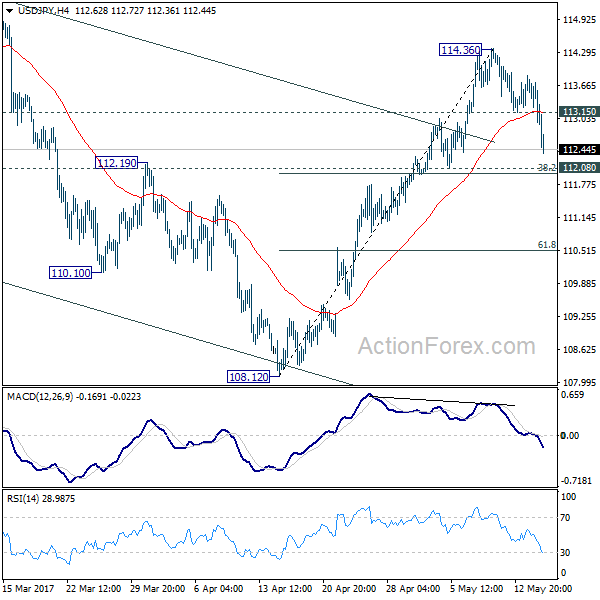
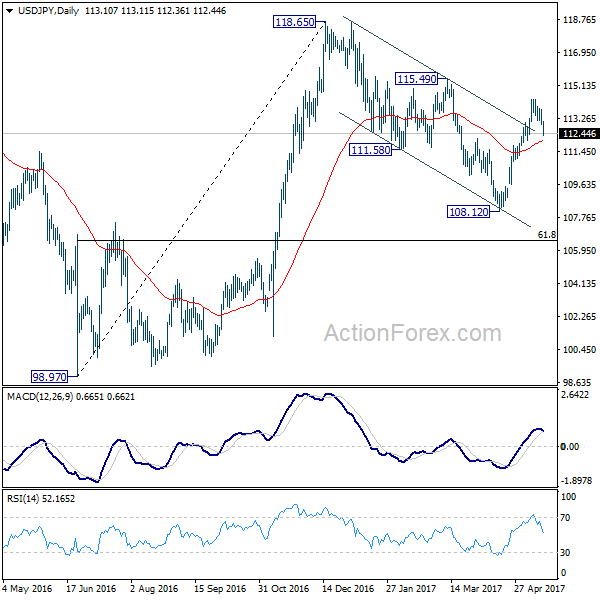
USD/JPY Daily Outlook
Daily Pivots: (S1) 112.76; (P) 113.27; (R1) 113.62; More...
USD/JPY's fall from 114.36 extends lower today but there is no change in the outlook so far. Such decline is seen as a correction. We'd expect downside to be contained by 112.08 cluster support (38.2% retracement of 108.12 to 114.36 at 111.97) and bring rally resumption. Above 113.15 minor resistance will turn bias back to the upside for 114.36 resistance first. Also, corrective fall from 118.65 is completed with three wave down to 108.12. Above 114.36 will target 115.49 resistance first. Break there should resume whole rise from 98.97 to 125.85 high.
In the bigger picture, price actions from 125.85 high are seen as a corrective pattern. It's uncertain whether it's completed yet. But in case of another fall, downside should be contained by 61.8% retracement of 75.56 to 125.85 at 94.77 to bring rebound. Meanwhile, break of 115.49 resistance will extend the rise from 98.97 to retest 125.85. Overall, rise from 75.56 is still expected to resume later after the correction from 125.85 completes.
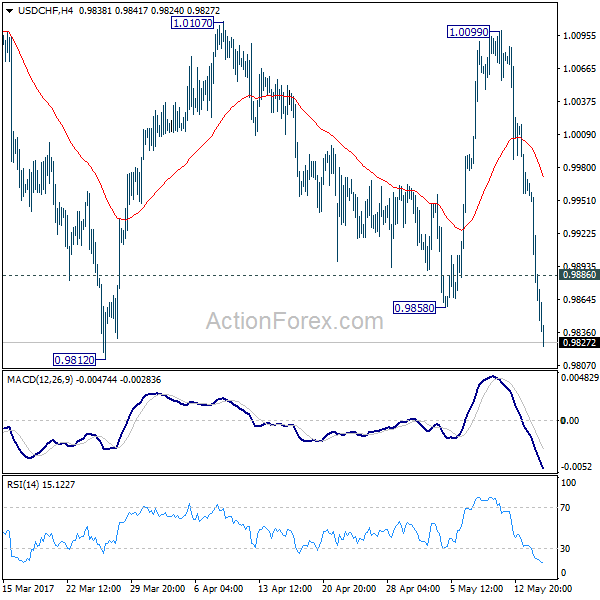
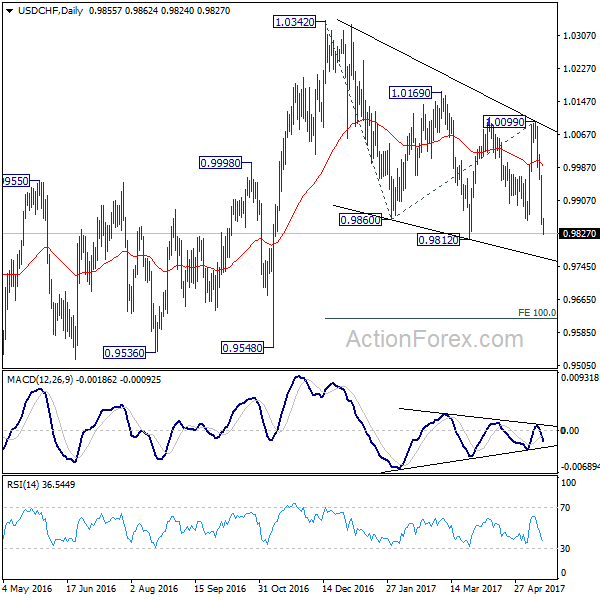
USD/CHF Daily Outlook
Daily Pivots: (S1) 0.9942; (P) 0.9980; (R1) 1.0003; More.....
USD/CHF's decline continues today and reaches as low as 0.9824 so far. The break of 0.9858 support now argues that whole corrective fall from 1.0342 is resuming. Intraday bias stays on the downside for 0.9812 first. Break would target lower trend line support (now at 0.9762) and below. At this point, such decline from 1.0342 is still seen as a correction. Therefore, we'd expect strong support above 100% projection of 1.0342 to 0.9860 from 1.0099 at 0.9617 to contain downside. On the upside, above 0.9886 minor resistance will turn bias neutral and bring recovery before staging another fall.
In the bigger picture, USD/CHF is bounded in medium term range of 0.9443/1.0342 for the moment. Consolidative trading would likely continue and medium term outlook remains neutral. Break of 1.0342 key resistance is needed to confirm underlying bullish momentum in the pair. Meanwhile, downside attempts should be contained by 0.9443 key support level.
Euro Rally Extends, Dollar Weighed Down by Trump’s Political Turmoil
Euro's rally extends in the Asian session today as optimism continues. In particular, EUR/USD reaches new six months high as the greenback is troubled by political turmoil in Washington. But we'd like to point out that Dollar's weakness is mainly centered against Euro, Swiss Franc and Yen. GBP/USD is held steady in range below 1.2987 resistance. While Aussie and Canadian are helped by commodity and energy prices, movements in AUD/USD and USD/CAD since last week are so far corrective looking. We'd continue to view the current theme in the markets as Euro strength rather than Dollar weakness.
Nonetheless, investors are getting more impatient on US President Donald Trump's ability to implement his economic policies as he is constantly fighting fire at other fronts. The latest one started as the unexpected firing of James Comey as FBI director just ahead of Trump's meeting with Russian officials. It's reported on Monday that Trump shared highly classified intelligence information with Russia. Then yesterday, it's reported that Trump intervened in FBI and asked Comey to drop investigation on National security adviser Michael Flynn. Also it's reported that Trump has asked Comey to imprison journalists whole publish classified information.
Atlanta Fed GDPNow forecasts 4.1% growth in Q2
While the markets are getting doubtful on the economy, Atlanta Fed is having another view. According to the GDPNow forecasting model of the Atlanta Fed, US GDP is projected to grow 4.1% in Q2. That's an upward revision from May 12's forecast of 3.6%. In particular, real residential investment growth was revised to 8.3%, up from 6.0%, after yesterday's housing data. Forecast on retail final sales to private domestic purchases was also revised to 3.6%, up from 3.3%, after release of industrial production data. Released yesterday from US, housing starts dropped to 1.17m annualized rate in April while building permits dropped to 1.23m. Industrial production, however, rose 1.0% and beat expectation of 0.4%.
Markets happy with political developments in Europe
Markets responded positively to French President Emmanuel Macron's appointment of Edouard Philippe as the new prime minister. The role of PM is seen to be a key factor in helping Macron form a parliamentary majority in the election in June. And center-right Republican Philippe would likely boost support from the political right for Macron. The meeting between Macron and German Chancellor Angela Merkel also showed their common ground in preserving European unity. Both of them pledged to draw up a "common road map" for Europe. Merkel is also open to change in the European treaties, showing openness to the reform that Macron would like to push for.
ECB Coeure talked down surge in bond yields
ECB Executive Board member Benoit Coeure said yesterday that the central bank is not concerned with recent surge in Eurozone bond yields. There are talks that the 60bps jump in German bund since September could bother the central bank, which is trying to keep borrowing costs low. But Coeure said that "the recent measurable increase in long-term yields has not affected our monetary policy stance: current financial conditions remain highly supportive of the ongoing recovery." And, "we don't want to over-interpret any uptick or downtick that we observe, but rather accept as a fact that some volatility is natural and healthy for the market to function."
Also, Coeure noted that "only around a quarter of the change in yields (since September) reflect changes in the expected future policy path." And, "expectations regarding our monetary policy have, on balance, had a stabilizing effect on yields, according to our analysis."
On the data front...
New Zealand PPI inputs rose 0.8% qoq in Q1, above expectation of 0.7% qoq. PPI outputs rose 1.4% qoq, above expectation of 1.1% qoq. Australia wage cost index rose 0.5% in qoq, meeting consensus. Westpac consumer sentiment dropped -1.1%. Japan machine orders rose 1.4% mom in March.
UK job data will be the main focus in European session while Eurozone release April CPI final. Canada will release manufacturing shipments later in the day.
USD/CHF Daily Outlook
Daily Pivots: (S1) 0.9942; (P) 0.9980; (R1) 1.0003; More.....
USD/CHF's decline continues today and reaches as low as 0.9824 so far. The break of 0.9858 support now argues that whole corrective fall from 1.0342 is resuming. Intraday bias stays on the downside for 0.9812 first. Break would target lower trend line support (now at 0.9762) and below. At this point, such decline from 1.0342 is still seen as a correction. Therefore, we'd expect strong support above 100% projection of 1.0342 to 0.9860 from 1.0099 at 0.9617 to contain downside. On the upside, above 0.9886 minor resistance will turn bias neutral and bring recovery before staging another fall.
In the bigger picture, USD/CHF is bounded in medium term range of 0.9443/1.0342 for the moment. Consolidative trading would likely continue and medium term outlook remains neutral. Break of 1.0342 key resistance is needed to confirm underlying bullish momentum in the pair. Meanwhile, downside attempts should be contained by 0.9443 key support level.
Economic Indicators Update
| GMT | Ccy | Events | Actual | Forecast | Previous | Revised |
|---|---|---|---|---|---|---|
| 22:45 | NZD | PPI Inputs Q/Q Q1 | 0.80% | 0.70% | 1.00% | |
| 22:45 | NZD | PPI Outputs Q/Q Q1 | 1.40% | 1.10% | 1.50% | |
| 23:50 | JPY | Machine Orders M/M Mar | 1.40% | 2.50% | 1.50% | |
| 0:30 | AUD | Westpac Consumer Confidence May | -1.10% | -0.70% | ||
| 1:30 | AUD | Wage Cost Index Q/Q Q1 | 0.50% | 0.50% | 0.50% | |
| 4:30 | JPY | Industrial Production M/M Mar F | -2.10% | -2.10% | ||
| 8:30 | GBP | Jobless Claims Change Apr | 25.5K | |||
| 8:30 | GBP | Claimant Count Rate Apr | 2.20% | |||
| 8:30 | GBP | Average Weekly Earnings 3M/Y Mar | 2.40% | 2.30% | ||
| 8:30 | GBP | ILO Unemployment Rate 3M Mar | 4.70% | 4.70% | ||
| 9:00 | EUR | Eurozone CPI M/M Apr | 0.40% | 0.80% | ||
| 9:00 | EUR | Eurozone CPI Y/Y Apr F | 1.90% | 1.50% | ||
| 9:00 | EUR | Eurozone CPI - Core Y/Y Apr F | 1.20% | 1.20% | ||
| 12:30 | CAD | Manufacturing Shipments M/M Mar | 0.40% | -0.20% | ||
| 14:30 | USD | Crude Oil Inventories | -2.5M | -5.2M |
Market Morning Briefing: The US Yields Have Come Down
STOCKS
Dow (20979.75, -0.01%) came off slightly yesterday but is almost stable near current levels. Resistance near 21170-21200 continues to hold for now; some sideways consolidation is possible in the coming sessions.
Dax (12804.53, -0.02%) is trying to inch up towards 13000 but movements have been very small and steady in the past few sessions. A small dip to 12700 is possible in the near term with an upside limited to 13000 just now.
Shanghai (3110.40, -0.08%) bounced back sharply to levels above 3100 and while the levels near 3020 holds, we could see a rise towards 3170 by next week. A fall below 3020 could be negated just now.
Nikkei (19822.19, -0.49%) continues to remain sideways in the 20010-19700 region and could remain so for some more sessions. No major movement expected unless we see a break on either side of the mentioned range.
Nifty (9512.25, +0.71%) has broken all near term resistances and is set to rise towards 10000 soon. While above 9500, first resistance could come near 9700-9800 levels. Near to medium term looks strongly bullish.
COMMODITIES
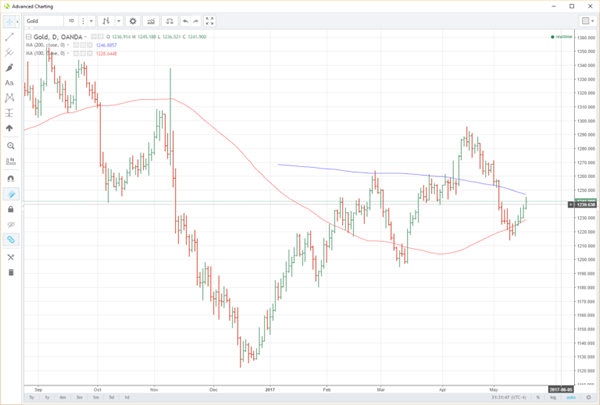
Bullion has shown some strength due to the recent weakness in Dollar Index. Gold (1242) is up from level near 1231 and could head towards 1250-60 in the coming sessions whereas Silver (16.87) has bounced back from support near 16.10 and could remain above 16.90 in the near term.
Copper (2.54) has found resistance at 2.54 levels. Only above 2.55, higher resistances of 2.65-72 can come into consideration. In the medium term 2.44 are going to be a strong support now but a close below that could open up 2.40-35 levels as well.
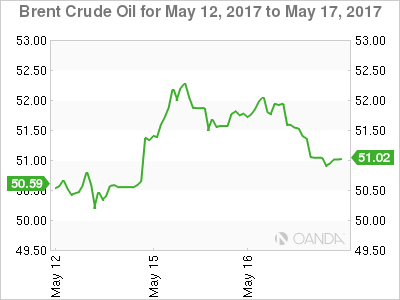
Today's U.S weekly crude oil inventory is important to see as it is able to trigger sharp movement in the energy market. Brent (51.20) is hovering around its pivot at 51 levels of the entire range of 49.54 to 52.80, whereas WTI (48.20) is trading between 47.15 - 49.20 levels. If the actual outcome of today's inventory could not exceed the expectation (-2.5 MB), we could see a dip towards 50 in Brent and 48 in WTI in the near term. Else they could consolidate in their respective trading ranges in the coming sessions. The overall bias will remain bearish while Brent and WTI are trading below 53 and 51 levels respectively.
FOREX
Risk aversion due to increasing political risk in US continues to weaken the Dollar and now strengthens Yen along with Euro.
The Euro (1.1115) rise above 1.10 has weakened Dollar Index (98.82) considerably just as expected. The political risk taking the centre stage in the global markets has triggered bulk selling of Dollar and the break below 98.00 may push it to 96.50-00 in the next few days.
Euro (1.1115) has surged above 1.10 as expected and is very close to our initial target/resistance of 1.1130. A sustained move above 1.1130 may take it higher towards 1.1200-1.300 in the coming days.
Dollar Yen (112.45) has corrected due to the global risk aversion at this point and may test our support of 112.00 soon. For the scenario of sideways consolidation in 112-115 to come true, the support of 112.00 must hold. Otherwise, the decline may extend to 111.00-110.00.
Pound (1.2930) remains unchanged in its range of 1.2800-1.3000 in line with expectations. Repeat - with the medium term trend still up, a retest of the interim support of 1.2840-30 by the end of the week may trigger a sharp bounce.
Aussie (0.7423) is in a small contraction phase in the narrow range of 0.7380-0.7450 which may resolved in the next couple of sessions but as discussed previously, the larger downtrend is expected to resume for the target/support of 0.7300-0.7290 as the weakness persists below 0.7500 which may cap any short covering rally.
Dollar Rupee (64.08) mostly traded in the narrow range of 64.05-15 yesterday and may spend the next couple of sessions in 64.00-25 with a downside bias.
INTEREST RATES
The US yields have come down and could move lower in the next few sessions to test near term support levels. Overall the medium term looks bearish.
The German yields have risen slightly and is likely to break above immediate resistances in the next few sessions. The 10-2Yr (1.0920%) is bouncing from levels near 1.04% and could move up towards 1.15% in the near term.
The 10 Yr GOI yields (6.8422%) bounced back instead of continuing to fall further. The current bounce could take it back towards 6.88% before coming off towards 6.80-6.75% again in the longer run.
The German-US 10Yr (-1.87%) has risen sharply along with the rise in Euro to levels above 1.10. The yield spread could now be headed towards -1.75% while there is scope for further Euro strength in the near term.
The UK-US 10Yr (-1.18%) is trying to break above the long term resistance coming from May'16 and in case the yield spread manages to break and move higher in the near term, we could expect some more room on the upside for Pound in the near term.
Oil Spills As Gold And Silver Shine
Oil hits a crude inventory wall overnight as gold basks in the afterglow of White House induced safe-haven buying.
OIL
The vulnerability of OPEC's 'forward guidance' rhetoric was starkly revealed late in the New York session, with both Brent and WTI falling some two percent following as the U.S. API Crude Inventories showed an unexpected increase of 882,000 barrels. It highlights the hope versus reality disconnect in the markets at the moment, with oil vulnerable to short-term headlines despite the feel-good assurances on the extension of OPEC/Non-OPEC production cuts.
The street will now look to tonight's U.S. Department of Energy's official crude inventory numbers for guidance. A drawdown of some 2.5 million barrels is expected and an unexpectedly smaller deficit (or a surplus) tonight may see more freshly minted long oil positions come under pressure.
Brent spot trades at 50.90 this morning having closed back below its pivotal 200-day moving average at 51.30 and first resistance. Above here, resistance sits at 52.15 and 52.40. Support is nearby at 50.50 and then 50.00.
WTI spot trades at 48.00 having failed twice at its 200-day moving average at 49.00 which is now pivotal daily resistance with 50.00 behind. Support lies initially at 47.20 with a break opening a possible move to the 46.00 area from a technical perspective.
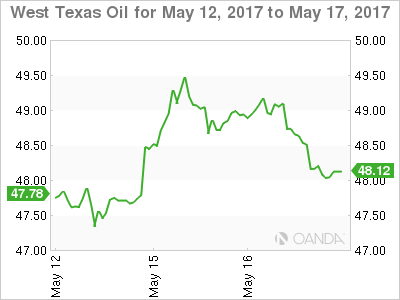
Overall it would appear that both crude contracts have reached the topside limits of OPEC chatter as oil fails to find support even from a weaker U.S. Dollar in general and that the street will need something more concrete to maintain any sustainable upward momentum.
PRECIOUS METALS
Gold rose ten dollars to a high of 1245 overnight as a weaker U.S. Dollar across the board, and continuing political ructions in Washington D.C. led to safe-haven buying. The noise from the capital aside, U.S. data continues its recent trend of softer than expected which has resulted in lower rates across the curve giving more impetus to the yellow metal.
From a technical perspective, gold is trading very constructively, with the rally from the 1214 lows in early May followed by a solid week of higher lows each day. Gold now rests just below its pivotal 200-day moving average at 1247 with a daily close above implying more potential upside to the next resistance at 1260.
Below, the 100-day moving average has held each dip in gold over the last week and today lies at 1228.65. Interim support sits above at 1236.00.
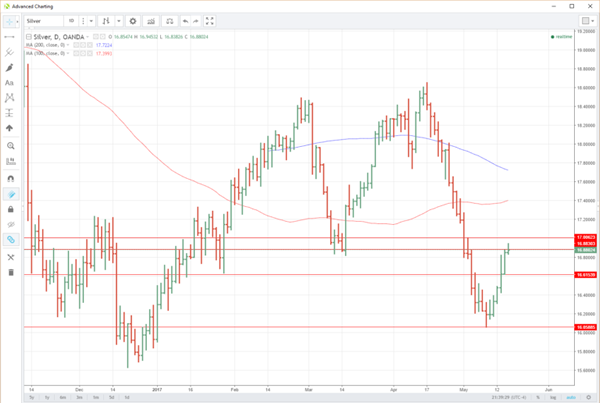
Silver rallied 25 cents to resistance at 16.8830 in the New York session marking its 5th higher lower and higher close in a row. Like gold, silver is benefiting from daily headlines from the White House and softer U.S. data undermining the big dollar strength.
Silver has started constructively in the Asia session, trading as high as 16.9450 initially before profit taking occurred. Initial resistance is not far away in the 17.0000/17.0060 region with a daily close above opening the possibility of a technical move to the 100-day moving average at 17.4000.
Support appears at 16.6150 the overnight low and then 16.4000.