Sample Category Title
Trade Idea Update: USD/CHF – Sell at 0.9960
USD/CHF - 0.9883
Original strategy :
Sell at 1.0020, Target: 0.9920, Stop: 1.0055
Position : -
Target : -
Stop : -
New strategy :
Sell at 0.9960, Target: 0.9860, Stop: 0.9995
Position : -
Target : -
Stop : -
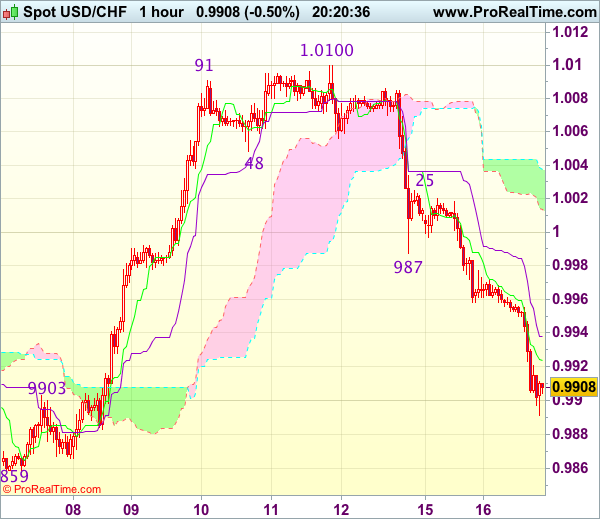
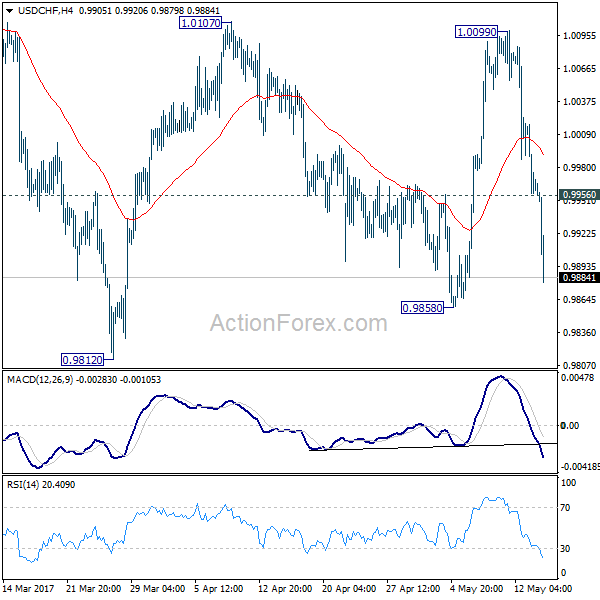
As dollar’s decline has gathered momentum, adding credence to our view that the selloff from 1.0100 top is still in progress, hence further weakness towards support at 0.9859 would be seen, however, break there is needed to retain bearishness and bring subsequent fall towards previous chart support at 0.9813 which is likely to hold from here due to near term oversold condition.
In view of this, would not chase would be prudent to sell dollar on recovery as 0.9960 should limit upside. Above previous support at 0.9987 would defer and suggest an intra-day low is formed instead, risk a stronger rebound to 1.0025 but price should falter below 1.0045-50, bring another decline later.
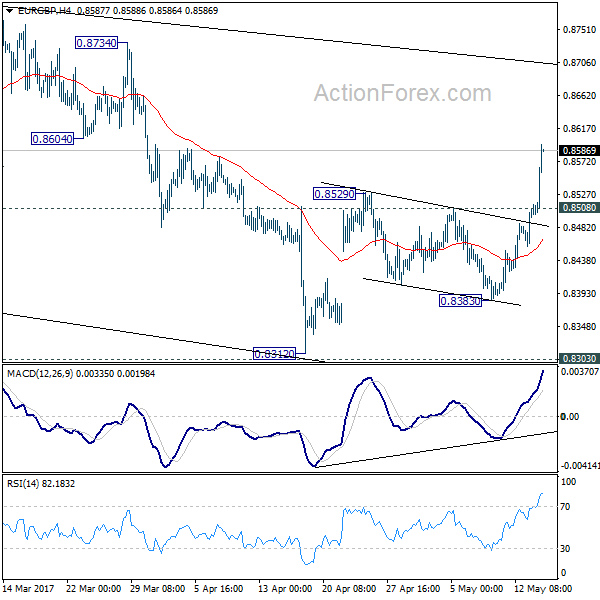
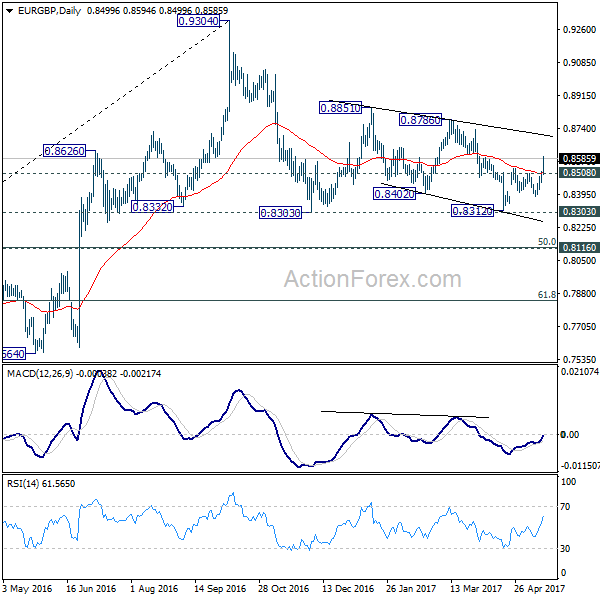
EUR/GBP Mid-Day Outlook
Daily Pivots: (S1) 0.8473; (P) 0.8494; (R1) 0.8530; More...
EUR/GBP's rally extends to as high as 0.8594 so far and intraday bias remains on the upside. Current rise should target 0.8786 resistance next. Overall, price actions 0.9304 are viewed as a medium term corrective pattern that is extending. As EUR/GBP has just defended 0.8303 resistance. Break of 0.8786 could bring a retest on 0.9304 high. On the downside, below 0.8508 minor support will turn bias neutral and bring retreat first.
In the bigger picture, price actions from 0.9304 are viewed as a medium term corrective pattern. In case of deeper fall, we'd expect strong support from 0.8116 cluster support (50% retracement of 0.6935 to 0.9304 at 0.8120) to contain downside. Rise from 0.6935 (2015 low) will resume at a later stage to 0.9799 (2008 high). However, sustained break of 0.8116 could bring deeper decline to next key support level at 0.7564 before the correction completes.
USD/CHF Mid-Day Outlook
Daily Pivots: (S1) 0.9942; (P) 0.9980; (R1) 1.0003; More.....
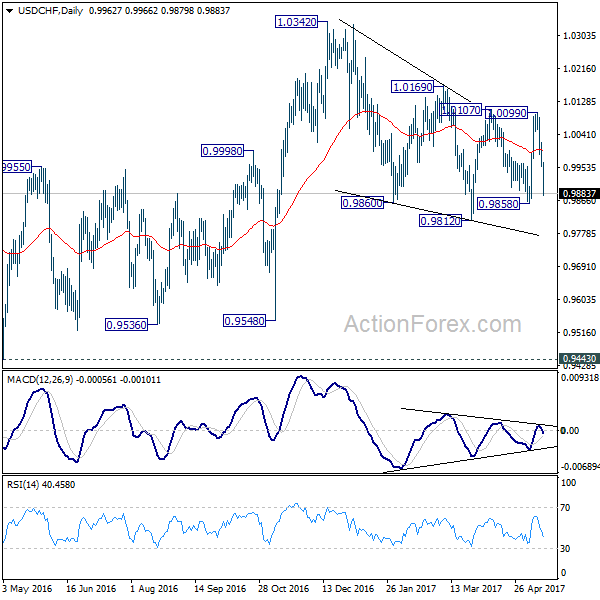
USD/CHF drops further to as low as 0.9879 so far. Intraday bias remains on down the downside for 0.9858 support first. Break there extend the corrective fall from 1.0342 through 0.9812 low. On the upside, above 0.9956 minor resistance will turn intraday bias neutral first.
In the bigger picture, we're still maintaining that firm break of 1.0342 key resistance is needed to confirm underlying bullish momentum in the pair. However, the corrective nature of the fall from 1.0342 is starting to give the medium term outlook a bullish favor. Hence, instead of looking for topping signal around 1.0342, we'd now pay closer attention to upside acceleration as USD/CHF approaches this level again.
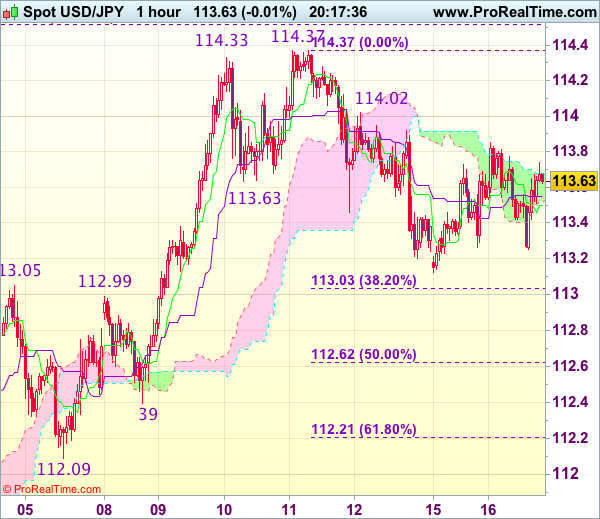
USD/JPY Mid-Day Outlook
Daily Pivots: (S1) 113.32; (P) 113.58; (R1) 114.06; More...
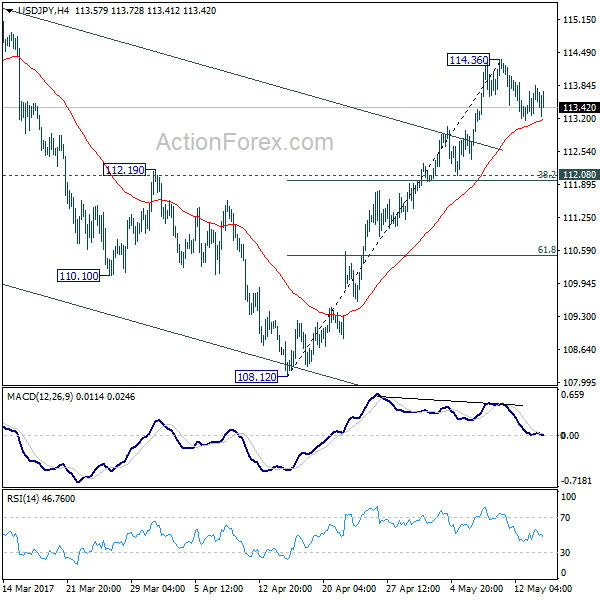
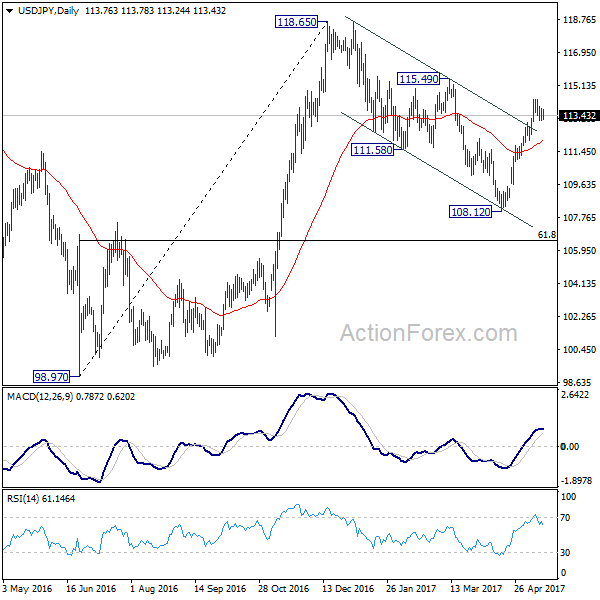
USD/JPY is still bounded in consolidation from 114.36 and intraday bias stays neutral first. Deeper retreat could be seen. But in such case, downside should be contained by 112.08 cluster support (38.2% retracement of 108.12 to 114.36 at 111.97) and bring rally resumption. We're holding on to the view that corrective fall from 118.65 is completed with three wave down to 108.12. Above 114.36 will target 115.49 resistance first. Break there should resume whole rise from 98.97 to 125.85 high.
In the bigger picture, price actions from 125.85 high are seen as a corrective pattern. It's uncertain whether it's completed yet. But in case of another fall, downside should be contained by 61.8% retracement of 75.56 to 125.85 at 94.77 to bring rebound. Meanwhile, break of 115.49 resistance will extend the rise from 98.97 to retest 125.85. Overall, rise from 75.56 is still expected to resume later after the correction from 125.85 completes.
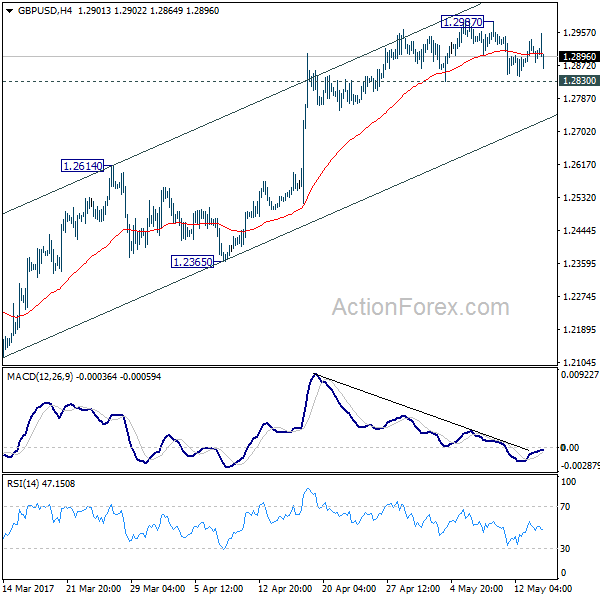
GBP/USD Mid-Day Outlook
Daily Pivots: (S1) 1.2867; (P) 1.2903; (R1) 1.2930; More...
No change in GBP/USD's outlook as it's still bounded in tight range below 1.2987 temporary top. Intraday bias remains neutral for the moment. With 1.2830 minor support intact, another rise could be seen. However, price actions from 1.1946 are viewed as a corrective pattern. Hence, in case of another rise, we'd start to look for reversal signal again above 1.2987. Meanwhile, break of 1.2830 will indicate short term topping. In such case, intraday bias is turned back to the downside for 1.2614 resistance turned support first.
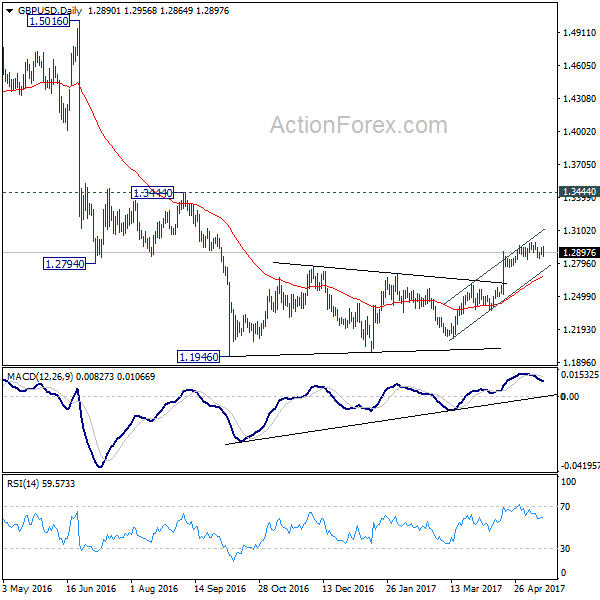
In the bigger picture, fall from 1.7190 is seen as part of the down trend from 2.1161. There is no sign of medium term reversal yet. Sustained trading below 61.8% projection of 2.1161 to 1.3503 from 1.7190 at 1.2457 will target 100% projection at 0.9532. Overall, break of 1.3444 resistance is needed to confirm medium term bottoming. Otherwise, outlook will remain bearish.
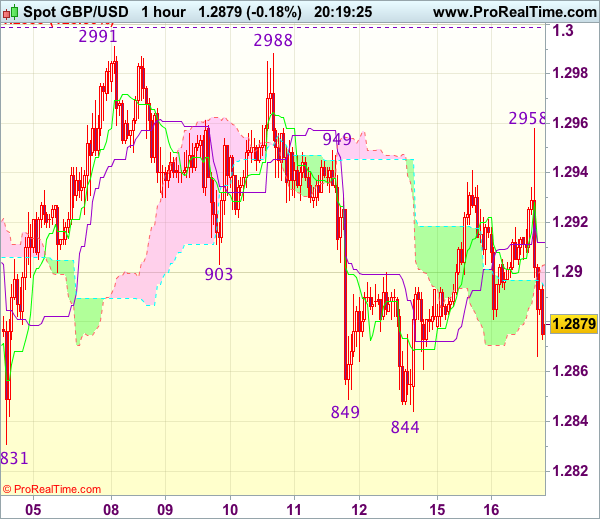
Trade Idea : GBP/USD – Sell at 1.2925
GBP/USD - 1.2890
New strategy :
Sell at 1.2925, Target: 1.2825, Stop: 1.2960
Position : -
Target : -
Stop : -
Although cable staged a brief bounce to 1.2958, lack of follow through buying on break of previous resistance at 1.2949 and the subsequent retreat has retained our view that further choppy trading below recent high at 1.2991 would take place and mild downside bias remains for another fall to 1.2844 support, however, break there is needed to extend the fall from 1.2991 to 1.2831 support, then 1.2805.
In view of this, we are looking to sell cable on recovery as 1.2940 should limit upside. A firm break above said intra-day resistance at 1.2958 would abort and suggest correction from 1.2991 has ended at 1.2844, bring further gain to 1.2970 but said resistance at 1.2991 should hold on first testing. Only a break of 1.2999-00 (1.236 times projection of 1.2109-1.2616 measuring from 1.2365 and psychological resistance) would revive bullishness and bring resumption of upmove for headway to 1.3040-50 first.
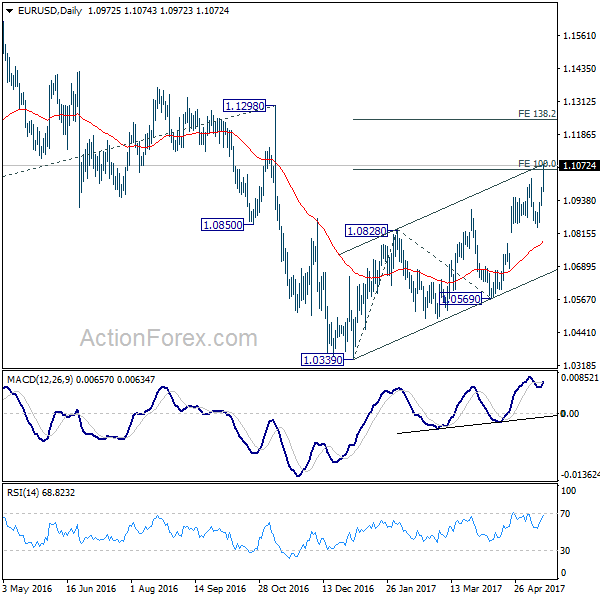
EUR/USD Mid-Day Outlook
Daily Pivots: (S1) 1.0934; (P) 1.0962 (R1) 1.1001; More....
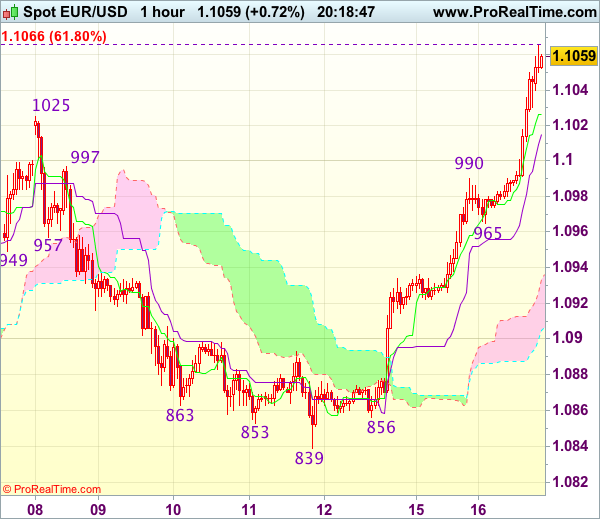
EUR/USD's rally accelerates further today and reaches as high as 1.1073 so far. 100% projection of 1.0339 to 1.0828 from 1.0569 at 1.1058 is already met and there is no sign of topping. Intraday bias remains on the upside for 138.2% projection at 1.1245, which is close to 1.1298 key resistance. For now, rise from 1.0339 is still viewed as a corrective move. Hence we'd expect strong resistance below 1.1245/98 to limit upside and bring reversal. On the downside, below 1.0989 minor support will turn bias neutral and bring consolidation. But break of 1.0838 support is needed to indicate short term topping. Otherwise, further rise will remain in favor.
In the bigger picture, as long as 1.1298 key resistance holds, whole down trend from 1.6039 (2008 high) is still expected to continue. Break of 1.0339 low will send EUR/USD through parity to 61.8% projection of 1.3993 to 1.0461 from 1.1298 at 0.9115. However, considering bullish convergence condition in weekly MACD, break of 1.1298 will indicate long term reversal.

Euro Extends Rally as Data Affirms Optimism, Pound Unmoved by CPI
Euro surges broadly today as incoming economic data is in line with a brighter outlook. Some attributes that rally in Euro to the weakness of Dollar. The greenback is pressured as the markets are getting more doubtful on US President Donald Trump's implementation of economic policy. For the very least, he is constantly being distracted by other issues, like currently, his firing of former FBI director James Comey and subsequent sharing of sensitive information with Russia. But it should be noted that both DAX and FTSE 100 hits record highs today. The moves in the markets are clearly driven by optimism. Released in US, housing starts dropped to 1.17m annualized rate in April while building permits dropped to 1.23m.
German ZEW jumps to near two year high
German ZEW economic sentiment rose to 20.6 in May, up from 19.5 but missed expectation of 22.0. Current situation gauge rose to 83.9, up from 80.1 and beat expectation of 82.0. The reading is, nonetheless, highest since July 2015. Eurozone ZEW economic sentiment jumped sharply to 35.1, up from 26.3, beat expectation of 29.1. ZEW President Achim Wambach noted that "the latest figures on gross domestic product confirm that the German economy is in good shape." And, "the prospects for the euro zone as a whole are gradually improving, further strengthening the economic environment for German exports." Also from Eurozone, GDP rose 0.5% qoq in Q1, in line with preliminary reading, same as prior quarter's growth. Eurozone trade surplus widened to EUR 23.1b in March, up from EUR 18.8b. Italy GDP rose 0.2% qoq in Q1.
Pound unmoved by strong inflation reading
UK CPI accelerated to 2.7% yoy in April, up from March's 2.3% yoy and beat expectation of 2.6% yoy. Core CPI rose to 2.4% yoy, up from 1.8% yoy and beat expectation of 2.3% yoy. RPI accelerated to 3.5% yoy, up from 3.1%, beat expectation of 3.4%. PPI input slowed to 16.6% yoy, PPI output was unchanged at 3.6% yoy, PPI output core rose to 2.8% yoy. Sterling received little boost from the set of stronger than expected inflation data. It's argued that the pop in the CPI readings is expected and could instead drag down price growth in the coming months. On the other hand, FTSE surges to new record high today and stays firm around 7500 handle after the release.
BoJ Kuroda: Quite sure of enough tools for stimulus exit
BoJ Governor Haruhiko Kuroda said today that there "may be some challenging issues" regarding stimulus exit. But he is "quite sure" that the central bank has "enough tools" to manage it. Meanwhile, Kuroda also noted there will be lessons to be learned from Fed's normalization of policies. But he also emphasized that "the United States is the United States, Japan is Japan. At this stage, we're not exiting." There has been much concern over the size of BoJ's balance, in particular that it already took out 40% of JGBs in the markets. But Kuroda talked it down and said there are still 60% left and there won't be "any constraint" to the so called Yield Curve Control. Release from Japan, Tertiary industry index dropped -0.2% mom in March.
RBA Minutes: Reiterated concerns on housing and labor
The RBA minutes for the May meeting contained little news but reiterated policymakers' the importance of the property market and the labor market conditions in its policy decision. The stance to leave the monetary policy unchanged was obviously due to the perceived uncertain outlook in these two areas. As noted in the concluding statement in the minutes, 'the board continued to judge that developments in the labour and housing markets warranted careful monitoring'. More in RBA Reaffirmed Importance Of Housing And Labor Markets On Decision-Making, Defends The Trend Of Rising Part-Time Workers.
EUR/USD Mid-Day Outlook
Daily Pivots: (S1) 1.0934; (P) 1.0962 (R1) 1.1001; More....
EUR/USD's rally accelerates further today and reaches as high as 1.1073 so far. 100% projection of 1.0339 to 1.0828 from 1.0569 at 1.1058 is already met and there is no sign of topping. Intraday bias remains on the upside for 138.2% projection at 1.1245, which is close to 1.1298 key resistance. For now, rise from 1.0339 is still viewed as a corrective move. Hence we'd expect strong resistance below 1.1245/98 to limit upside and bring reversal. On the downside, below 1.0989 minor support will turn bias neutral and bring consolidation. But break of 1.0838 support is needed to indicate short term topping. Otherwise, further rise will remain in favor.
In the bigger picture, as long as 1.1298 key resistance holds, whole down trend from 1.6039 (2008 high) is still expected to continue. Break of 1.0339 low will send EUR/USD through parity to 61.8% projection of 1.3993 to 1.0461 from 1.1298 at 0.9115. However, considering bullish convergence condition in weekly MACD, break of 1.1298 will indicate long term reversal.
Economic Indicators Update
| GMT | Ccy | Events | Actual | Forecast | Previous | Revised |
|---|---|---|---|---|---|---|
| 01:30 | AUD | RBA Minutes | ||||
| 04:30 | JPY | Tertiary Industry Index M/M Mar | -0.20% | 0.10% | 0.20% | |
| 08:00 | EUR | Italian GDP Q/Q Q1 P | 0.20% | 0.20% | 0.20% | |
| 08:30 | GBP | CPI M/M Apr | 0.50% | 0.40% | 0.40% | |
| 08:30 | GBP | CPI Y/Y Apr | 2.70% | 2.60% | 2.30% | |
| 08:30 | GBP | Core CPI Y/Y Apr | 2.40% | 2.30% | 1.80% | |
| 08:30 | GBP | RPI M/M Apr | 0.50% | 0.40% | 0.30% | |
| 08:30 | GBP | RPI Y/Y Apr | 3.50% | 3.40% | 3.10% | |
| 08:30 | GBP | PPI Input M/M Apr | 0.10% | 0.00% | 0.40% | |
| 08:30 | GBP | PPI Input Y/Y Apr | 16.60% | 17.00% | 17.90% | 17.40% |
| 08:30 | GBP | PPI Output M/M Apr | 0.40% | 0.20% | 0.40% | |
| 08:30 | GBP | PPI Output Y/Y Apr | 3.60% | 3.40% | 3.60% | |
| 08:30 | GBP | PPI Output Core M/M Apr | 0.50% | 0.20% | 0.30% | |
| 08:30 | GBP | PPI Output Core Y/Y Apr | 2.80% | 2.50% | 2.50% | |
| 08:30 | GBP | House Price Index Y/Y Mar | 4.10% | 5.30% | 5.80% | 5.60% |
| 09:00 | EUR | Eurozone Trade Balance (EUR) Mar | 23.1B | 18.8B | 19.2B | 18.8B |
| 09:00 | EUR | German ZEW (Economic Sentiment) May | 20.6 | 22 | 19.5 | |
| 09:00 | EUR | German ZEW (Current Situation) May | 83.9 | 82 | 80.1 | |
| 09:00 | EUR | Eurozone ZEW (Economic Sentiment) May | 35.1 | 29.1 | 26.3 | |
| 09:00 | EUR | Eurozone GDP Q/Q Q1 P | 0.50% | 0.50% | 0.50% | |
| 12:30 | USD | Housing Starts Apr | 1.17M | 1.26M | 1.22M | 1.20M |
| 12:30 | USD | Building Permits Apr | 1.23M | 1.27M | 1.27M | 1.26M |
| 13:15 | USD | Industrial Production Apr | 0.40% | 0.50% | ||
| 13:15 | USD | Capacity Utilization Apr | 76.30% | 76.10% |
Trade Idea Update: EUR/USD – Buy at 1.1020
EUR/USD - 1.1065
Original strategy :
Sold at 1.1000, stopped at 1.1035
Position : - Short at 1.1000
Target : -
Stop : - 1.1035
New strategy :
Buy at 1.1020, Target: 1.1120, Stop: 1.0985
Position : -
Target : -
Stop : -
Euro has rallied and broke above previous resistance at 1.1025, confirming recent upmove has resumed and further gain to 1.1080 and possibly 1.1100 would be seen, however, near term overbought condition should limit upside to 1.1125-30 and reckon 1.1150 would hold from here, bring retreat later.
In view of this, we are looking to buy euro on pullback as previous resistance at 1.1025 should turn into support and contain euro’s downside, bring another upmove later. Below another previous resistance at 1.0990 would abort and suggest top is possibly formed, bring correction to 1.0965 support first.
Trade Idea Update: USD/JPY – Buy at 112.70
USD/JPY - 113.66
Original strategy :
Buy at 112.70, Target: 113.80, Stop: 112.35
Position : -
Target : -
Stop : -
New strategy :
Buy at 112.70, Target: 113.80, Stop: 112.35
Position : -
Target : -
Stop : -
As the greenback met resistance at 113.85 yesterday and retreated, retaining our view that further consolidation below last week’s high at 114.37 would be seen and pullback to 113.00-05 (38.2% Fibonacci retracement of 110.87-114.37 and previous resistance) cannot be ruled out, however, reckon 112.60-65 (50% Fibonacci retracement of 110.87-114.37) would limit downside and bring rebound later, above 113.85 would bring test of 114.00-05 but break of latter level is needed to signal the pullback from 114.37 has ended, bring retest of this level later.
In view of this, we are inclined to buy dollar on next decline but one should exit on such rebound as 114.37 resistance should cap upside. Below support at 112.39 would risk further weakness to 112.20-25 (61.8% Fibonacci retracement of 110.87-114.37) but still reckon previous support at 112.09 would hold from here.