Sample Category Title
GBP/JPY Bearish Price Action
After featuring AUD/JPY stepping down between support/resistance levels in Monday’s blog, I wanted to continue the Yen theme with a similar setup on GBP/JPY.
First up we have a higher time frame resistance zone on the daily chart which price re-tested and subsequently held:
GBP/JPY Daily:
You can seen just before the Brexit drop back in June 2016, that price also bounced off this zone as it looked like the vote would be a sure thing to the stay side. Just quietly, how good is hindsight!
Secondly, we zoom into an inraday chart with the 15 minute featured here to show how price then stepped between short term levels off the higher time frame resistance level:
GBP/JPY 15 Minute:
That is a textbook intraday bearish trending market where price breaks short term support, retests it as resistance, then continues downward repeating the pattern again and again.
How do you expect price to react now that the swing low has broken? Will the pattern continue?
More Doubts
Equity markets were quiet overnight as another political storm in D.C puts stock markets under a cloud as the fallout advances on allegations that President Trump disclosed highly classified information to the Russian Foreign Minister Lavrov about a planned IS operation. Investors are deeply concerned that all the political noise will morph into economic risk as the political back-fence talk, speculation and dirty laundry could detract from Trump's key agenda, Tax reform
In commodity markets, the energy complex is lower after the US API reports a build of 882,000 barrels in US inventories while Chinese iron ore futures exploded higher 3.75 % overnight and base metal are trading on firmer ground this morning.
Euro
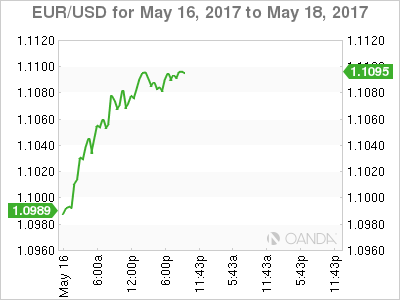
But the real noise was generated in the Forex markets overnight where the EUR ripped higher exploding through some significant levels at 1.1000 and then again 1.1075 as the path for the EURO to trade higher appears considerably clearer and looks poised to fill the total pre-US election gap to 1.1145.So all good things do come to those who wait.
The market has been patiently waiting for this Euro move since the French election, and while equity inflows have been stellar since the election, the catalyst for the move is a further decrease in EU political uncertainty after the positive German election result over the weekend and the weak US data on Friday
Also, it's hard not to take notice the divergence in economic data between EU and US which has the market now banking on convergence in interest rates between the ECB and FED
Japanese Yen
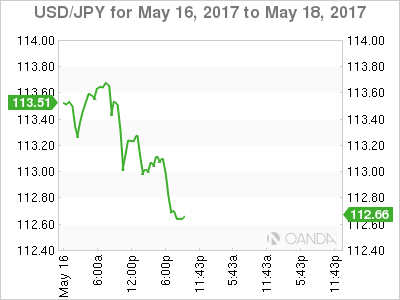
Not to be outdone, the USDJPY had come under immense pressure in early APAC trade as the dollar sags, equity markets sour and investors are getting roiled up by the waves political fallout in DC.
The USDJPY has fallen in an aggressive move taking out the 113 handle and slicing through 100d MA at 112.94.without a pause. While there is no particular headline behind the move, a likely combination of slipping US yields, softer oil prices and heightened political uncertainty in Washington are providing traders with this morning's toxic dollar elixir. While the market is fishing for a base this morning, momentum does suggest there is the potential for a deeper USD selloff.
With the lack of Tier 1 US economic data to support the dollar this week and with Frida's weak CPI and Retail Sales points fresh in traders minds, the dollar is all but defenceless against this current sell-off.
Caution should be exercised reading into US data amidst heavy USD selling. There is a greater propensity for the dealers to be more focused on the softer rather than supportive US dollar data. Case in point, last night traders looked through the stronger than expected US industrial production number while focusing on the weak housing starts data.
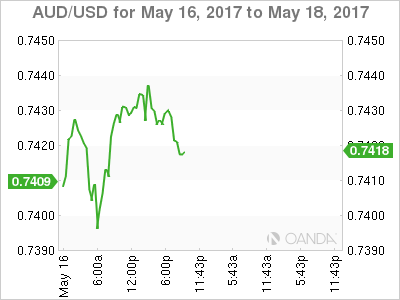
Australian Dollar
The weaker USD and a basing on hard commodity prices are providing the Aussie with a boost this morning, but so far the rallies continue to run into a steady supply of offers, and there has been little in the way of spontaneous short Aussie dollar unwind. It appears the market's preference remains to play AUDUSD from the short side while perhaps viewing a potential economic slowdown in China as a serious drag on the Australian economy and forward-looking commodity prices in general.
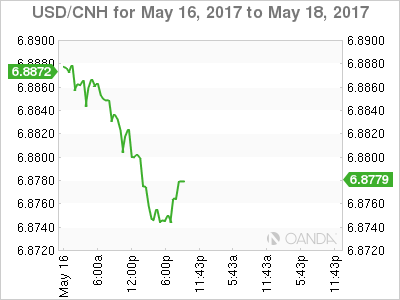
Chinese Yuan
Yesterday fixing which came out much lower than markets expectations left dealers scratching their heads. Volumes soared on the confusion as dealers were trying to read into the policy guidance. But despite the lower fix, there was robust dollar demand and markets were mutually offset. On, the fix itself, some attributed the move as related to "One Belt, One Road" summit and the Pboc attempt to strengthen the Yuan to attract investor flow, but more likely it was little more than a reflection of the latest USD unwind.
After slumbering through CNH trade the past few weeks, the markets will take notice of upcoming fixes to see if there were any policy implications behind yesterday's move
Win For Hard Data But Loss For USD
After months of improved manufacturing PMIs, US industrial production beat estimates. But it didn't provide a lift to the US dollar, which was the laggard on the day, allowing the euro to climb near 1.11. Australian wage data is due next. The matrix below highlights the 12 trades in EURUSD issued by the Premium Insights since December 2015. 9 out of 12 trades were closed at a profit with a net gain of 865 pips assuming clients entered at the higher (lower) end of the long (short) trade.
Industrial production rose 1.0% in April, beating the 0.4% consensus estimate. Manufacturing production and capacity utilization were also better than forecast in a sign that hard data is catching up to soft data, as the Fed expects. Housing starts and building permits fell unexpectedly.
The problem is that it's going to take much more than one report. The US Citi Economic Surprise Index is the G10 laggard and at the lowest in a year.
The dollar suffered for the second day, partly because US housing starts were soft. Technically, the break in EUR/USD above 1.10 is significant, partly helped by Eurozone GDP. That level held early in the month but was blown out Tuesday and extended as high as 1.1097, which is the best since election night in the US.
USD/JPY also fell below 113.00 in the first real retracement in a month. USD/CAD fell to the lowest since April 26 but an unexpected crude storage build in the API report early in Asia is a threat to the loonie.
The Australian dollar has climbed for five consecutive days after falling for the five days before that. The bounce has only been half as large as the drop. That could change at 0130 GMT with the release of the Q1 wage price index. It's forecast to rise 0.5% q/q and 1.9% y/y. Anything within 0.2 pp of those numbers is unlikely to cause ripples.
What could cause waves is any fresh worries from China. The Shanghai Composite has climbed for four days after a month-long swoon.
The Canadian Dollar is Higher after OPEC Cut Extension News and US Political Drama
The US dollar is lower against majors pairs after the news that President Donald Trump shared sensitive information with Russia. The oil price surge has appreciated the Canadian dollar as both political risk and commodity factors are favouring the loonie as the currency is known. The joint announcement on Monday by Russia and Saudi Arabia about a nine month extension to the OPEC production cut has crude prices and the CAD higher ahead of the US weekly inventories. The Canadian dollar had been one of the worst performers of 2017 after the Trump administration had changed the tone on trade with Canada and US shale drillers increasing production.
The US Energy Information Administration (EIA) will release the weekly crude oil inventories on Wednesday, May 17 at 10:30 am EDT. Analysts are forecasting a drawdown of 2.5 million barrels, the sixth decline in a row. The previous week the market was caught off guard with a higher than expected fall of 5.2 million barrels drove prices higher. The oil production cut extension announcements by Saudi Arabia and Russia were backed up today by supporting comments from Iraq, Iran and Kuwait. The Organization of the Petroleum Exporting Countries (OPEC) agreed with other major producers to cut output starting in January. The price of West Texas has rebounded after touching five months lows early in the month. The biggest obstacle to the OPEC cuts has been the ramp up in non-OPEC production. The US has increased its output by about 10 percent since 2016. Demand has remained stagnant with some promising news out of China but not enough to offset the current glut.
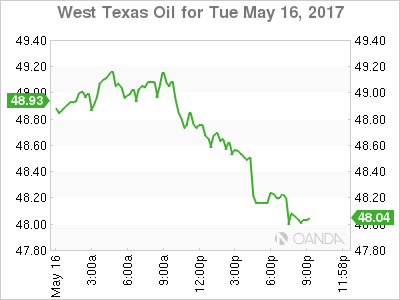
The price of il fell 0.66 percent on Tuesday. The West Texas Intermediate is trading at $48.61 after the International Energy Agency (IEA) printed a report forecasting that even with an extension to the OPEC production cut agreement the crude market would not be near a five year average. Optimism around the cut by the Saudi Arabia led group has waxed and waned as more members have come out in favour of extending the deal, but at the same time producers who did not sign the agreement have ramped up production limiting the overall effect on prices.
The market is expecting the organization to formalize the extension on its meeting on May 25. The price of oil fell in early may as Russia did not quickly pledge support for the extension due to having to meet with all its national producers. Now with Russia fully onboard and other members voicing their support it is just a matter of supply and demand ahead of the US driving season.
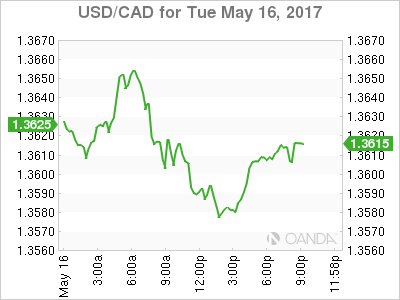
The USD/CAD lost 0.463 percent in the last 24 hours. The currency pair is trading at 1.3576 after the rebound in oil prices boosted the CAD against the USD. US political uncertainty also made it possible for the loonie to reach a monthly high against the greenback. The news that US President Donald Trump may have leaked classified information to Russia has raised question marks about business as usual in Washington and could create another distraction to the much-awaited pro-growth policies. Tax reform and infrastructure spending fuelled the US rally right after Trump was elected, but as there have been few signs of those plans put into action the USD has retreated.
The CAD is highly correlated with the price of oil. Canadian commodity exports account for a sizeable percentage of the country's GDP. The drop in oil prices in the last two years has hit the economy and as a result the currency has depreciated. The OPEC and other producers reduction of crude supplies has stabilized the price of crude, but the United States and Canada have ramped up production to take advantage of higher prices. Lack of global demand has also put downward pressure on energy prices forcing the OPEC to extend the original six month deal well into 2018 if they want prices to rebound.
Market events to watch this week:
Wednesday, May 17
- 4:30 am GBP Average Earnings Index 3m/y
- 8:30 am CAD Manufacturing Sales m/m
- 10:30 am USD Crude Oil Inventories
- 9:30 pm AUD Employment Change
- 9:30 pm AUD Unemployment Rate
Thursday, May 18
- 4:30 am GBP Retail Sales m/m
- 8:30 am USD Unemployment Claims
Friday, May 19
- 8:30 am CAD CPI m/m
- 8:30 am CAD Core Retail Sales m/m
*All times EDT
Gold Continues Rise on Soft Construction Numbers
Gold has posted gains in the Tuesday session. Currently, spot gold is trading at $1237.24 in the North American session. On the release front, construction numbers disappointed, as both Building Permits and Housing Starts were softer than expected.
Weak US numbers since last week have boosted gold prices, as many investors have sold US assets in return for safe-haven assets such as gold. The metal started the month of May with sharp losses, but has managed to stem the downward spiral, posting gains of 1.4% since May 11. Gold has continued to rally on Tuesday, following soft construction data in April. Building Permits dropped to 1.23 million, short of the forecast of 1.26 million. The news wasn't any better from Housing Starts, which slipped to 1.17 million, compared to the estimate of 1.26 million. This marked the smallest number of housing starts since November 2016. Despite the weak numbers, demand for housing remains high, fueled by a labor market that is close to capacity and an unemployment of just 4.4 percent.
Gold has also benefited from the political firestorms in Washington, as the Trump administration continues to lurch from crisis to crisis. President Trump and his aides have preoccupied with damage control, as the White House and Congress remain focused on Comeygate, as the fallout from Trump's dismissal of FBI director James Comey continues. There was more bad news for President Trump on Tuesday, with a report in the Washington Post that Trump had shared confidential intelligence reports with Russia's foreign minister at a meeting last week. The White House has denied any wrongdoing, but the timing is particularly bad for Trump, who is already under investigation for possible Russian involvement in the presidential campaign. The markets are concerned that Trump will be so busy trying to put out political firestorms, that his agenda of increased fiscal spending and tax reform will stall. These jitters could hurt investor confidence and send gold prices to higher levels.
Pound Steady as Inflation Jumps to 3-Year High
GBP/USD is showing limited movement in the Tuesday session. In North American trade, GBP/USD is trading just above the 1.29 level. On the release front, CPI jumped to 2.7%, edging above the estimate of 2.6%. In the US, construction numbers disappointed, as both Building Permits and Housing Starts were weaker than expected. On Wednesday, the UK will release wage growth and unemployment rolls.
CPI, the primary gauge of consumer inflation, continued to move upwards, posting a sharp gain of 2.7% in April, matching the BoE forecast for inflation in the first quarter. This reading marked the strongest gain in CPI since September 2013. The pound briefly responded with gains, as speculation has increased that the Bank of England may raise interest rates to keep inflation under control. The weak pound has contributed to higher inflation, which has hurt wage growth and caused consumers to scale back on spending. The BoE has warned that living standards are set to drop, and the markets will be keeping a close eye on the wage growth release on Wednesday, which is expected to edge up to 2.4%.
President Trump has been pressing the damage control button since last week, as the White House and Congress remain focused on the fallout from Trump's dismissal of FBI director James Comey. There was more bad news for President Trump on Tuesday, with a report in the Washington Post that Trump had shared confidential intelligence reports with Russia's foreign minister at a meeting last week. The White House has denied the report, but the timing is particularly bad for Trump, who is already under investigation for possible Russian involvement in the presidential campaign. The markets are concerned that Trump will be so busy trying to put out political firestorms, that his agenda of increased fiscal spending and tax reform will stall. These jitters could hurt investor confidence and send the US dollar downwards.
Yen Yawns as US Construction Numbers Disappoint
USD/JPY has posted losses in the Tuesday session, erasing the gains seen on Monday. In North American trade, the pair is trading at the 113 line. On the release front, Japanese Tertiary Industry Activity declined 0.2%, weaker than the estimate of a 0.1% gain. In the US, construction numbers disappointed, as both Building Permits and Housing Starts were weaker than expected.
US construction data pointed downward in April. Building Permits dropped to 1.23 million, short of the forecast of 1.26 million. The news wasn't any better from Housing Starts, which slipped to 1.17 million, compared to the estimate of 1.26 million. This marked the smallest number of housing starts since November 2016. Despite the weak numbers, demand for housing remains high, fueled by a labor market that is close to capacity and unemployment at just 4.4 percent.
In Japan, inflation and manufacturing reports were solid. PPI rebounded in remarkable fashion, showing improvement in 10 straight releases. The index jumped to 2.1% in April, above the forecast of 1.8%. Is inflation on the move? We won't get a look at Tokyo Core CPI and other inflation indicators until next week, but stronger numbers would put pressure on the BoJ to reconsider its ultra-loose monetary policy, which has yet to produce sustained growth or higher inflation, as was advertised by the government and the BoJ. There was more positive news from the manufacturing sector, as orders for machine tools jumped 34.7% in April, on a year-on year basis.
President Trump and his aides continues to be preoccupied with damage control, as the White House and Congress remain focused on Comeygate, as the fallout from Trump's dismissal of FBI director James Comey continues. There was more bad news for President Trump on Tuesday, with a report in the Washington Post that Trump had shared confidential intelligence reports with Russia's foreign minister at a meeting last week. The White House has denied the report, but the timing is particularly bad for Trump, who is already under investigation for possible Russian involvement in the presidential campaign. The markets are concerned that Trump will be so busy trying to put out political firestorms, that his agenda of increased fiscal spending and tax reform will stall. These jitters could hurt investor confidence and send global stock markets lower.
With Broad Support, Production Jumps Most in Three Years
Despite mixed signals from survey data, the latest report on the industrial sector suggest broad firming in manufacturing activity as industrial production increased 1.0 percent—the largest gain in three years.
Industrial Production Firms
The 1.0 percent increase in industrial production for April was more than double the 0.4 percent increase that had been expected and affirms that the slow-growth recovery in the manufacturing sector remains intact.
Encouragingly, manufacturing output also increased 1.0 percent in April and with that gain the overall level of manufacturing output is at a fresh high for this cycle.
Broad-Based Growth
For the first time in recent memory, all three major industry groups were higher with manufacturing, mining and utilities all posting gains of at least 0.7 percent on the month.
One lesson from the ups and downs of the manufacturing recovery in this cycle is to curb your enthusiasm when the data finally indicate firming in activity. The latest print of the ISM manufacturing survey showed a big dip in the orders component.
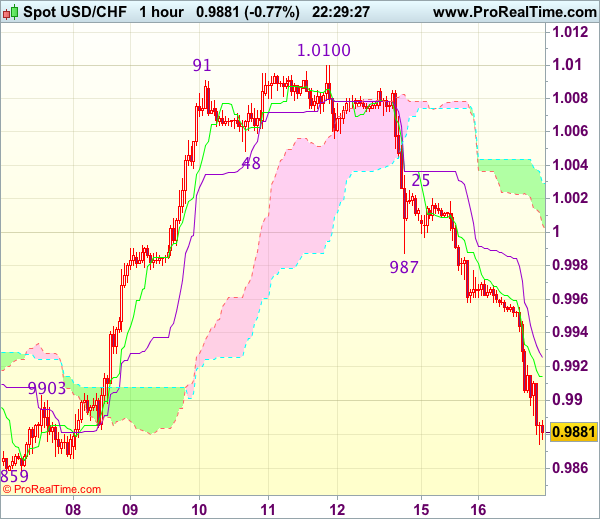
Trade Idea Wrap-up: USD/CHF – Sell at 0.9960
USD/CHF - 0.9880
Most recent candlesticks pattern : N/A
Trend : Near term down
Tenkan-Sen level : 0.9912
Kijun-Sen level : 0.9923
Ichimoku cloud top : 1.0029
Ichimoku cloud bottom : 1.0005
Original strategy :
Sell at 0.9960, Target: 0.9860, Stop: 0.9995
Position : -
Target : -
Stop : -
New strategy :
Sell at 0.9960, Target: 0.9860, Stop: 0.9995
Position : -
Target : -
Stop : -
As dollar’s decline has gathered momentum, adding credence to our view that the selloff from 1.0100 top is still in progress, hence further weakness towards support at 0.9859 would be seen, however, break there is needed to retain bearishness and bring subsequent fall towards previous chart support at 0.9813 which is likely to hold from here due to near term oversold condition.
In view of this, would not chase would be prudent to sell dollar on recovery as 0.9960 should limit upside. Above previous support at 0.9987 would defer and suggest an intra-day low is formed instead, risk a stronger rebound to 1.0025 but price should falter below 1.0045-50, bring another decline later.
Trade Idea Wrap-up: GBP/USD – Sell at 1.2925
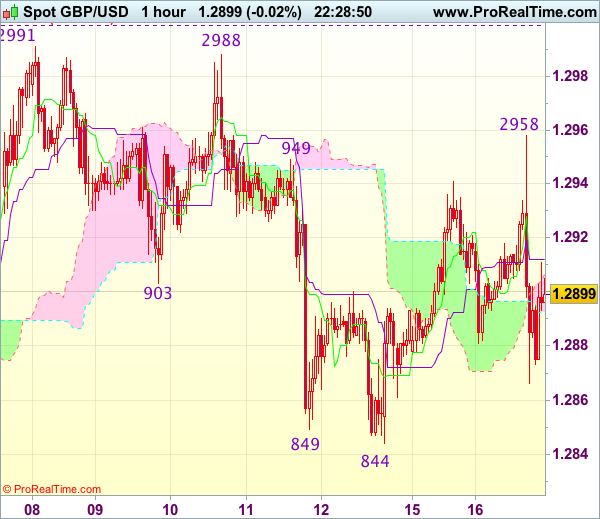
GBP/USD - 1.2903
Most recent candlesticks pattern : N/A
Trend : Near term up
Tenkan-Sen level : 1.2912
Kijun-Sen level : 1.2912
Ichimoku cloud top : 1.2906
Ichimoku cloud bottom : 1.2893
Original strategy :
Sell at 1.2925, Target: 1.2825, Stop: 1.2960
Position : -
Target : -
Stop : -
New strategy :
Sell at 1.2925, Target: 1.2825, Stop: 1.2960
Position : -
Target : -
Stop : -
Although cable staged a brief bounce to 1.2958, lack of follow through buying on break of previous resistance at 1.2949 and the subsequent retreat has retained our view that further choppy trading below recent high at 1.2991 would take place and mild downside bias remains for another fall to 1.2844 support, however, break there is needed to extend the fall from 1.2991 to 1.2831 support, then 1.2805.
In view of this, we are looking to sell cable on recovery as 1.2940 should limit upside. A firm break above said intra-day resistance at 1.2958 would abort and suggest correction from 1.2991 has ended at 1.2844, bring further gain to 1.2970 but said resistance at 1.2991 should hold on first testing. Only a break of 1.2999-00 (1.236 times projection of 1.2109-1.2616 measuring from 1.2365 and psychological resistance) would revive bullishness and bring resumption of upmove for headway to 1.3040-50 first.