Sample Category Title
Market Update – Asian Session: Macron Victorious In France
Asia Mid-Session Market Update: Macron victorious in France; Nikkei returns with a 2% rise to 18-month highs; China Trade internals underwhelm while Reserves extend rebound
Friday US Session Highlights
Apr CBIZ Small Business Employment Index: -0.3% v +1.6% m/m; first negative reading for the April period since the SBEI's inception
(US) APR UNEMPLOYMENT RATE: 4.4% V 4.6%E (lowest since May 2007); Underemployment Rate: 8.6% v 8.9% prior; participation Rate: 62.9% v 63.0% prior
(US) APR CHANGE IN NONFARM PAYROLLS: +211K V+190KE; Mar revised lower
(US) APR AVERAGE HOURLY EARNINGS M/M: 0.3% V 0.3%E; Y/Y: 2.5% V 2.7%E; AVERAGE WEEKLY HOURS: 34.4 V 34.4E; prior earnings revised lower
(US) New York Fed Nowcast: cuts Q2 GDP forecast to 1.8% from 2.3% from 4/28
Politics
(FR) France's Macron defeats Le Pen in French Presidential Elections; Turnout was the lowest since 1969 – French Interior Ministry
(FR) According to Kantar survey, Macron's party would get 26% in upcoming French parliamentary elections, followed by Republicans' 21% and Le Pen's FN party at 21% - press
(GE) Chancellor Merkel's Christian Democrats (CDU) defeated the Social Democrats in the Schleswig-Holstein state elections; margin 33% to 26% - ARD
(US) Republicans in the Senate said to plan a version of healthcare bill that is radically different from that of the House, including keeping some of the Obamacare provisions - press
(UK) Opposition Labour Party finance chief McDonnell says he can guarantee that low and middle class wage earners would not see any tax increase to fund the party's spending plans if it wins elections next month - press
Weekend US/EU Corporate Headlines
CCP: To merge with Sabra Health Care REIT for combined equity value of $4.3B in all-stock deal, implies $29.96/share* (implies ~11.8% premium)
DHT: Board Unanimously Rejects Unimproved Proposal from Frontline
TRCO: Sinclair Broadcast expected to make a $45/shr offer for Tribune (implies a $3.9B deal) - financial press
Key economic data:
(CN) CHINA APR FOREIGN RESERVES: $3.030T V $3.020TE (UPDATE); 5-month high; 3rd straight increase (first 3-month streak since mid-2014)
(CN) CHINA APR TRADE BALANCE: $38.1B V $35.2BE
(CN) CHINA APR TRADE BALANCE (CNY): 262.3B V 197.2BE ; 3-month high
(AU) AUSTRALIA MAR BUILDING APPROVALS M/M: -13.4% (biggest decline since mid-2012) V -4.0%E; Y/Y: -19.9% (biggest decline in 5 months) V -10.0%E
(AU) AUSTRALIA APR ANZ JOB ADVERTISEMENTS M/M: +1.4% V +0.8% PRIOR
(AU) AUSTRALIA MAR NAB BUSINESS CONFIDENCE: 13 (highest level since early 2010) V 6 PRIOR; CONDITIONS: 14 V 12 PRIOR
Asia Session Notable Observations, Speakers and Press
Macron defeats Le Pen in French presidential elections by over 20pts as implied by polls, though market reaction is muted as investors look ahead to Parliamentary elections and also question his ability to govern a divided populace used to mainstream politics. Euro initially rises to 1.1020 but quickly reverses initial gains, while US equity futures markets turn marginally lower.
Chinal FX reserves rise for the 3rd straight time to a 5-month high as regulatory actions stem the tide of outflows. China Trade data also mixed, with CNY and USD denominated surplus beating estimates but Exports and Imports growth undershoot projections on both counts. CNY-denominated import growth slows to 4-month lows, and China Customs also notes Iron Ore imports were at lowest since Oct 2016.
Nikkei225 returns from 3-day break to reach its best levels since Dec-2015, tracking USD strength against the Yen following lowest US unemployment rate levels since mid-2007. Australia also firms as miners rally on a bounce in iron ore prices. Recall iron ore fell over 10% late last week, weighing on AUD currency. AUD/USD is tracking higher late in the day, up some 50pips from last week's lows despite a much bigger than expected decline in Australia building approvals.
Australia's 2nd biggest lender Westpac is little changed on mixed H1 results. Earnings were in line and bank said the level of delinquent borrowers remains historically “low” despite a modest uptick in overdue home loans.
China
(CN) Moody's: China shadow banking sector impacted by increasingly tight systemic liquidity - press
(CN) China said to focus on improving the auditing of SOE's overseas investment - Chinese press
(CN) China Customs: Apr iron ore imports were lowest since Oct - press
Japan
(JP) Japan Bankers Association Chairman Hirano: Japan does not need more monetary or fiscal stimulus, needs structural reforms
(JP) Japan Vice Fin Min of International Affairs (currency chief) Asakawa: Slowdown of China economy is a major global risk - press
(JP) Japan PM Abe: China's role is important in dealing with North Korea
Australia/New Zealand
(NZ) BNZ (private bank): Believes RBNZ will raise cash rate in Feb 2018 (prior view was May 2018)
Korea
(KR) South Korea govt think tank (KDI) monthly report: Economy is on modest recovery track - Korean press
(KR) North Korea detains another US citizen, bringing the number of total US detainees to 4 - press
Asian Equity Indices/Futures (00:30ET)
Nikkei +2.4%, Hang Seng +0.6%, Shanghai -0.7%, ASX200 +0.5%, Kospi +1.3%
Equity Futures: S&P500 flat; Nasdaq -0.1%, Dax flat, FTSE100 +0.1%
FX ranges/Commodities/Fixed Income (00:30ET)
EUR 1.0960-1.1020; JPY 112.60-112.95; AUD 0.7385-0.7420; NZD 0.6890-0.6930; GBP 1.2950-1.2990
June Gold +0.3% at 1,231/oz; June Crude Oil +1.3% at $46.80/brl; July Copper -1.2% at $2.51/lb
(US) Weekly Baker Hughes US Rig Count: 877 v 870 w/w (+0.8%) (16th straight weekly rise)
(SA) Saudi Oil Min Al-Falih: OPEC cuts could extend beyond H2 of 2017; Not concerned with oil demand peaking any time soon - press
(CN) PBOC SETS YUAN MID POINT AT 6.8947 V 6.8884 PRIOR
(CN) PBOC skips open market operations (2nd straight skip)
Asia equities / Notables / movers
Australia
Westpac (WBC) +0.2%; Reports H1 cash earnings A$4.02B v A$4.02Be; Rev A$10.77B v A$10.48B y/y
Fairfax (FXJ) +2.6%; Received indicative proposal for certain assets from TPG consortium at A$0.95/shr in cash and shares
Myer (MYR) -8.9%; Credit Suisse Cuts MYR.AU to Underperform from Neutral, price target: A$0.82
Origin Energy (ORG) +3.1%; Announces agreement to sell Stockyard Hill Wind for A$110M
Hong Kong
Geely (175) +2.1%; Apr sales
ePrint (1884) -2.2%; Guides FY16
Japan
Olympus (7733) -4.7%; FY16/17 results
Subaru (7270) -0.3%; FY18 results speculation
Toshiba (6502) -1.0%; KKR said to be in talks over a preemptive bid for Toshiba's chip unit - press
Mitsubishi Motor (7211); FY16/17 results speculation
Daily Technical Analysis: EUR/USD Reaches 1.1025 After Macron Wins French Presidency
Currency pair EUR/USD
The French Presidential election took place on Sunday 7 May 2017 and saw centrist independent Macron beat far right candidate Le Pen with 66% vs 34%. The result is unique considering that Macron campaigned without a traditional party and with no experience of governing.
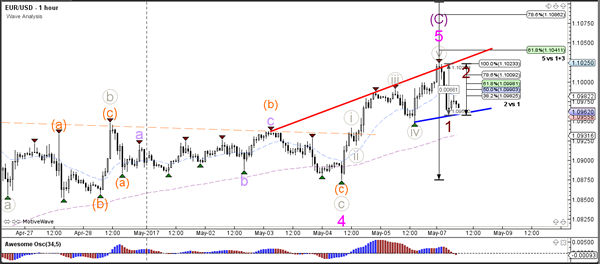
The EUR/USD initially saw a bullish reaction to the news but after hitting 1.1025 the EUR/USD turned around and showed a bearish candlestick. Price however is still moving higher in an uptrend channel (blue/red) and a break is needed before a reversal becomes likely.
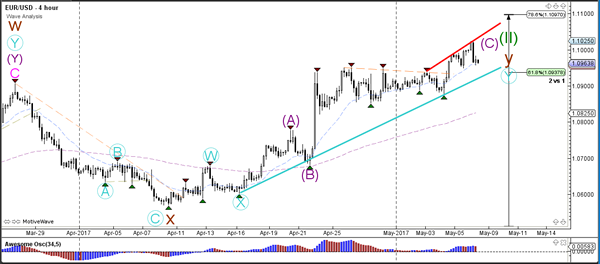
The EUR/USD could have completed the 5th waves (grey/pink) and is potentially building a reversal wave 1-2 (brown). A break above the top and 100% Fib level at 1.1023 would indicate a potential uptrend continuation towards the Fibonacci targets of wave 5 (pink).
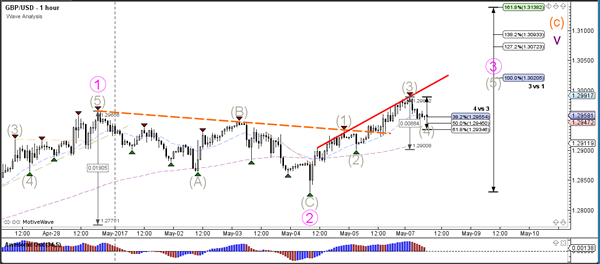
Currency pair GBP/USD
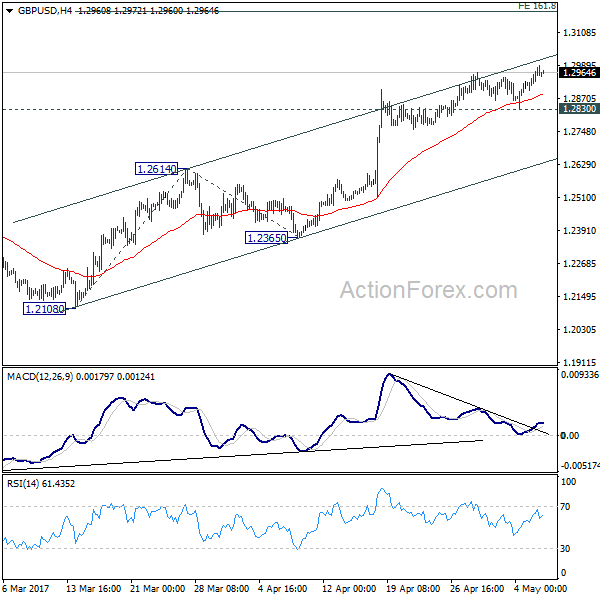
The GBP/USD has been unable to break above the resistance (red) of the uptrend channel (red/green). A bullish break could see price move towards the Fibonacci targets of wave 5 (purple) whereas a bearish break could start a reversal.
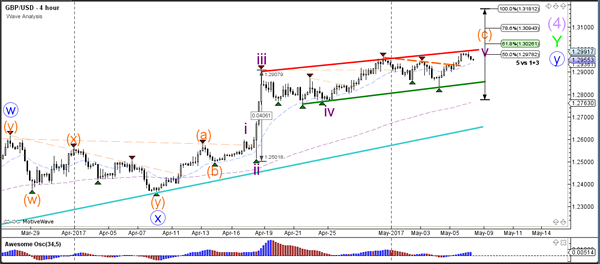
The GBP/USD seems is building a bearish retracement within a potential wave 4 (grey), which would become invalidated if price manages to break below the 61.8% Fibonacci level of wave 4 (grey).
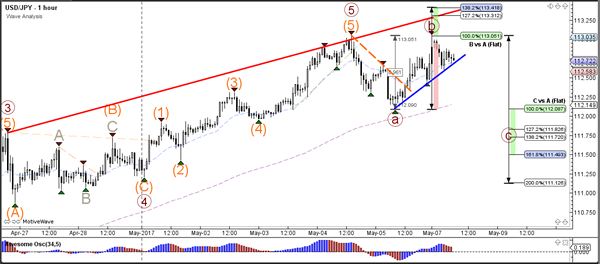
Currency pair USD/JPY
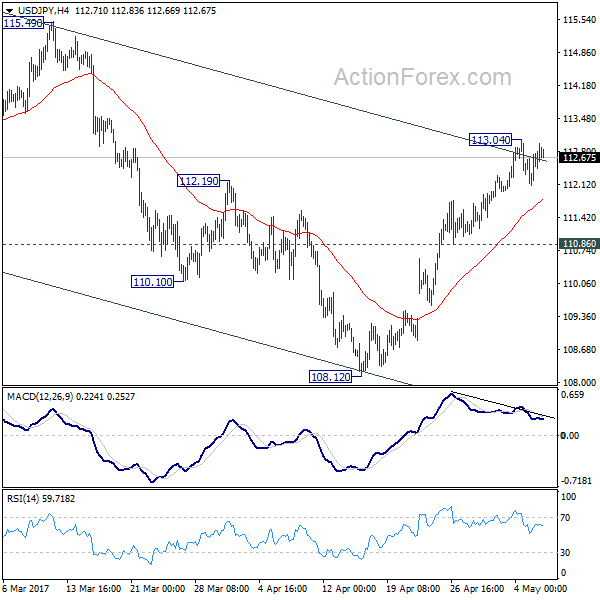
The USD/JPY uptrend could be facing problems if price is building a double top. A break above the top could see the uptrend continue but a break below support (blue) could start a larger bearish correction towards the Fib levels.
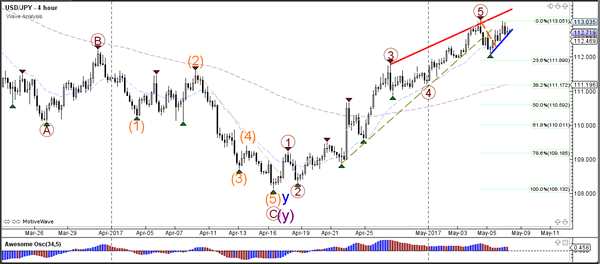
The USD/JPY seems to have completed the 5th wave (orange) of a 5th wave (brown) and price could be building an ABC (brown) correction. A break below support (blue) could start a larger bearish correction towards the Fib levels.
EUR/USD Candlesticks and Ichimoku Analysis
Weekly
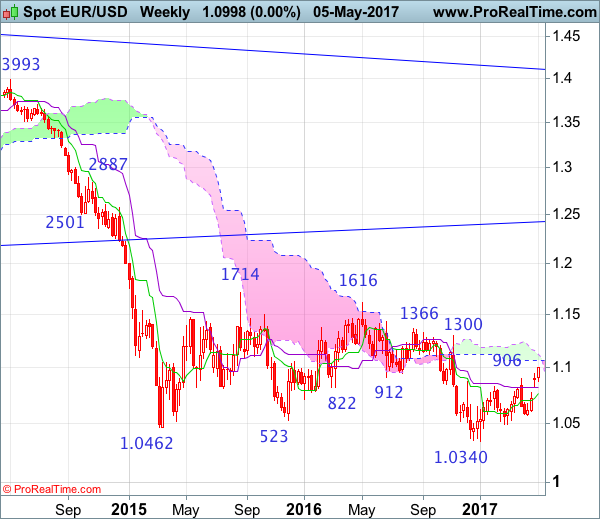
• Last Candlesticks pattern: Shooting star
• Time of formation: 03 May 2016
• Trend bias: Down
Daily
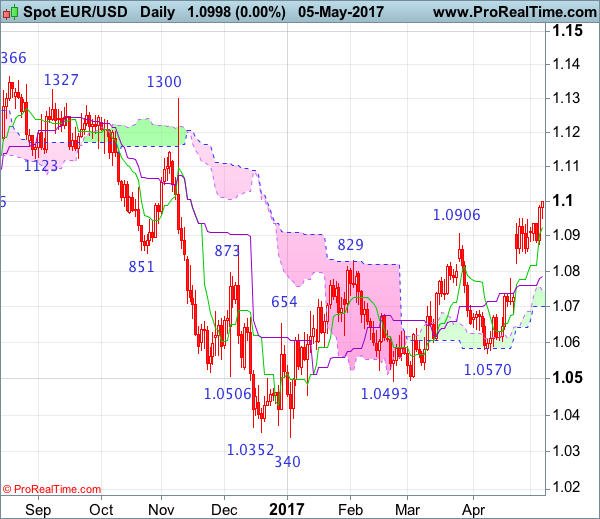
• Last Candlesticks pattern: Shooting star
• Time of formation: 3 May 2016
• Trend bias: Sideways
EUR/USD – 1.0986
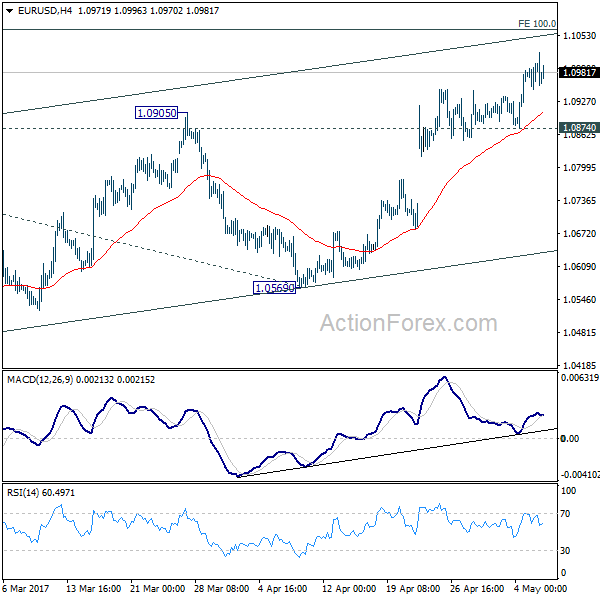
The single currency has surged again after brief pullback, adding credence to our bullish view that the erratic rise from 1.0340 low is still in progress and upside bias remains for this move to extend further gain to 1.1050-60 and possibly towards 1.1100, however, reckon upside would be limited to 1.1125-30 (61.8% Fibonacci retracement of 1.1616-1.0340) and price should falter well below previous chart resistance at 1.1300, bring strong retreat later.
On the downside, whilst initial pullback to the Tenkan-Sen (now at 1.0938), then 1.0900 cannot be ruled out, reckon downside would be limited to the Kijun-Sen (now at 1.0709) and previous resistance at 1.0778 should remain intact, bring another rise later. A daily close below latter level would defer and suggest top is possibly formed, risk test of support at 1.0682 but break there is needed to add credence to this view, bring further fall to 1.0640-50. Looking ahead, only a break of 1.0600-05 would provide confirmation and suggest the aforesaid rise from 1.0340 has possibly ended, risk test of key support at 1.0570 first.
Recommendation: Buy at 1.0800 for 1.1000 with stop below 1.0700.
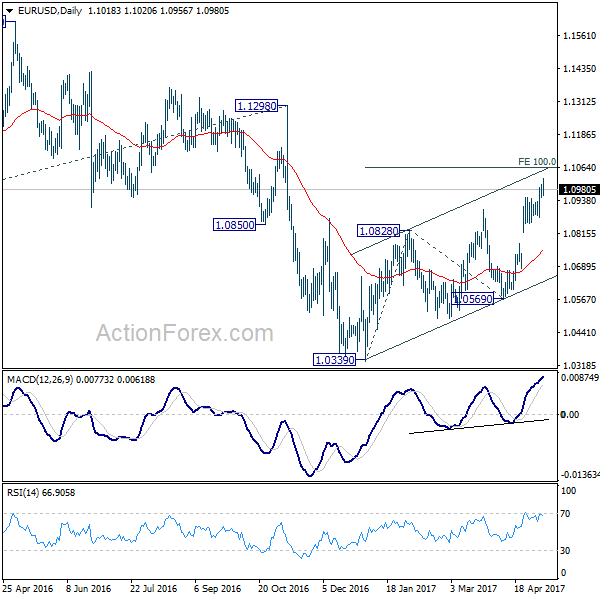
On the weekly chart, although the single currency has maintained a firm undertone after breaking above previous resistance at 1.0906, retaining our bullish view that he erratic rise from 1.0340 low is still in progress for retracement of recent downtrend, hence further gain to the lower Kumo (now at 1.1070), then the upper Kumo (now at 1.1097) would be seen, however, reckon upside would be limited to 1.1125-30 (61.8% Fibonacci retracement of 1.1616-1.0340) and 1.1200-10 would hold, price should falter well below strong resistance at 1.1366.
On the downside, expect pullback to be limited to support at 1.0875 and the Tnekan-Sen (now at 1.0798) should hold, bring another rise later. Only a drop below previous resistance at 1.0778 would abort and suggest top is formed instead, bring weakness to 1.0682-83 (current level of the Kijun-Sen and previous support). Below there would shift risk to the downside for further gall to 1.0570 support but only a weekly close below there would provide confirmation the aforesaid corrective rise from 1.0340 low has ended, then further decline towards key level at 1.0493 would follow.
USD/JPY Candlesticks and Ichimoku Analysis
Weekly
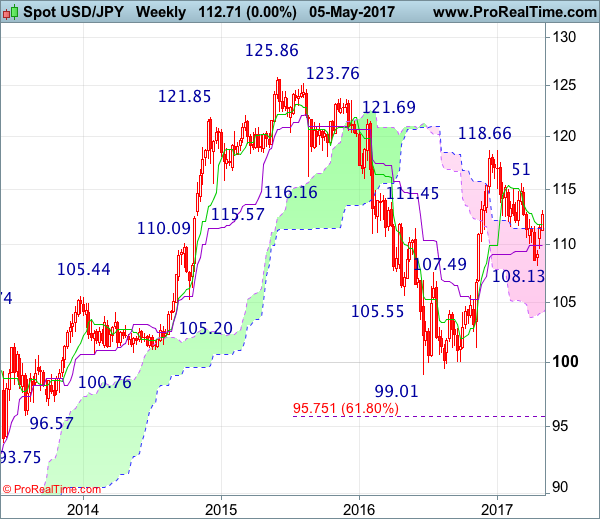
• Last Candlesticks pattern: Marubozu
• Time of formation: 14 Nov 2016
• Trend bias: Down
Daily
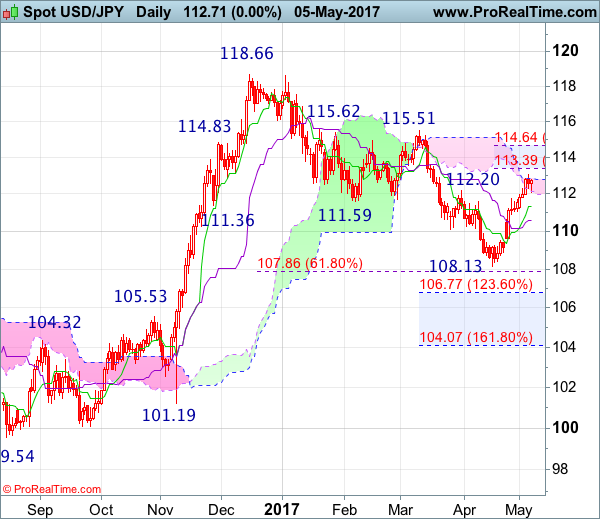
• Last Candlesticks pattern: Shooting star
• Time of formation: 15 Feb 2017
• Trend bias: Down
USD/JPY – 112.71
The greenback has maintained a firm undertone after staging a strong rebound from 108.13, suggesting this rise is still in progress for retracement of early downtrend, hence mild upside bias is seen for further gain to 113.35-40 (50% Fibonacci retracement of 118.66-108.13), then towards 114.00-10, however, reckon upside would be limited to 114.60-65 (61.8% Fibonacci retracement) and price should falter well below key resistance at 115.51, bring retreat later.
On the downside, whilst initial pullback to 112.05-10 cannot be ruled out, reckon the Tenkan-Sen (now at 111.96) would limit downside and bring another rise later. Below support at 111.04 would defer and risk test of the Kijun-Sen (now at 110.59), however, a daily close below there is needed to signal top is possibly formed, bring correction of recent upmove to 110.00 first. Only a daily close below said support at 109.59 would suggest top is possibly formed instead, bring weakness to 108.85-90 but break there is needed to signal the rebound from 108.13 has ended, then retest of this recent low would follow. Looking ahead, dollar needs to penetrate this level to revive bearishness and extend the erratic decline from 118.66 top to 107.85-90 (61.8% Fibonacci retracement of 101.19-118.66) and possibly 107.40-50.
Recommendation : Buy at 111.70 for 113.70 with stop below 110.70.
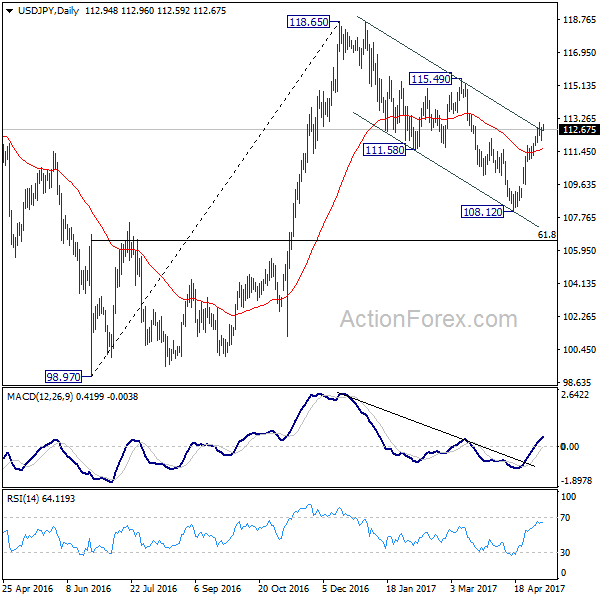
On the weekly chart, last week’s rally formed another white candlestick and current firmness adds credence to our bullish view that low has been formed at 108.13 last month, hence consolidation with upside bias remains for further gain to 113.35-40 (50% Fibonacci retracement of 118.66-108.13), then towards 114.60-65 (61.8% Fibonacci retracement), however, reckon upside would be limited and price should falter well below resistance at 115.51. Looking ahead, only a break of 115.51 would retain bullishness and signal the entire correction from 118.66 has ended at 108.13), bring further rise to 119.50, then 120.00-10 but resistance at 121.69 should remain intact.
On the downside, expect pullback to be limited to 112.00-05 and the Tenkan-Sen (now at 111.67) should hold, bring another rise later. Below last week’s low at 111.21 would defer and suggest top is possibly formed, risk weakness to 110.45-50 but only break of indicated previous support at 109.59 would add credence to this view, bring further fall to previous resistance at 109.49. A drop below this level would provide confirmation, bring weakness to 108.80-85, break there would bring retest of 108.13 support, once this level is penetrated, this would revive bearishness an extend recent selloff from 118.66 to 107.85-90 (61.8% Fibonacci retracement of 101.19-118.66), then towards 107.00, however, reckon downside would be limited to 106.50-55 (61.8% Fibonacci retracement of 99.01-119.52) and previous resistance at 105.53 (now support) should remain intact.
AUD May Not Have Found A Bottom Yet
Key Points:
- Last week saw substantial losses accrue.
- A period of moderation could now be on the cards.
- Fundamentals should be in command this week.
The AUD went plunging lower last week which could mean that a correction is now on the cards. However, given the voracity of the slip, we may see new lows tested before the bulls can take back control of the embattled pair. As a result of this, a look at both what was driving price action last week and what is set to drive prices this week is now more than warranted.
Taking a look at last week first, the Aussie dollar spent initial sessions of last week surging higher as a result of not only some softer US figures but also the Cash Rate decision from the RBA. Nevertheless, this buoyancy was not to last as a subsequent uptick in the US ADP NFP figure to 177K and an accompanying jump in the ISM Non-Manufacturing PMI to 57.5 saw a sentiment swing back towards the USD, despite the Fed also electing to keep rates static. Ultimately, this saw the pair tumble by over 100 pips but, unlike the wider market, these losses failed to moderate in the proceeding sessions as the Australian Trade Balance of 3.11B kept selling pressure intact as the week closed.
As for what lies ahead fundamentally, there are a number of Australian news items to watch out for but the Retail Sales and MI Inflation Expectations figures are likely to be the major risk events. This stems largely from the fact that the AUD has never truly shaken-off the recessionary fears that weighed on it following the negative GDP results over the past few months. As a result of this, if we see Retail Sales fall short of the forecasted 0.3% outcome or if the Inflation Expectations suggest that the RBA’s target band is not going to be reached, losses could extend.
On the technical front, the AUD still remains beholden to a declining trend line but losses should moderate somewhat in the coming week if the fundamentals come in on target, potentially leading to a near-term ranging phase. Specifically, the AUD is currently in conflict with a robust historical reversal zone which could remain intact unless the economic results miss the mark substantially. This being said, the EMA, MACD, and Parabolic SAR readings all remain bearish which will severely limit chances of a strong recovery occurring.
Overall, at best, we expect to see modest gains for the week to come but significant downside risks are also in play. Due to this, keep a watchful eye on the news feed as it will only take a slight push from the fundamental side of things to see the bears seize on the very bearish technical bias.
Cable Readies For A Busy Week As BoE Set To Meet
Key Points:
- Official Bank Rate decision pending.
- RSI Oscillator strongly overbought.
- Watch for a pullback towards the 1.29 handle in the coming week.
The Cable had another week in the green as the pair largely followed out forecast from last week and rose to challenge resistance at 1.2965 following some strong gains in the UK Manufacturing and Services PMI figures. In addition, the uncertainty around the U.S. Fed's path to rate hikes also buoyed the pair and saw it close the week out around the 1.2977 mark. Subsequently, it makes sense to review last week's events given that there is plenty of question as to whether the pair can retain its current level in the week ahead.
The Cable provided a strong performance last week as the currency reacted to some gains in the UK Manufacturing and Services PMI's to 57.3, and 55.8, respectively. This saw a fairly constant appreciation for the GBP which was further buoyed by the vacillation from Fed Chair Yellen over future rate hikes. It appears that the lack of forward guidance from the Federal Reserve is impacting the greenback's strength and, therefore, benefitting the GBP. Subsequently, the pair rallied through most of the week to close right in the middle of a key zone of resistance at 1.2977.
Looking ahead, the Cable is likely facing a frenetic week with the release of the Bank of England's decision on interest rates, as well as the NIESR GDP Estimate, due for release. The BoE's monetary policy committee is likely to keep the official bank rate on hold at 0.25% but expect plenty of forward guidance from the bank, especially considering that inflation continues to rise. Additionally, the NISER GDP Estimate is due out on Friday and is estimate at 0.4% q/q which is likely to be relatively accurate this time around. However, any deviation could cause a spike of volatility for the pair.
From a technical perspective, the pair's rally has taken it to a key zone of resistance around 1.2965-75 and the RSI and Stochastic Oscillators are now strongly within reversal territory. Subsequently, our initial bias is bearish for a corrective pullback towards support around the 1.29 handle in the coming week. However, keep a close watch on volatility from the BoE and NIESR GDP releases as they may impact the pair's trend direction. Support is currently in place for the pair at 1.2754, 1.2830 1.2625. Resistance exists on the upside at 1.2965, 1.3121, and 1.3335.
Ultimately, the Cable is in for a volatile ride with plenty of fundamental decisions due out over the next week. In particular, watch the positioning ahead of the Bank of England's decision on interest rates as the statement following the event will be critical moving forward. I suspect that the likely course of events is a small pop before the Cable declines back towards support around the 1.29 handle.
EUR/USD Daily Outlook
Daily Pivots: (S1) 1.0962; (P) 1.0981 (R1) 1.1015; More....
Intraday bias in EUR/USD remains on the upside. Current rise would target 100% projection of 1.0339 to 1.0828 from 1.0569 at 1.1058. However, rise from 1.0339 is still seen as a corrective move. Hence we'd expect strong resistance from 1.1058 projection to limit upside and bring near term reversal. On the downside, break of 1.0874 support will turn bias back to the downside for 1.0569 support first.
In the bigger picture, as long as 1.1298 key resistance holds, whole down trend from 1.6039 (2008 high) is still expected to continue. Break of 1.0339 low will send EUR/USD through parity to 61.8% projection of 1.3993 to 1.0461 from 1.1298 at 0.9115. However, considering bullish convergence condition in weekly MACD, break of 1.1298 will indicate long term reversal.
GBP/USD Daily Outlook
Daily Pivots: (S1) 1.2921; (P) 1.2952; (R1) 1.3005; More...
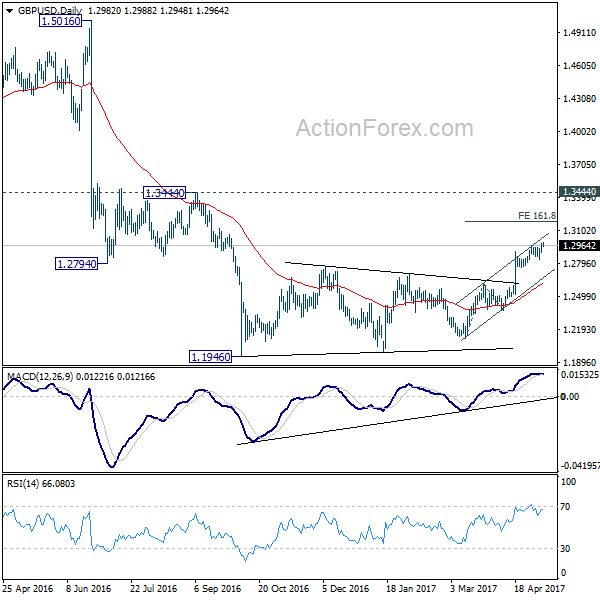
Intraday bias in GBP/USD remains on the upside and current rise should target 161.8% projection of 1.2108 to 1.2614 from 1.2365 at 1.3184. At this point, price actions from 1.1946 are still interpreted as a correction pattern. Therefore, we'd expect strong resistance below 1.3444 to bring larger down trend resumption. On the downside, break of 1.2830 support will indicate short term topping. In such case, intraday bias will be turned back to the downside for 1.2614 support.
In the bigger picture, fall from 1.7190 is seen as part of the down trend from 2.1161. There is no sign of medium term reversal yet. Sustained trading below 61.8% projection of 2.1161 to 1.3503 from 1.7190 at 1.2457 will target 100% projection at 0.9532. Overall, break of 1.3444 resistance is needed to confirm medium term bottoming. Otherwise, outlook will remain bearish.
USD/CHF Daily Outlook
Daily Pivots: (S1) 0.9847; (P) 0.9875; (R1) 0.9895; More.....
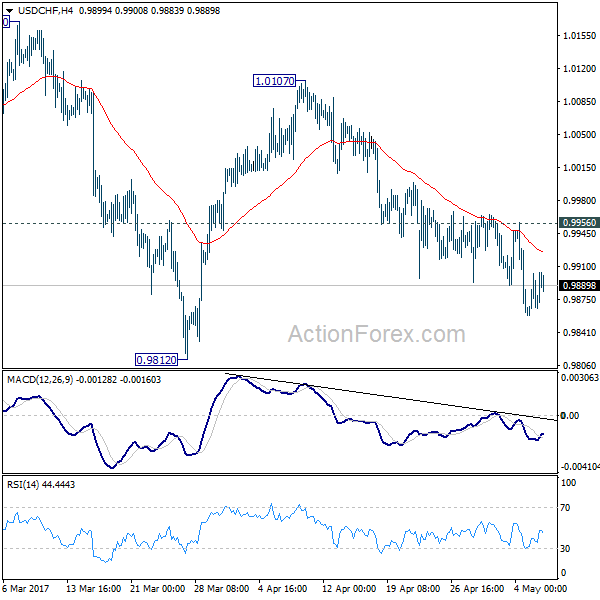
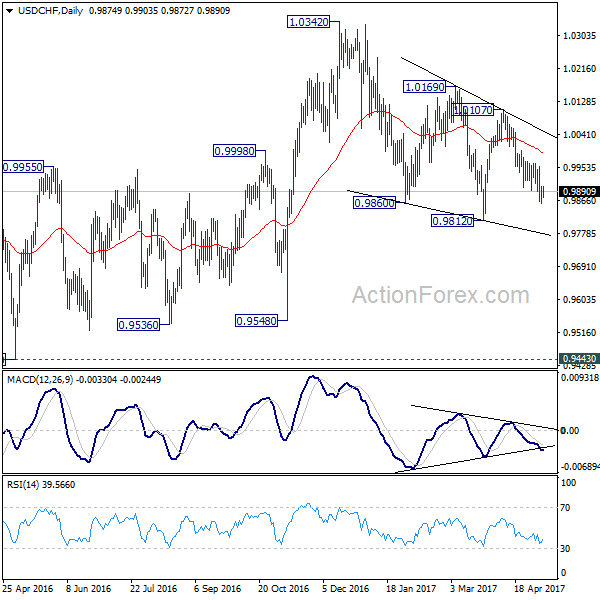
Further decline is expected in USD/CHF for 0.9812 support and below. However, price actions from 1.0342 are seen as a correction. Break of 0.9812 should be brief and we will look for bottoming signal below there. On the upside, break of 0.9956 resistance will suggest that fall from 1.0107 is completed and turn bias back to the upside for this resistance.
In the bigger picture, we're still maintaining that firm break of 1.0342 key resistance is needed to confirm underlying bullish momentum in the pair. However, the corrective nature of the fall from 1.0342 is starting to give the medium term outlook a bullish favor. Hence, in stead of looking for topping signal around 1.0342, we'd now pay closer attention to upside acceleration as USD/CHF approaches this level again.
USD/JPY Daily Outlook
Daily Pivots: (S1) 112.23; (P) 112.52; (R1) 112.95; More...
Intraday bias in USD/JPY remains neutral as consolidation from 113.04 temporary top continues. We'd holding on to the view that corrective fall from 118.65 could be completed with three waves down to 108.12. Further rise is expected as long as 110.86 support holds. Above 113.04 will target 115.49 resistance. Firm break there will resume larger rally from 98.97 to 125.85 high. However, break of 110.86 support will keep USD/JPY inside near term falling channel and will turn bias back to the downside for 108.12 and below to extend the decline from 118.65.
In the bigger picture, price actions from 125.85 high are seen as a corrective pattern. It's uncertain whether it's completed yet. But in case of another fall, downside should be contained by 61.8% retracement of 75.56 to 125.85 at 94.77 to bring rebound. Meanwhile, break of 115.49 resistance will extend the rise from 98.97 to retest 125.85. Overall, rise from 75.56 is still expected to resume later after the correction from 125.85 completes.