
Sample Category Title
Market Update – European Session: European Sentix Confidence At Highest Level Since July 2007 Aided By Decrease In Political...
Notes/Observations
Macron handily wins the French Presidential election as its European allies' breathe sigh of relief
European Sentix Confidence at highest level since July 2007 aided by decrease in political uncertainties in the euro zone
China's forex reserves rose for the third month in a row in April, signaling eased capital flight pressure.
Overnight:
Asia:
China Apr Trade Balance registers a slightly bigger surplus ($38.1B v $35.2Be) as both exports and imports underwhelm
China Apr Foreign Reserves climb to a 5-month high as its registered its 3rd straight monthly increase ($3.030T V $3.020Te (**Note: Data saw its 1st three-month rising streak since mid-2014)
Japan/China said to have agreed on need to deepen cooperation in finance and collaboration on trade and investment
sidelines of Asian Development Bank's annual meeting
Europe:
France's Macron defeats Le Pen in French Presidential Elections (66% to 34%); Turnout was the lowest since 1969
Chancellor Merkel's Christian Democrats (CDU) defeated the Social Democrats in the Schleswig-Holstein state elections; margin 33% to 26%
German Emnid Poll: Merkel's Conservative coalition extends lead in upcoming Sept elections (- CDU/CSU 36% ; SPD 28%
German Chancellor Merkel said to have expressed her dissatisfaction with EU Commission President Juncker over his Apr 26th dinner with UK PM May and Brexit-related talks
Germany said to consider proposing giving Britain access to single market in return for a fee
PM May said to accuse Juncker of hardening stance on Brexit . Must end threats designed to influence outcome of upcoming snap elections. PM said to consider publishing hard Brexit plans in event EU talks break down
UK Home Sec Rudd: EU President Tusk held very hostile briefings against PM May after April 26th dinner in deliberate attempt to influence voters Sovereign rating (Friday)
Fitch affirmed United Kingdom sovereign rating at AA; outlook Negative
S&P affirmed Italy BBB- sovereign ratings; outlook stable
S&P affirmed Turkey BB sovereign ratings; outlook negative
Canadian rating agency DBRS affirmed Norway sovereign rating at AAA, stable trend
Americas:
Fed's Bullard (non-voter, dovish): wants Fed to start trimming balance sheet in H2 this year; Fed has waited too long to reduce balance sheet
Fed's Williams (moderate, non-voter): We'll be normalizing the balance sheet sometime in the future; it makes sense to start unwinding the balance sheet later
Fed's Rosengren (moderate, non-voter): Fed will hit zero rates more often in the future; it's inevitable the Fed will need to expand balance sheet again in future. Reiterated preference is to cut balance sheet gradually and relatively soon
Energy:
Saudi Oil Min Al-Falih: OPEC cuts could extend beyond H2 of 2017; Not concerned with oil demand peaking any time soon
Economic Data
(JP) Japan Apr Consumer Confidence: 43.2 v 43.2
(DE) Germany Mar Factory Orders M/M: 1.0% v 0.7%e; Y/Y: 2.4% v 2.1%e
(NO) Norway Mar Industrial Production M/M: -0.1% v -0.6% prior; Y/Y: 1.0% v 1.2% prior
(NO) Norway Mar Manufacturing Production M/M: -1.1% v 0.5%e; Y/Y: -3.3% v -1.4% prior
(SE) Sweden May Housing Price Indicator: 69 v 67 prior
(TR) Turkey Mar Industrial Production M/M: 1.3% v 0.8%e; Y/Y: 2.8% v 2.5%e
(CN) China Q1 Preliminary Current Account: $19.0B v $11.8B prior
(UK) Apr Halifax House Prices M/M: -0.1% v +0.1%e; 3M/Y: 3.6%e v 3.8% prior
(SE) Sweden Apr Budget Balance (SEK): +4.3B v -9.1B prior
(TW) Taiwan Apr Trade Balance: $2.8B v $4.0Be, Exports Y/Y: +9.4% v +10.9%e, Imports Y/Y: +23.5% v +18.0%e
(EU) Euro Zone Apr Sentix Investor Confidence: 27.4 v 25.2e (highest since July 2007)
Fixed Income Issuance:
None seen
SPEAKERS/FIXED INCOME/FX/COMMODITIES/ERRATUM
Equities
Indices [Stoxx50 -0.5% at 3642, FTSE flat at 7297, DAX -0.3% at 12676, CAC-40 -0.7% at 5393, IBEX-35 -0.4% at 11096, FTSE MIB -0.5% at 21376, SMI -0.3% at 8994, S&P 500 Futures %]
Market Focal Points/Key Themes European Equities trade largely lower on profit taking following the expected victory for Macron in the French election. The CAC leads the decliners down 0.6%, with the FTSE slightly higher. Shares of Centrica and Akzo Nobel down in early trade, with Akzo Nobel rejecting the 3rd increased offer from PPG, and Centrica said its on course to hit 2017 targets. French Banks are giving back some ground following the strong run up to the elections with shares of SocGen a notable decliner. Earnings will continue to dominate the corporate calender in the US today with notable earners including AES Corp, Mallinckrodt and Tyson Foods.
Equities
Consumer discretionary [Premier Foods [PFD.UK] +1.7% (Renews relationship with Mondelez)]
Materials: [Akzo Nobel [AKZA.NL] -2.2% (Rejects PPG offer),]
Industrials: [Hamburger Hafen Und Logistik [HHFA.DE] +6.1% (Raises outlook), Volkswagen [VOW3.DE] +0.1% (Royal Enfield approach for Ducati), Post NL [POST.NL] -8.2% (Earnings)]
Financials: [SocGen [GLE.FR] -2.9% (Profit taking)]
Telecom: [QSC [QSC.DE} +9.7% (Earnings)]
Energy: [Centrica [CNA.UK] -0.3% (Trading update)]
Speakers
ECB's Mersch (Luxembourg) reiterated Euro-area recovery was gathering momentum with confirmation of a broadly balanced risk outlook for growth was within reach. Saw timid signs of early pipeline inflation pressure
Moody's: President's Macron policy platform is credit positive for France. Outcome of France's legislative elections in June would be crucial in determining whether the new president was able to achieve his policy plans
China FX Regulator SAFE noted that the current account surplus was within a reasonable range and the balance of payments basically balanced in Q1 back by sound economy. Economic growth is more stable
China govt reportedly considering merging 8 companies into 3 larger power companies
FX Regulator SAFE's Pan: Reiterated view that govt to keep CNY currency (Yuan) value basically stable at a reasonable level. To further increase Yuan rate flexibility
Russia Energy Ministry: Extension of OPEC deal would accelerate market rebalancing; would support extending OPEC cuts beyond 2017. Reiterated Russian/OPEC efforts have been very effective
Currencies
The session in Asia initially saw risk-on appetite as EUR/USD tested above 1.10 level for its highest reading since early Nov as the political uncertainties in the euro zone decreased.
The European morning saw the Euro give up gains after centrist Emmanuel Macron's victory over the far-right Marine Le Pen in France's presidential elections.
South Korean KRW currency (won) was firmer ahead of presidential elections on Tuesday as leading liberal candidate Moon Jae-in seen likely to emerge victorious
Commodity prices also bounced back on the potential OPEC cut in oil production helping the AUD hold steady.
Fixed Income
Bund futurestrade at 160.63 up 25 ticks but off the highs following the cash open. A break of 160.40 support level could see lows target 159.60 followed by 159.01. Resistance remains near the 161.88 level followed by 163.54.
Gilt futurestrade at 127.81 lower by 9 ticks, after initially bouncing higher on the open. A continuation of the pullback from the 129.14 April 18th high has price eyeing the 127.50 support level. An acceleration lower could test the 126.62 region. Resistance stands at 128.49 then 128.81 followed by 129.14.
Monday's liquidity report showed Friday's excess liquidity rose to €1.650T a gain of €1B from €1.649T prior. Use of the marginal lending facility dropped to €296M from €340M prior.
Corporate issuance saw $39.0B issued last week, well ahead of last week's forecast of $25B. For the week ahead, analysts eye issuance to come in around $35B.
In Euro denominated issuance €9.7B came to market last week via 20 issuers and 21 tranches.
Looking Ahead
(MX) Mexico Apr Vehicle Production: No est v 363.7K prior; Vehicle Exports: No est v 297.6K prior
05:30 (DE) Germany to sell €2.0B in 6-month BuBills - 06:45 (US) Daily Libor Fixing
07:00 (IN) India announces details of upcoming bond sale (held on Fridays)
07:00 (CL) Chile Apr CPI M/M: 0.2%e v 0.4% prior; Y/Y: 2.7%e v 2.7% prior
07:00 (CL) Chile Apr CPI Ex Food and Energy M/M: 0.3%e v 0.4% prior; Y/Y: No est v 2.2% prior
07:25 (BR) Brazil Central Bank Weekly Economists Survey
07:30 (CL) Chile Apr Trade Balance: $0.5Be v $0.3B prior; Total Exports: $4.8Be v $5.5B prior; Total Imports: $4.4Be v $5.2B prior; Copper Exports: No est v $2.3B prior
07:30 (CL) Chile Apr International Reserves: No est v $39.0B prior
08:00 (ES) Spain Debt Agency (Tesoro) announces size of upcoming actions in week
08:15 (CA) Canada Apr Annualized Housing Starts: 215.0Ke v 253.7K prior
08:15 (UK) Baltic Dry Bulk Index - 08:30 (US) Fed's Bullard (non-voter, dovish)
08:45 (US) Fed's Mester (hawkish, non-voter)
08:50 (FR) France Debt Agency (AFT) to sell combined €5.2-6.4B in 3-month, 6-month and 12-month BTF Bills
09:00 (MX) Mexico Apr Consumer Confidence: 82.5e v 81.0 prior
09:30 (EU) ECB announces Covered-Bond Purchases
09:35 (EU) ECB calls for bids in 7-Day Main Refinancing Tender
10:00 (US) Apr Labor Market Conditions Index Change: 1.0e v 0.4 prior
11:30 (US) Treasury to sell 3-Month and 6-month Bills
16:00 (US) Weekly Crop Progress Report
EUR/USD Elliott Wave Analysis
EUR/USD – 1.0915
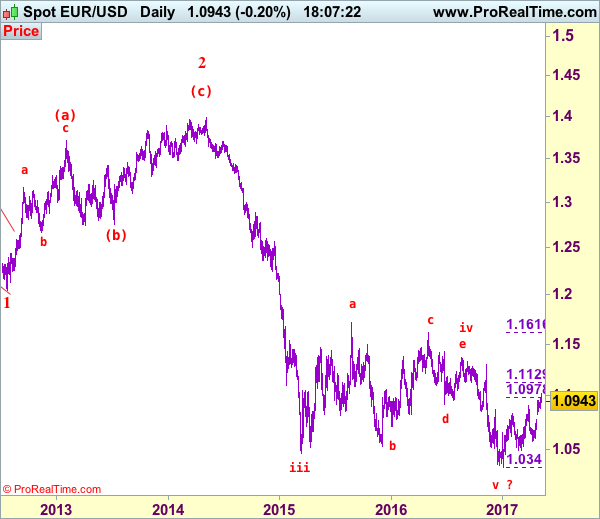
EUR/USD: Wave (c) of 2 ended at 1.3993 and wave 3 of III has commenced for weakness to 1.0411 (1.236 of wave 1), then 1.0000.
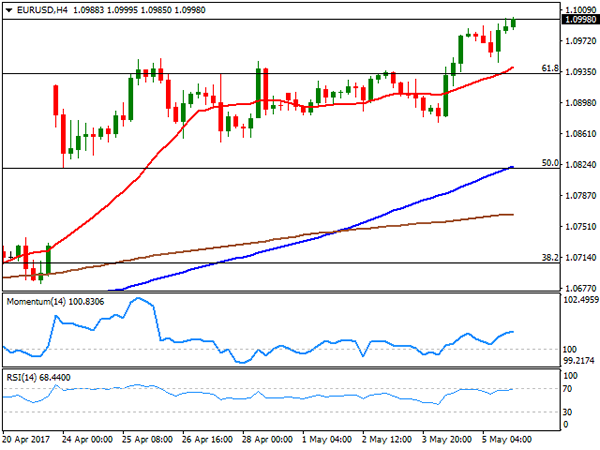
Although the single currency resumed recent rise from 1.0340 and rose to 1.1025 earlier today, lack of follow through buying and current retreat suggest consolidation below this level would be seen and pullback to 1.0900 cannot be ruled out, however, reckon downside would be limited to 1.0851 support and bring another rise later, above 1.1025 would extend the erratic rise from 1.0340 (tentatively wave v of larger defer wave 3) low to 1.1050 but reckon upside would be limited to 1.1125-30 (61.8% Fibonacci retracement of 1.1616-1.0340) and price should falter well below strong resistance at 1.1300, bring retreat later.
Our preferred count on the daily chart remains that a wave (II) from 1.2329 ended at 1.5145 with A-leg ended at 1.4720, followed by wave B at 1.2457, the wave C from there was also a 3 legged move and is labeled as (a): 1.3739, (b): 1.2885, the wave iii of the 5-waver (c) from 1.2885 has ended at 1.4339 and wave iv is a triangle ended at 1.3878 and wave v formed a top at 1.5145. The decline from there is a 5-waver (C) with minor wave (i) of I of (C) ended at 1.4218 with wave (ii) ended at 1.4580, wave (iii) ended at 1.3267 and wave (iv) ended at 1.3692 and wave (v) ended at 1.1876, this is also the low of wave I of (C) and wave II ended at 1.4940, hence wave III is now in progress with a diagonal wave 1 ended at 1.2042, the breach of previous support at 1.1876 (wave I trough) adds credence to our view that the wave 2 has ended at 1.3993, wave 3 has commenced for further weakness to 1.0411, then towards 1.0000.
On the downside, although initial pullback to 1.0890-00 cannot be ruled out, reckon support at 1.0851 would limit downside and bring another rise later. A daily close below previous resistance at 1.0778 (now support) would defer and risk weakness to 1.0735-40, break there would signal top is formed, bring test of support at 1.0678-82 first but downside should be limited to 1.0602 support and key level at 1.0570 should remain intact.
Recommendation: Buy at 1.0780 for 1.0980 with stop below 1.0680.
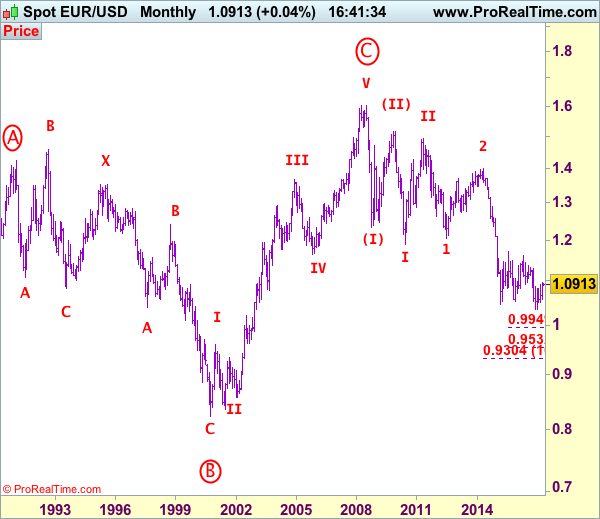
Euro's long-term uptrend started from 0.8228 (26 Oct 2000) with an impulsive structure. The rise from 0.8228 to 0.9593 (5 Jan 2001) is labeled as wave I, the retreat to 0.8352 (6 Jul 2001) is wave II and the rally to 1.3670 (31 Dec 2004) is wave III. Wave IV from there ended at 1.1640 (15 Nov 2005), the subsequent upmove to 1.6040 (July 15, 2008) is treated as wave V, the major selloff from the record high of 1.6040 to 1.2329 (October 27, 2008) signals a reversal has taken place with (I) leg ended at 1.2329 and once (II) ended at 1.5145, wave (III) itself is an extended move with I: 1.1876 and complex wave II ended at 1.4902, wave III has commenced with wave 1 and 2 ended at 1.2042 and 1.3993 respectively, wave 3 of III is now unfolding for weakness towards parity.
Technical Outlook: AUDUSD – Limited Upside Signals Extended Consolidation Before Bears Resume
The Aussie stays at the back foot on Monday after failing to regain highs of Thu/Fri at 0.7428/28 after long-tailed daily candles of past two days signaled strong downside hesitation. With firmly bearish daily studies in play, extended narrow consolidation would be seen as likely near-term scenario, before larger bears resume. Close below cracked 0.73869 support (Fibo 61.8% of 0.7163/0.7747 rally and break below last week's low at 0.7366, is needed to signal fresh downside action towards strong support at 0.7329 (weekly cloud base) and 0.7301 (Fibo 76.4%) in extension. Falling daily Tenkan-sen at 0.7460 is expected to cap extended upticks and keep bears intact.
Res: 0.7428, 0.7438, 0.7460, 0.7502
Sup: 0.7386, 0.7366, 0.7329, 0.7301
USD/JPY Elliott Wave Analysis
USD/JPY - 112.48
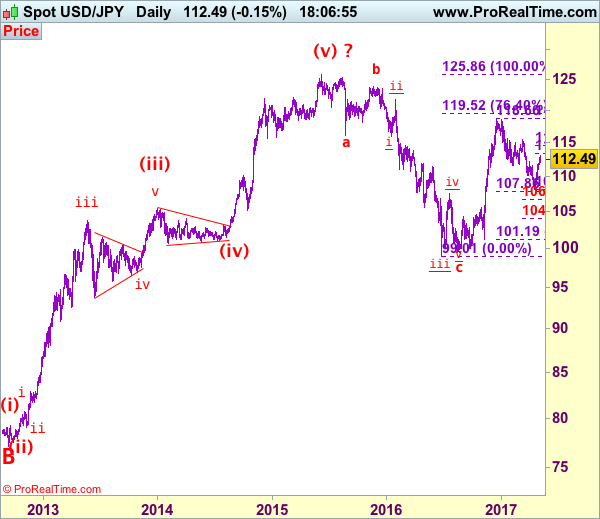
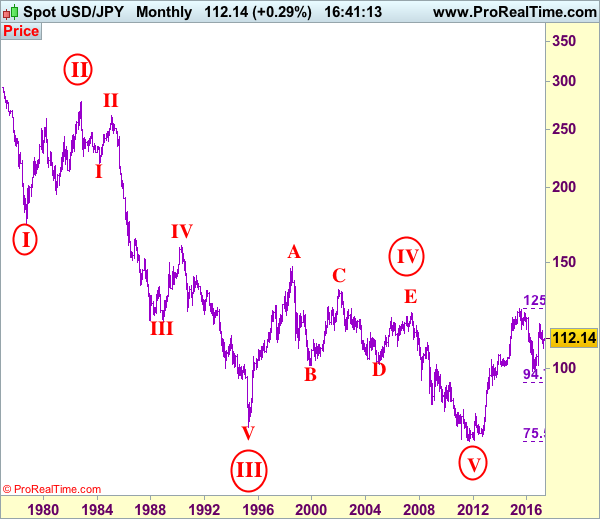
USD/JPY – Wave V of larger degree circle V has possibly ended at 75.31 and major correction has commenced and already met indicated target at 125.00.
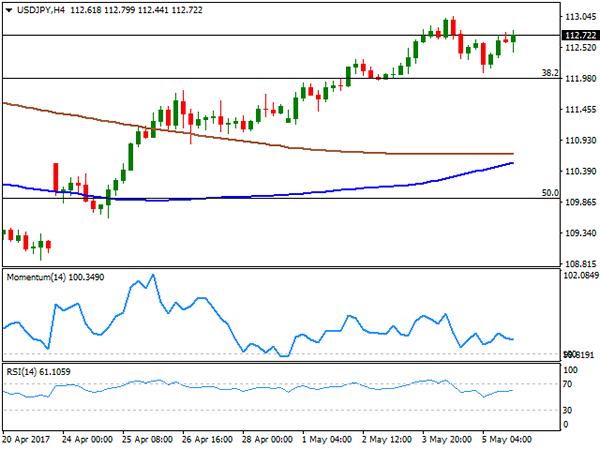
The greenback did rise to our indicated upside target at 113.00 and although price has eased from 113.05 and minor consolidation below this level would be seen, reckon downside would be limited to 111.90-00 and renewed buying interest should emerge above 111.20-30, bring another rise later, above said resistance at 113.05 would extend the rise from 108.13 low to indicated dynamic resistance at 113.35-40 (50% Fibonacci retracement of 118.66-108.13). Having said that, a daily close above there is needed to retain bullishness and suggest the entire fall from 118.66 has ended at 108.13, then further gain to 114.00 and possibly 114.60-65 (61.8% Fibonacci retracement) cannot be ruled out but price should falter below key resistance at 115.15, bring retreat later.
Our preferred count is that, triangle wave IV (with circle) ended at 101.45 and the circle wave V brought dollar down to the record low of 75.31 in 2011 and the subsequent rebound signal major correction has commenced with A leg ended at 84.19, followed by wave B at 77.14 and impulsive wave C is now unfolding (indicated upside target at 125.00 had been met) for gain towards 127.00 level. In the event dollar drops below support at 99.01, this would confirm medium term decline from 125.86 top (2015 high) has resumed for subsequent weakness to 98.00 and possibly 97.00.
Under this count, this wave C is unfolding as impulsive waves with (1) (2), 1 2 ended at 80.67, 79.07, 82.84 and 81.69 respectively, hence the extended wave 3 has ended at 103.74 and wave 4 correction of recent upmove should bring weakness to 92.57, then towards 90.88 but psychological support at 90.00 should limit downside and bring another rally later in wave 5, indicated target at 125.00 had been met and gain to 127.00 cannot be ruled out but reckon price would falter below 130.00.
On the downside, whilst initial pullback to 112.00 cannot be ruled out, reckon downside would be limited to 111.00-10 and bring another rise later. Below previous resistance at 110.60 (now support) would defer and suggest the rebound from 108.13 has possibly ended, bring weakness to 110.00, however, still reckon downside would be limited to 109.55-60 and price should stay well above said recent low at 108.13, bring another rebound later.
Recommendation: Buy at 111.50 for 113.30 with stop below 110.50.
On the monthly chart, we have changed our preferred count that an impulsive wave is unfolding with major wave III with circle ended at 79.75, then followed by wave IV with circle and is labeled as a triangle with A: 147.64 (11 August, 1998), B: 101.25, C: 135.20, D: 101.67 and E leg ended at 124.14 to end the wave IV with circle. Hence, wave V with circle commenced from there and hit a record low of 75.31, however, the subsequent strong rebound signals this circle wave V has possibly ended there, hence gain to (indicated upside target at 122.00 and 125.00 had been met), the retreat from 125.86 suggests wave A of major correction has ended there and wave B correction back to 99.00, then 95.00 would be seen, however, reckon downside would be limited to 90.00, bring another rebound in wave C next year.
Technical Outlook: USDJPY – Close Above Daily Cloud To Signal Bullish Continuation
Renewed probe above daily cloud top (112.85) on Monday was capped at 112.95 and so far unable to sustain break. Close above daily cloud is required to confirm bulls for extension through 113.13 (100SMA) towards initial target at 113.38 (Fibo 38.2% of 118.65/108.11 descend) and to 113.75 (Fibo 76.4% of 115.49/108.11 downleg). Strong bullish stance is reinforced by 10/30SMA's bull-cross). However, bulls may be delayed as bearish signal is coming from reversal of overbought slow stochastic on daily chart. Dips are expected to ideally hold above daily cloud base at 111.96, reinforced by rising daily Tenkan-sen (which contained downside attempts on Friday) to avert risk of deeper correction, expected on return below daily cloud.
Res: 112.85, 113.13, 113.38, 113.75
Sup: 112.49, 111.95, 111.80, 111.15
Foreign Exchange Market Commentary: EUR/USD, USD/JPY, GBP/USD, GOLD, WTI CRUDE, DJIA, FTSE100, DAX
EUR/USD
A stronger-than-expected US nonfarm Payroll report released on Friday failed to boost demand for the American currency, which closed the week mostly lower across the board. The US economy managed to add 211,000 new jobs in April, whilst the unemployment rate fell to 4.4% amid a decline in the participation rate to 62.9%. Wages were soft, up by 0.3% monthly basis as expected, and 2.5% year-on-year, below previous 2.7%. The figures were enough to keep the Fed in the tightening path, with odds of a June rate hike up to 90% after the report. Still, market's attention quickly shifted to the upcoming developments in Europe, as this Sunday France will go back to the polls to define whether Macron or Le Pen is becoming the new president. Polls show a strong lead of the centrist candidate, and the market rushed to price in further political relief in the EU.
The EUR/USD pair flirted with 1.1000 at the weekly close, and chances of an upward gap, although smaller than the one seen a couple of weeks ago, are limited. A surprise victory of Le Pen, on the other hand, should trigger chaos across the board, with high-yielding currencies plunging even beyond pre-French election first round levels, and safe-haven yen soaring.
From a technical point of view, the pair is poised to extend its advance after breaking through the 1.0930/50 region, where the pair has the 61.8% retracement of the post-US election slump and former yearly highs. Daily basis, technical indicators have resumed their advances after a modest downward correction and stand near overbought territory, whilst the 20 SMA accelerated its advance after surpassing the larger ones, now at the mentioned 1.0930/50 region. Shorter term, the 4 hours chart shows that the 20 SMA is also heading north in the mentioned price zone, whilst technical indicators aim higher within positive territory.
Support levels:1.0950 1.0900 1.0855
Resistance levels: 1.1045 1.1080 1.1120
USD/JPY
The USD/JPY pair closed with gains for a third consecutive week at 112.72, after setting a weekly high of 113.04 early Thursday, after the US Federal Reserve monetary policy meeting showed that policy makers were not concerned about Q1 data, considering it a transitory set back in the growing path. The yen edged marginally lower on Friday, supported by strong rallies in equities and a US Nonfarm Payroll report, although gains were limited by mute Treasury yields. The 10-year benchmark closed the week at 2.35%, retreating from previous 2.36%, while the 2-year yield ended unchanged at 1.31%. Japan will come back after the Golden Week holiday with April's consumer confidence index this Monday, expected at 44.3 from previous 43.9. In the meantime the technical picture still favors the upside, given that in the daily chart, the price has settled a few pips above its 100 SMA for the first time since mid March, whilst the 200 DMA advances well below the shortest. The Momentum indicator in the mentioned time frame eased modestly within overbought territory, but the RSI indicator holds ground around 65. In the 4 hours chart, technical indicators are horizontal within positive territory, whilst the price develops far above its moving averages, overall indicating limited upward strength at the time being. An upward acceleration beyond 113.00 is now required to confirm a new leg higher that can extend up to 114.40, a major static resistance this week.
Support levels: 112.45 112.00 111.60
Resistance levels: 113.00 113.30 113.70
GBP/USD
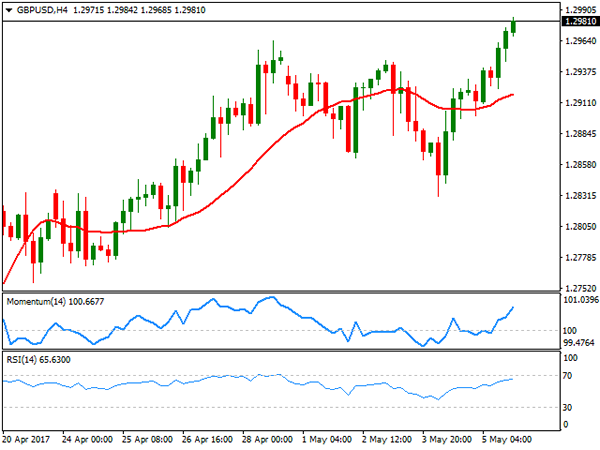
The GBP/USD pair closed the week at 1.2981, its highest since September last year, as strong UK data released all through the week offset rough preliminary Brexit talks. The PMIs all strengthened above expected in April, indicating that the economy remains strong. Also PM Theresa May called for early parliamentary elections a couple of weeks ago, a wise move that will give her legal popular backup, ahead of the official talks. The daily chart for the pair shows that the Momentum indicator bounced modestly from its 100 level as the price surpassed the top of its recent range, while the RSI indicator also resumed its advance and stands near overbought territory. The pair bottomed at 1.2830 this past week, near a sharply bullish 20 DMA that is now reinforcing the static support area. Shorter term, and according to the 4 hours chart, the price advanced above a still directionless 20 SMA, this last around 1.2920, while technical the Momentum indicator regained its upward strength, reaching fresh 2-week highs, and also leaning the scale towards the upside.
Support levels: 1.2965 1.2920 1.2880
Resistance levels: 1.3010 1.3060 1.3100
GOLD
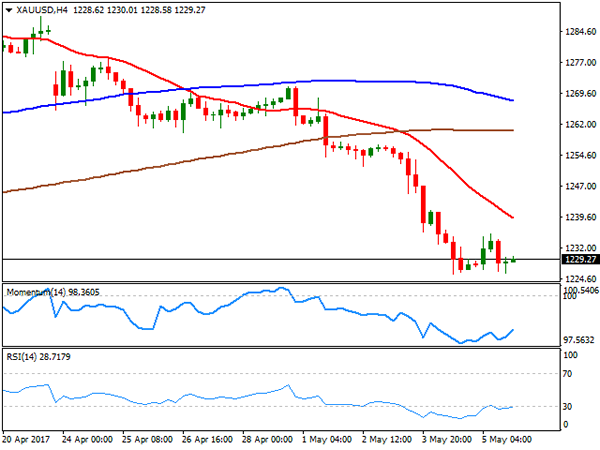
Gold prices plummeted this past week, with spot settling at $1,229.27 a troy ounce, is lowest since mid March. The bright metal suffered the worst week for this year, as the US Federal Reserve confirmed its view on local growth, while a solid employment creation in April supported the case for a June hike. Another factor weighing on the commodity is easing political concerns in the EU. Gold has fallen as low as $1,225.66 this week, and from a technical point of view, the risk remains towards the downside, given that in the daily chart, the price fell below its 100 and 200 DMAs, both converging around 1,234.40, from where the commodity retreated on an attempt to advance last Friday. In the same chart, technical indicators have lost bearish strength near oversold readings, but remain nearby, with no signs of changing route. Shorter term, and according to the 4 hours chart, technical indicators hold within oversold territory, while the 20 SMA heads sharply lower well above the current level, in line with further slides particularly on a break below the mentioned low.
Support levels: 1,225.60 1,214.10 1,203.80
Resistance levels: 1,234.40 1,242.50 1,250.90
WTI CRUDE OIL
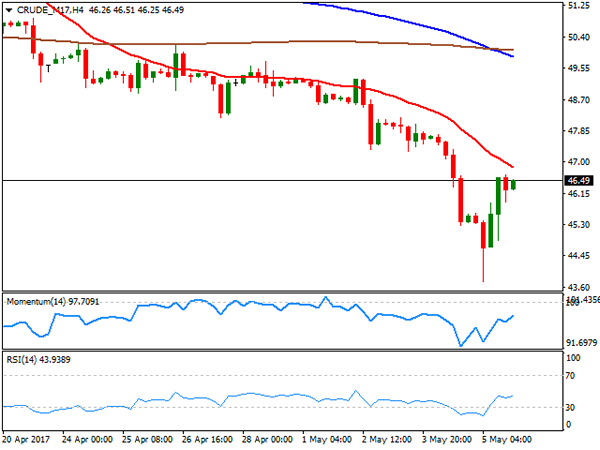
West Texas Intermediate crude oil futures plunged to $43.75 a barrel early Friday, but managed to bounce back afterwards, ending the week anyway in the red at 46.49. There was not a certain catalyst beyond the early decline, although sentiment towards the commodity is generally negative, dented by increasing US production that offset OPEC efforts to deal with the worldwide glut. The Baker Hughes report released on Friday showed that the number of active rigs drilling oil in the US climbed to 703, up for 16th consecutive week. Despite the bounce, WTI closed at levels last seen on December 2016 and the daily chart shows that technical indicators have managed to bounce some, but are still within oversold readings, whilst the price is far below all of its moving averages, maintaining the risk towards the downside. In the 4 hours chart, a strongly bearish 20 SMA caps the upside around 47.10, while technical indicators have managed to correct extreme oversold readings, but remain well below their mid-lines, in line with the longer term perspective.
Support levels: 45.90 45.30 43.70
Resistance levels: 47.10 47.75 48.50
DJIA
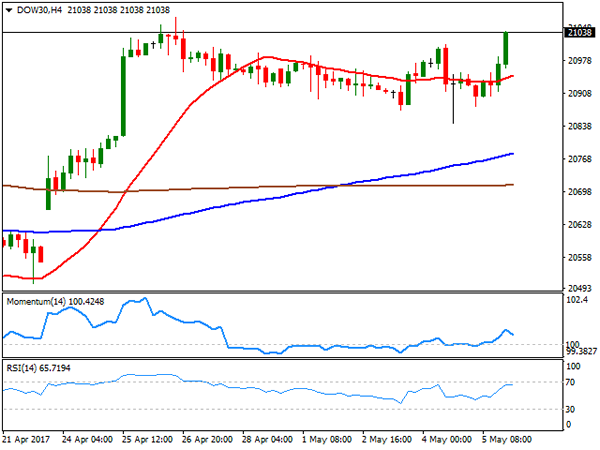
US major indexes advanced on Friday, closing their third consecutive week with gains, backed by a bounce in oil prices and a solid job's creation in April following March´s disappointment. The Dow Jones Industrial Average advanced 55 points and closed at 21,006.94, while the Nasdaq Composite added 0.42%, to 6,100.76. The S&P closed at record highs after adding 0.41%, helped by a strong advance in the energy sector, ending the week at 2,399.29. Within the Dow, El du Point led advancers, adding 2.98%, followed by Verizon Communications that gained 1.77%. IBM was the worst performer shedding 2.51%, followed by Nike that closed 0.95% lower. Daily basis, the DJIA settled at the upper end of its last three-week range, and seems poised to extend its advance, given that technical indicators in the mentioned time frame turned sharply higher within positive territory, as the index keeps developing above its moving averages. In the 4 hours chart, technical indicators lost upward strength and turned marginally lower within positive territory, but the index holds around its daily high and above bullish moving averages, also supporting further gains, particularly on a break above 21,071, April monthly high.
Support levels: 20,986 20,939 20,898
Resistance levels: 21,071 21,138 21,180
FTSE100
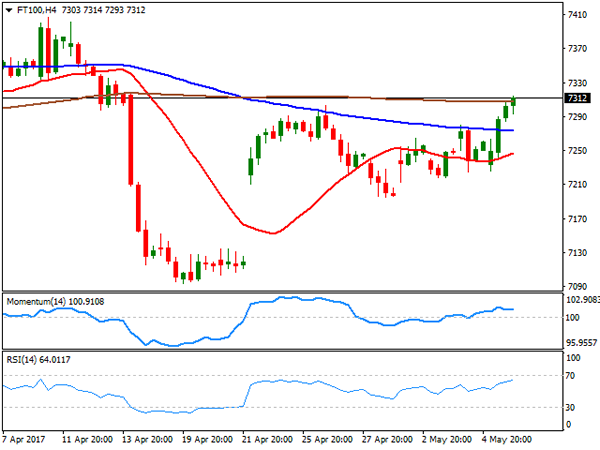
The FTSE 100 ended the week at 7,297.43, up 49 points or 0.68% on Friday, backed by another batch of strong earnings reports. Pearson was the best performer, adding 12.39% after launching a "strategic review" and announcing plans to cut costs by £300m a year by the end of 2019. International Consolidated Airlines added 5.51% after announcing that underlying operating profit rose by 9.7%. ITV was the worst performer, ending the day down 2.61%, followed by Barclays that shed 2.60%. The index hovers around a three-week high ahead of the weekly opening, gaining upward potential, as in the daily chart, it recovered strongly above a 100 DMA after hovering around it for most of the past week, also breaking above its 20 DMA for the first time in nearly a month. Technical indicators in the mentioned chart head north around their mid-lines, not yet confirming a sustainable recovery. Shorter term, and according to the 4 hours chart, the risk is also towards the upside, although additional confirmations are required, as indicators hold flat above their mid-lines whilst the index settled a few points above a horizontal 200 SMA.
Support levels: 7,284 7,247 7,200
Resistance levels: 7,332 7,385 7,439
DAX
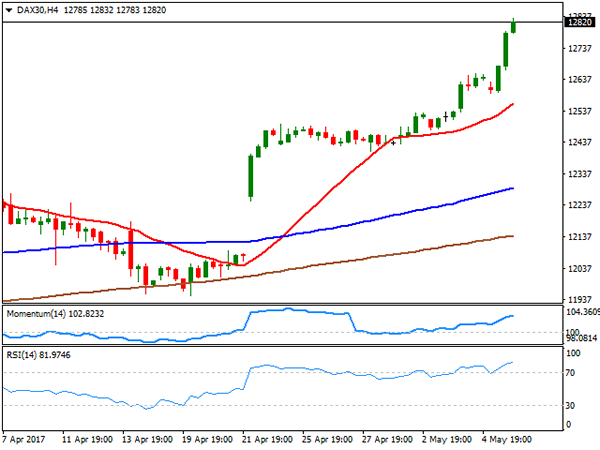
The German DAX advanced 69 points or 0.55% on Friday, to close at 12,716.89, a fresh record high. The benchmark was supported by strong local data released all through the week, rallying further amid easing political concerns in the region, as the market has pretty much fully priced in a Macron's victory in France spooking fears of rising populism in Europe. Only three components closed in the red, with E.ON down 1.16%, followed by ProSiebenSat.1 Med that shed 0.40%. Deutsche Bank on the other hand was the best performer, up 2.78%, followed by Linde that added 2.65%. Trading at historical levels, the daily chart shows that technical indicators retain their bullish slopes, despite being in extreme overbought levels, whilst the index is far above its moving averages. In the 4 hours chart, indicators are also heading higher within overbought levels, and the index above its moving averages, with further gains expected on a break above 12,832 on a Macron's confirmed victory.
Support levels: 12,789 12,720 12,668
Resistance levels: 12,832 12,880 12,940
Technical Outlook: Cable – Consolidation Is Seen Ahead Of Final Break Above Psychological 1.30 Barrier
Cable hit fresh marginally higher multi-month high at 1.2987 in early Monday's trading but is so far unable to clear psychological 1.3000 barrier.
Overall structure is firmly bullish as the pair rallied for four straight weeks with last week's long-tailed bullish candle underpinning the action.
However, extended hesitation at important 1.3000 barrier could be anticipated, as firmly bullish daily studies are overextended.
Rising daily 10SMA/Tenkan-sen offer solid supports at 1.2900 zone, with extended correction to hold above last week's low at 1.2830 and keep firm bullish structure intact.
Break above 1.3000 barrier would look for extension towards next strong barrier at 1.3088 (base of falling thick weekly cloud).
Res: 1.2987, 1.3000, 1.3088, 1.3101
Sup: 1.2946, 1.2900, 1.2860, 1.2830
EUR Loses Ground Despite Macron Win
Macron wins French Presidency
As widely expected by polls, Emmanuel Macron won the French Presidency with a clear advantage (65% over 35% for Marine Le Pen). Financial markets barely reacted and the single currency is still trading below $1.10. It is worth noting that the euro climbed anyway at 6-month high.
Regarding stocks markets, they were opening lower this morning as investors certainly took profit from the last two weeks’ increase. It seems that there is no relief rally. We believe that this relief rally already happened after the first round. Nonetheless, one may assume that the relief rally are coming from the bonds market where French yields are weakening.
Now, the tricky part is going to come. markets are still unsure if Macron will be able to govern as he needs the majority at the French parliament (the famous third round) which may be difficult to achieve. Indeed Macron’s party “En Marche !” is very young.
Last but not least, Macro mentioned in his speech that he will not give Britain an easy Brexit deal and this may weigh on the pound in the medium term. The British currency was by the way trading mixed this morning.
US jobs report failed to boost USD
Last Friday, the last US labour market report surprised on the upside as the economy created 211k private job in April, beating forecast of 190k. Previous month’s reading was revised slightly to the downside (79k versus 98k first estimate). Similarly, the unemployment rate slid to 4.4% from 4.5%, while the participation rate ticked down to 62.9%. Investors did not get carried away as weak wage pressure remains a significant hurdle for an acceleration of the US economy. Average hourly earnings grew 2.5% year-over-year in April, down from 2.6% in March.
Now that the French election is over, the market will switch focus towards the US. Indeed, the next couple of months will be key for world’s largest economy and global markets. Trump’s reform plan and a potential tightening move from the Fed at its June meeting will be the main driver for now.
Despite Macron’s victory, the greenback started the week on a solid footing, rising roughly 0.40% against the euro, 0.50% against the NOK and 0.30% against the Swiss franc. Asian EM held ground, while European ones moved in negative territory. We expect the dollar to start picking up pretty soon.
Commodity linked CAD Vulnerable
Saudi oil ministers Al-Falih indicated that oil production cuts would likely be extended (which makes sense given the weak oil price). There increasing expectation that the summer driving season will drawdown inventories putting pressure on oil prices. Yet it’s unlikely that OPECS supply side efforts will transfer into the broader crude markets. US oil producers have become extremely nimble in reacting volatility in demand. Baker-Huge data release Friday indicated that rig count increased to 703 the highest levels in April 2015. While the recovery rally in crack-spread suggest that additional player will step into the markets to gain additional refining margins.
Oil prices have been able to climb off the technical support low at $46 brl. However, Relief rally in commodities especially raw material prices fails to have any fundamental rational and gains in commodity-linked currencies are not likely to get sustained buying. CAD was able to find demand on the back of stronger oil prices but with weakness creeping in and markets expected to turn its focus back onto the Fed, USDCAD should head higher. USDCAD bullish trend is valid regardless of Friday reversal pattern, pause at 1.3650 further expectations that supply has been absorbed (IMM showed extension of CAD shorts). Canada will release April Housing Starts which expected to rise 215k after a strong 253k March read. A weak read will reinforce Canada’s softer economic growth outlook highlighted by the BoC.
Macron Becomes The New President Of France
Emmanuel Macron won the French Presidency by a wider-than-expected margin, beating Marine Le Pen by roughly 66% to 34%. The euro opened with a small positive gap against its major counterparts, but quickly gave back all its gains to trade even lower in the following hours. Considering that Macron's victory was widely anticipated, we think that this may have been due to investors locking in profits on existing EUR/USD-long positions near the psychological zone of 1.1000.
EUR/JPY gapped up as well, but hit resistance slightly below the 124.65 (R2) barrier and then it retreated. The price structure on the 4-hour chart still suggests a short-term uptrend. However, taking a look at our short-term oscillators, we see the likelihood for the corrective setback to continue for a while, perhaps for another test near the 123.00 (S1) support level. The RSI exited its above-70 territory, while the MACD, although positive, lies below its trigger line and points somewhat down.
With political risks now out the way – at least until the German election in September – we believe that market participants are likely to turn their attention back to incoming economic data and ECB policy. In that respect, Eurozone's latest CPI data showed that core inflation is at its highest level in 3 years, amplifying the case for the ECB to shift to a more upbeat tune soon. As such, we think the path of least resistance for the euro is to the upside. If EUR/JPY bulls manage to take advantage of a possible setback near 123.00 (S1), we would expect them to aim again for the 124.65 (R2) resistance. A decisive break above that obstacle could trigger extensions towards the 125.50 (R3) territory.
US jobs report: Soft wage growth weighs on the dollar
US nonfarm payrolls rose by 211k in April, data showed on Friday, more than the consensus of 185k. The unemployment rate unexpectedly declined, beating the forecast for an uptick. The only soft aspect of the report was wages. Average hourly earnings rose by +0.3% mom in line with the forecast, but last month's print was revised somewhat lower to +0.1% mom, which dragged the yearly rate down as well. Thus, even though the knee-jerk reaction in the dollar was positive due to the above-expectations NFP, the currency quickly gave back its gains to trade even lower against most of its major counterparts.
Gold traded somewhat higher on Friday, but remained range bound between the 1225 (S1) and 1235 (R1) levels. As long as the yellow metal is trading below the downside line drawn from the peak of the 21st of April, the short-term trend remains negative in our opinion. On Wednesday, after the FOMC meeting, the metal fell below the upside support line taken from the low of the 15th of December, which enhances the case for further declines in the foreseeable future. Nevertheless, for now we see the likelihood for a corrective rebound before sellers decide to take the reins again. A clear move above 1235 (R1) could confirm the case and perhaps aim for the 1240 (R2) or 1245 (R3) resistance hurdles.
Despite the slowdown in wages, this report is still solid overall in our view. Therefore, these data are consistent with the Fed raising rates again soon, something supported by market pricing for a June hike, which rose further after these releases and now rests at 83%. Even though we think a June hike is a likely outcome too, we believe that 83% is overly optimistic at this point. The market is treating a June hike as more or less a done deal, with still 5 weeks to go until that gathering and loads of critical data coming out in the meantime.
Today's highlights:
During the European day, the economic calendar is very light. The only noteworthy indicator we get is Germany's factory orders for March.
We have only one speaker on the agenda: St. Louis Fed President James Bullard.
As for the rest of the week, on Tuesday, we have no major events or indicators on the agenda. On Wednesday, China's PPI and CPI data for April are due out. On Thursday, the RBNZ will announce its rate decision in early Asian time. In the absence of a forecast, we see the case for the officials to take no action again. Later during the day, the Bank of England policy decision will be in focus. This will be a 'Super Thursday' meeting, meaning that besides the rate announcement and meeting minutes, we will also get the quarterly Inflation Report. On Friday, we get US retail sales and CPI data, both for April.
EUR/JPY
Support: 123.00 (S1), 122.60 (S2), 122.00 (S3)
Resistance: 124.00 (R1), 124.65 (R2), 125.50 (R3)
XAU/USD
Support: 1225 (S1), 1218 (S2), 1211 (S3)
Resistance: 1235 (R1), 1240 (R2), 1245 (R3)
Kiwi: Bird Watching In May
NZD shorts may find the going tougher this week as the Kiwi recovers ahead of Thursday's RBNZ decision.
Thursday's RBNZ rate decision will be an important one, not the rate itself which is widely expected to remain unchanged at 1.75%. Traders will be looking for hints that the RBNZ will mollify the dovish stance that they have held for much of the past year.
Certainly, the data coming from New Zealand is supportive of this, most especially the recovery in global dairy prices, New Zealand's largest export. Over in the housing market, the RBNZ's macro-prudential measures seem to be having some effect as well, with house price inflation slowing dramatically, even in Auckland.
The CFTC's Commitment of Traders Report (COT) shows that as of early last week speculative NZD shorts had increased by over 50%. Commodity currencies, in general, had been sold off on geopolitical risk off fears and with the pullback in commodity prices. The thing to note is that the COT short position remains stubbornly high, although New Zealand's main commodity export has clearly seen its lows and the labour market remains very healthy.
With the amount of speculative shorts out there, there is the possibility that a short squeeze could develop should the RBNZ change its wording and/or future rate path guidance.
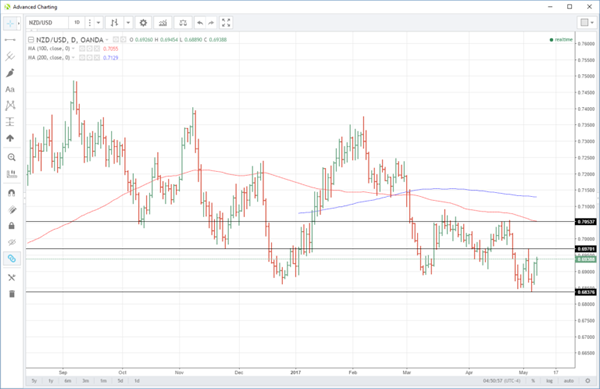
NZD/USD
The Kiwi (NZD/USD) has support at 6835, the low from last Thursday as commodities in Asia melted down across the board. The price action since has been constructive with resistance at 6970.
Above here we have resistance at 7055, the 100-day moving average and a series of daily highs in April. A daily close above here could signal more topside in Kiwi may occur.
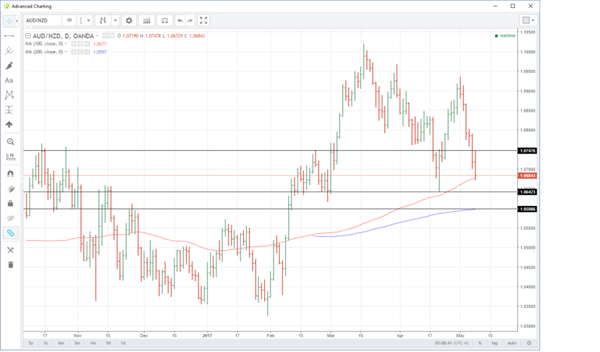
AUD/NZD
It was certainly 'evens' after this weekends Austalia and New Zealand sports events. Something that both countries take far more seriously than the markets usually. The picture is not so clear however on the AUD/NZD cross.
New Zealand's grass eating commodities (dairy), are generally performing better price wise then Austalia's dig out of the ground ones. (copper, coal iron ore, etc.) Likewise, the RBA is clearly well and truly on hold for the foreseeable future as opposed tot he RBNZ where there is now clearly event risk.
The Kiwi has been eroding the AUD/NZD rally at a rate of knots since last week, the cross falling from 1.0940 to below 1.0700 today.
The 1.0700 level is more psychological than technical and forms intra-day resistance with 1.0750 behind. More importantly, AUD/NZD is flirting with its 100-day moving average at 1.0677, with a close below this tonight bearish technically.
Support appears at 1.0640 and then the 200-day moving average at 1.0600.
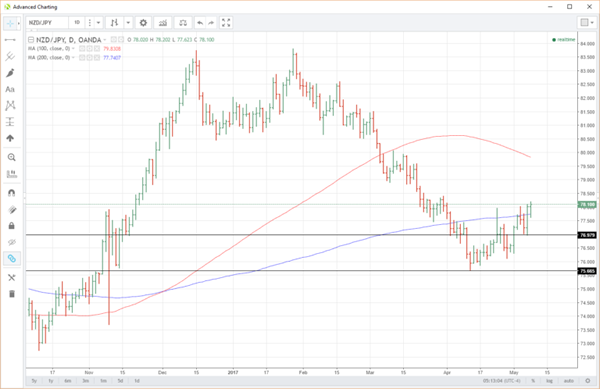
NZD/JPY
NZD/JPY, like AUD/JPY, is a high beta cross towards risk sentiment in the market. NZD/JPY closed above its 200-day moving average overnight in a possibly bullish technical development. This could target a further move towards the 100-day moving average at 79.83.
Support sits at 77.00 and then the April low at 77.65 area.
Overall the Kiwi has traded constructively against some of its G10 counterparts. With the RBNZ Thursday and large short positioning out on the street, there lies the possibility of a meaningful short squeeze to come.