Sample Category Title
Trade Idea Wrap-up: USD/JPY – Stand aside
USD/JPY - 112.77
Most recent candlesticks pattern : N/A
Trend : Near term up
Tenkan-Sen level : 112.63
Kijun-Sen level : 112.69
Ichimoku cloud top : 112.57
Ichimoku cloud bottom : 112.48
New strategy :
Stand aside
Position : -
Target : -
Stop : -
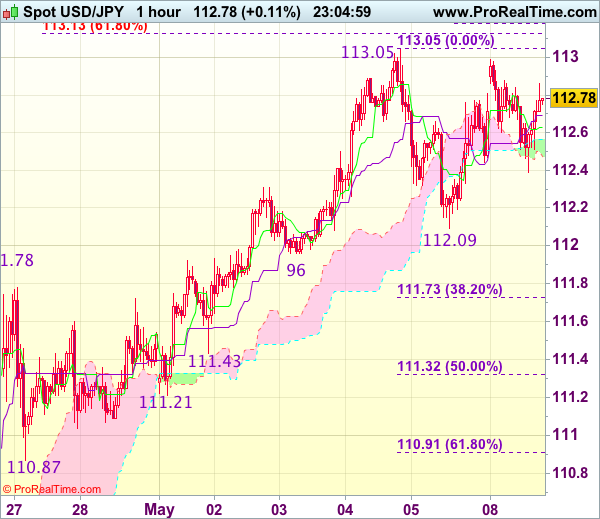
Although the greenback opened higher earlier today, as dollar retreated after faltering below last week’s high at 113.05, suggesting further consolidation below this level would be seen and pullback t 112.40 cannot be ruled out, however, reckon support at 112.09 would limit downside and bring another rise later. Above said resistance at 113.05 would confirm recent upmove has resumed and extend gain to 113.10-15 (61.8% projection of 108.13-111.78 measuring from 110.87) and 113.30 but reckon upside would be limited to previous resistance at 113.54 and price should falter well below 113.90-00.
In view of this, would not chase this rise here and would be prudent to stand aside for now. Below 112.09 support would bring test of 111.96 but break of this level is needed to signal a temporary top has been formed at 113.05, bring correction to 111.73-78 (38.2% Fibonacci retracement of 109.59-113.05 and previous resistance), however, reckon 111.21-32 (previous support and 50% Fibonacci retracement) would contain weakness.
French Elect Emmanuel Macron as President
As widely expected, Emmanuel Macron was elected President of France yesterday, defeating Marine Le Pen by more than 30 percentage points (66.1% for Macron, 33.9% for Le Pen).
Voter abstentions was estimated at about 25%, higher than the 2012 Presidential election abstention rate of about 20%.
Market reaction was limited as a Macron victory appeared largely priced in. The small firming of the EURUSD after the results were announced has since reversed, with the EURUSD selling off enough to be a touch lower than Friday's close. While bond markets barely moved, European equities have sold off, with the French CAC 40 index off close to a full percentage point, and the German DAX down about 0.2% at the time of writing.
Incumbent President Francois Hollande is expected to hand power over to Emmanuel Macron this Sunday (May 14th 2017). However, attention now turns to the legislative elections set for June 11th and 18th.
Key Implications
On the surface Macron's wide margin of victory appears to give Macron a strong mandate to enact a pro-EU, reform agenda. However, an elevated abstention rate along with surveys leading up to the elections this year suggest that voters rejected a populist platform rather than accepted the status quo. French voters, particularly voters under the age of 34, remain concerned about globalization, the EU, domestic corruption, and their economic future. This should raise questions on how much support the President's reform agenda will earn in the coming months.
Although Macron's victory effectively smothers any doubts about the future of the euro and EU for the time being, the legislative elections set for June 11th and 18th remain the greatest source of uncertainty concerning the French economic outlook. Without sufficient support in the French National Assembly, Macron's pro-business reform agenda will be difficult to implement. A failure to enact some economic reforms could delay the French economic recovery and prolong unemployment. Elevated unemployment, together with rising income inequality, will likely continue to fuel the embers of populism in France and abroad.
Euro Falls Orey to Post-Macron Profit Taking
Headlines
European equity markets were hit by a buy-the-rumour, sell-the-fact reaction after Macron won the presidency. The CAC-40 which outperformed last Friday, underperformed now, with losses of about -0.9%. US stock markets opened nearly unchanged, while European equities are struggling off intra-day lows.
Cleveland Fed Mester said that the central bank should continue on its gradual path of raising interest rates to prevent the risk of overheating the US economy. Mester also repeated that she would like to see the Fed change its policy this year that keeps its $4.5 trillion balance sheet at a steady level.
EMU Sentix investor sentiment hit its highest level in almost a decade in May (27.4 from 23.9), improving more than expected (25.2) thanks to a strong assessment of the current economic situation and expectations that political uncertainty will diminish.
The ECB is close to replacing its negative view on whether the EMU economy will reach growth targets with a neutral one, and should adjust its policy guidance accordingly, ECB Mersch said. As growth picks up and labour markets tighten, inflation should also rebound, leading to a discussion about normalising monetary policy, he added.
Rates
European buy-the-rumour, sell-the-fact; US selling
A buy-the-rumour, sell-the-fact reaction following Macron's presidential elections victory characterised European trading amid an empty eco calendar. European equities, the single currency and core bond yields slid marginally lower. ECB Mersch argued in favour of changing the ECB's forward guidance in order to put in line with economic reality (good growth momentum, picking up inflation). Core bond topped out around the start of US trading and soon returned earlier gains even if Brent crude gradually drifted lower after failing to regain the $50/barrel mark. The US' upcoming supply operation might have played a role in absence of eco data. The US Note future is once again testing 125-04+/03+ support (previous high/38% retracement). Cleveland Fed Mester confirmed her hawkish profile, warning for falling behind the curve. St. Louis Fed Bullard, the central bank's arch-dove, plead again in favour of keeping interest rates low for a prolonged period because the economy suffers from the low productivity and low labor-force growth and as investors want safe assets.
At the time of writing, the US yield curve trades 1.2 bps (5-yr) to 1.7 bps (2-yr) higher. Changes on the German yield curve vary between -0.4 bps (10-yr) and +1.4 bps (2-yr). On intra-EMU bond markets, 10-yr yield spread changes versus Germany are nearly unchanged with Italy underperforming (+5 bps; anticipating supply) and Greece outperforming (-12 bps).
Currencies
Euro falls prey to post-Macron profit taking
Markets corrected slightly from last week's European risk-on trade today. The buy-the-rumour, sell-the-fact correction after Macron's victory also caused a modest reversal on last week's gain in the likes of EUR/USD, EUR/JPY and USD/JPY. EUR/USD tested the 1.10 level overnight, but returned to the mid 1.90 area. Also USD/JPY failed to regain the 113 level in a sustainable way. The pair trades currently around 112.75.
Asian risk sentiment remained constructive after Macron's French presidential election, but equity gains were modest after all. USD/JPY opened north of 113 on Macron's victory, but soon returned to the 112.75 area. EUR/USD reacted in a similar way. The pair opened north of 1.10, but returned to the 1.0960/80 area at the start in Europe. There was little (economic) news to guide currency trading. Good German order data suggested a good start to the second quarter, but didn't help the euro. Markets recently largely anticipated a Macron victory. The Macron risk-trade even fell prey to modest profit taking and FX markets joined this correction trade. EUR/JPY, USD/JPY and EUR/USD all returned south, reversing part of their recent rebound. Interest rate differentials (US-GE) didn't have any impact. If anything, they narrowed slightly in favour euro. EUR/USD dropped to the 1.0950 area. The setback in USD/JPY was modest. The pair returned to the 112.50 area. There were also no important data in the US. US investors initially joined the European FX trends. The euro remained in the defensive, but the pace of this morning's correction is slowing. EUR/USD trades in the 1.0940/45 area. The downside in USD/JPY was better protected as US equities outperformed Europe and are holding within reach of the recent highs. USD/JPY hovers in the mid 112.50/75 area.
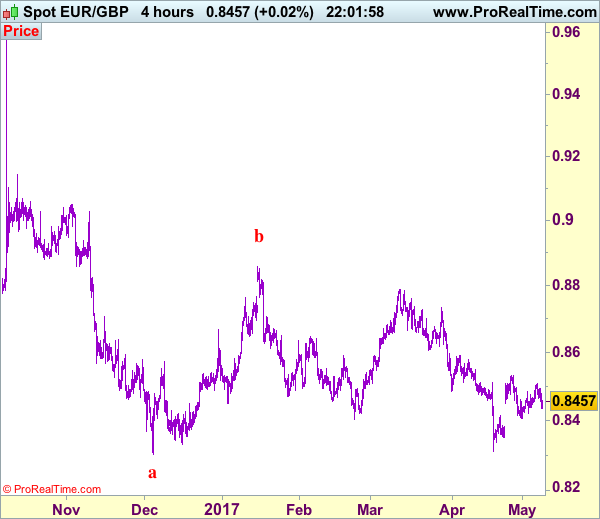
EUR/GBP captured by overall euro correction
According to the Halifax House price measure, UK house prices rose 3.8% Y/Y in the three months to April, unchanged from March. The outcome was marginally higher than expected , but remains at the slowest pace since May 2013, indicating some post-Brexit caution. The report had little impact on sterling trading. Trading in the UK currency was dominated by the global post-Macron reaction. EUR/GBP also corrected south and trades currently in the 0.8450 area. The decline of EUR/USD also weighted slightly on cable. The pair trades in the 1.2950/60 area. Later this week, sterling traders will gradually look forward to the BoE's policy meeting. After the policy decision the BoE will also publish its quarterly inflation report.
Trade Idea: EUR/GBP – Stand aside
EUR/GBP - 0.8454
Recent wave: Major double three (A)-(B)-(C)-(X)-(A)-(B)-(C) is unfolding and 2nd (A) has possibly ended at 0.6936.
Trend: Near term down
New strategy :
Stand aside
Position : -
Target : -
Stop : -
Despite Friday’s rise to 0.8509, the subsequent retreat has retained our view that further consolidation would be seen but reckon 0.8420-25 would limit downside and support at 0.8405 would remain intact. Only a drop below this level would signal the rebound from 0.8312 has ended, bring further fall to 0.8370-75 but support at 0.8351 should remain intact, bring another rebound later.
On the upside, above 0.8490-95 would bring test of said resistance at 0.8509, however, reckon upside would be limited to resistance at 0.8531 and bring retreat later. Only a break of this level would add credence to our view that a temporary low has been formed at 0.8312 and extend the rebound from there for retracement of recent decline to 0.8550, however, reckon resistance at 0.8580 would limit upside and 0.8600-10 would hold from here. As near term outlook is mixed, would be prudent to stand aside in the meantime.
Our preferred count is that, after forming a major top at 0.9805 (wave V), (A)-(B)-(C) correction is unfolding with (A) leg ended at 0.8400 (A: 0.8637, B: 0.9491 and 5-waver C ended at 0.8400. Wave (B) has ended at 0.9413 and impulsive wave (C) has either ended at 0.8067 or may extend one more fall to 0.8000 before prospect of another rally. Current breach of indicated resistance at 0.9043 confirms our view that the (C) leg has ended and bring stronger rebound towards 0.9150/54, then towards 0.9240/50.
Canadian Housing Starts Maintained Momentum in April, But Will it Last?
Highlights:
- Housing starts fell to still-strong 214k annualized units in April from a five-year high of 252k in March.
- Both urban multi-unit and single-unit starts came off of multi-year highs but remained above their recent trend.
- The pullback in urban starts was broadly-based with Ontario, Quebec and the Prairies all recording declines in April
- Those regions, led by Ontario, have accounted for the substantial increase in year-to-date housing starts relative to April 2016.
- Building permits have been quite strong over the past six months; data for March will be released tomorrow.
Our Take:
Even with a pullback in April, homebuilding activity has started the year at its fastest pace since 2008. That's no surprise given record resales and rising home prices that are surely enticing builders. Growth has been broadly-based but, as you might expect, Ontario continues to lead the way with decade-high starts over the last year. That trend could be on its last legs, however, given new regulations introduced by the Ontario government in April. The hallmark of their Fair Housing Plan is a 15% tax on foreign speculators in the GTA and surrounding area. A similar tax implemented in Vancouver last year contributed to a slowing trend in resales and had some effect in lowering prices. Toronto may already be seeing an impact from the new policy as a surge in new listings in April helped push the market closer to supply-demand balance. Any slowdown in the Toronto market and other areas of the province will likely spill over into homebuilding activity. At the national level, we expect moderation in both resales and housing starts over the second half of the year (albeit with levels remaining strong) will put an end to the residential sector's strong contributions to GDP growth, including an expected half percentage point lift in the first quarter.
EUR/JPY Falls Below Uptrend Line
During the early Monday Asian session EUR/JPY hit a high of 124.49, last seen on May 12 of 2016, helped by Macron's victory in the French presidential election.
However, it saw a subsequent retracement, due to profit taking, falling back below the psychological level at 124.00.
On the 4-hourly chart, EUR/JPY broke through the near-term major uptrend line support, indicating the bullish momentum has been waning.
The current price still holds above the psychological support level at 123.00, where there is stronger support.
If the downtrend further breaks this level it is likely that it will see an extended falling in price.
The daily Stochastic Oscillator reading is above 80, suggesting a pullback.
The resistance level is at 123.40, followed by 123.60 and 124.00.
The support line is at 123.00, followed by 122.60 and 122.30.
Keep an eye on ECB Governor Draghi's speech at 12:00 BST on Wednesday May 10. It will likely affect EUR and the EUR crosses.
Trade Idea: USD/CAD – Buy at 1.3540
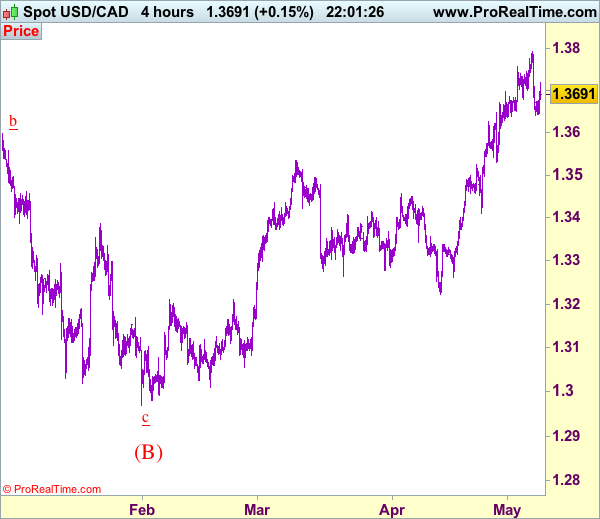
USD/CAD - 1.3691
Recent wave: Only wave v of c has ended at 0.9407 and wave C of major A-B-C correction is underway for headway to 1.4700
Trend: Near term up
Original strategy :
Buy at 1.3540, Target: 1.3750, Stop: 1.3480
Position: -
Target: -
Stop: -
New strategy :
Buy at 1.3540, Target: 1.3750, Stop: 1.3480
Position: -
Target: -
Stop:-
As the greenback retreated after rising to 1.3794, retaining our view that further consolidation below this level would be seen and correction to 1.3635-40 is likely, however, reckon downside would be limited to 1.3600 and support at 1.3530 should hold, bring another rise later, above said resistance at 1.3794 would extend gain to 1.3840-50 but near term overbought condition should prevent sharp move beyond there and price should falter below 1.3890-00, risk from there is seen for a retreat to take place later.
In view of this, would not chase this rise here and would be prudent to buy again on further subsequent pullback as 1.3530 support should limit downside. A firm break below this level would abort and signal a temporary top is formed instead, risk correction to 1.3500 and later towards 1.3450-60 but support at 1.3411 should remain intact, bring another upmove later.
To recap, wave B from 1.3066 is unfolding as an a-b-c and is sub-divided as a: 1.2192, b: 1.2716 and wave c is a 5-waver with i: 1.1983, ii: 1.2506, extended wave iii with minor iii at 1.0206, wave iv ended at 1.0781 and wave v as well as wave iii has ended at 0.9931, hence the subsequent choppy trading is the wave iv which is unfolding as (a)-(b)-(c) with (a) leg of iv ended at 1.0854, followed by (b) leg at 1.0108 and (c) leg as well as the wave iv ended at 1.0674. The wave v is sub-divided by minor wave (i): 0.9980, (ii): 1.0374, (iii): 0.9446, (iv): 0.9913 and (v) as well as v has possibly ended at 0.9407, therefore, consolidation with upside bias is seen for major correction, indicated target at 1.3700 and 1.4000 had been met and further gain to 1.4700 would be seen later.
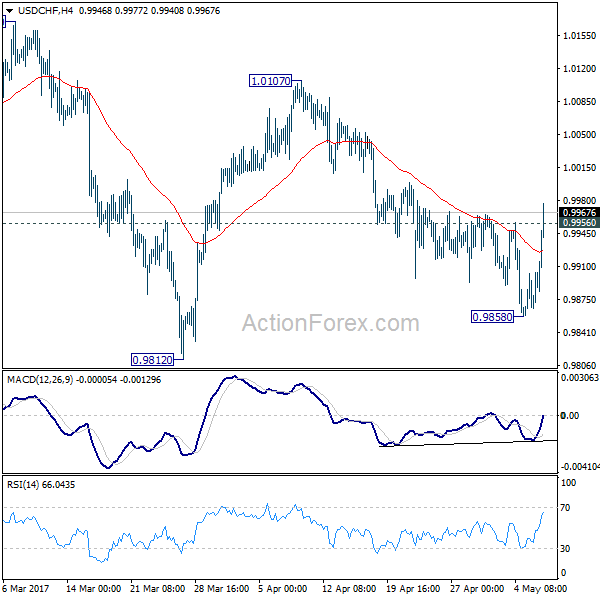
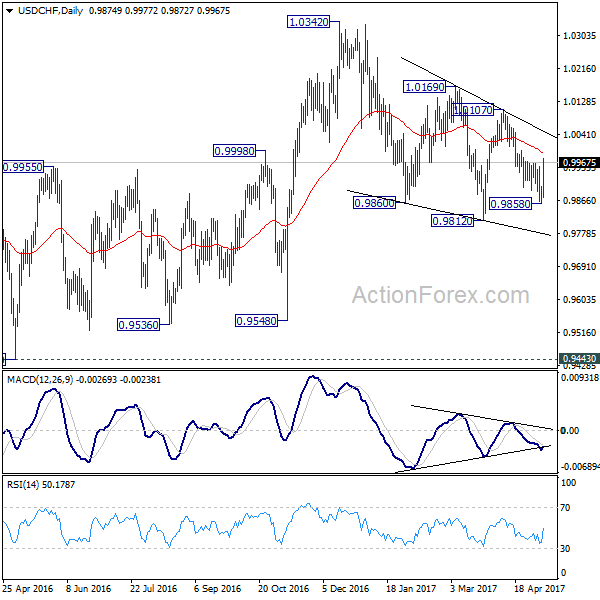
USD/CHF Mid-Day Outlook
Daily Pivots: (S1) 0.9847; (P) 0.9875; (R1) 0.9895; More.....
USD/CHF's strong rebound and break of 0.9956 suggests that fall from 1.0107 has completed at 0.9858 already, on bullish convergence condition in 4 hour MACD. The development also revives the case that correction from 1.0342 is already completed at 0.9812. Intraday bias is turned back to the upside for 1.0107 resistance first. Break there will target a test on 1.0342 high. Nonetheless, break of 0.9858 will turn bias to the downside and target 0.9812 and below.
In the bigger picture, we're still maintaining that firm break of 1.0342 key resistance is needed to confirm underlying bullish momentum in the pair. However, the corrective nature of the fall from 1.0342 is starting to give the medium term outlook a bullish favor. Hence, in stead of looking for topping signal around 1.0342, we'd now pay closer attention to upside acceleration as USD/CHF approaches this level again.
GBP/USD Mid-Day Outlook
Daily Pivots: (S1) 1.2921; (P) 1.2952; (R1) 1.3005; More...
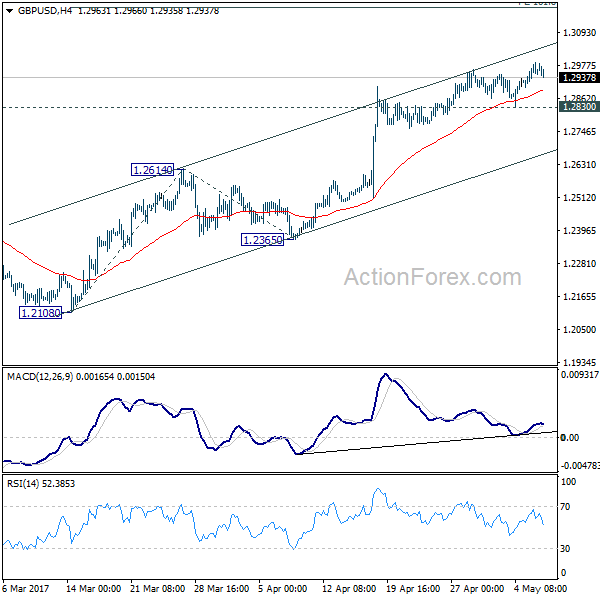
Intraday bias in GBP/USD remains on the upside and current rise should target 161.8% projection of 1.2108 to 1.2614 from 1.2365 at 1.3184. At this point, price actions from 1.1946 are still interpreted as a correction pattern. Therefore, we'd expect strong resistance below 1.3444 to bring larger down trend resumption. On the downside, break of 1.2830 support will indicate short term topping. In such case, intraday bias will be turned back to the downside for 1.2614 support.
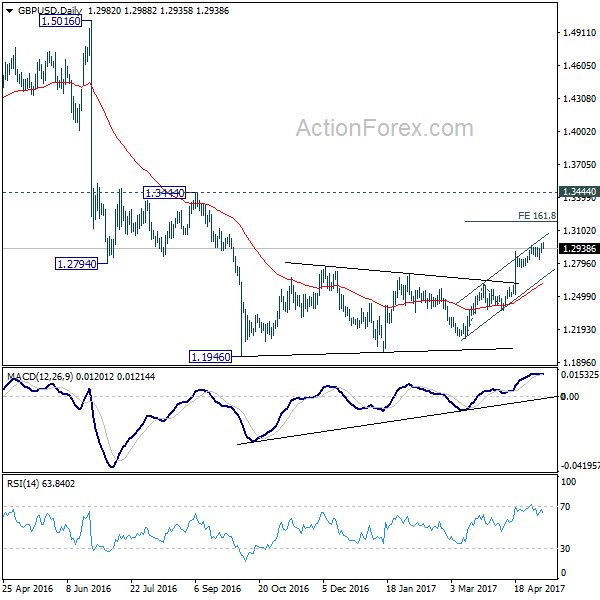
In the bigger picture, fall from 1.7190 is seen as part of the down trend from 2.1161. There is no sign of medium term reversal yet. Sustained trading below 61.8% projection of 2.1161 to 1.3503 from 1.7190 at 1.2457 will target 100% projection at 0.9532. Overall, break of 1.3444 resistance is needed to confirm medium term bottoming. Otherwise, outlook will remain bearish.
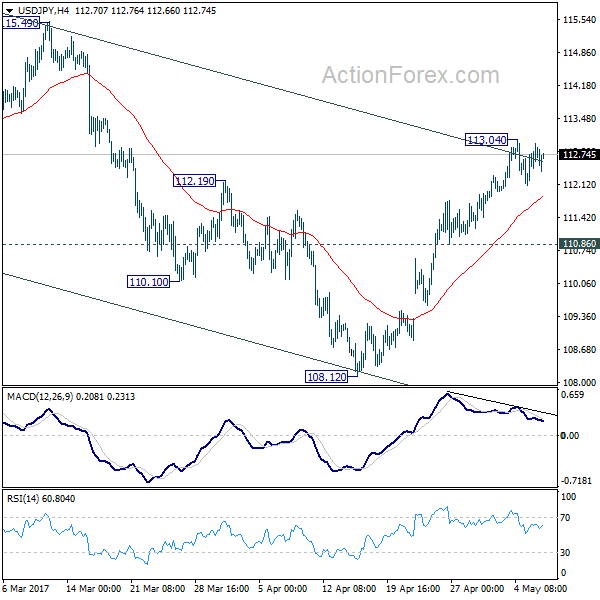
USD/JPY Mid-Day Outlook
Daily Pivots: (S1) 112.23; (P) 112.52; (R1) 112.95; More...
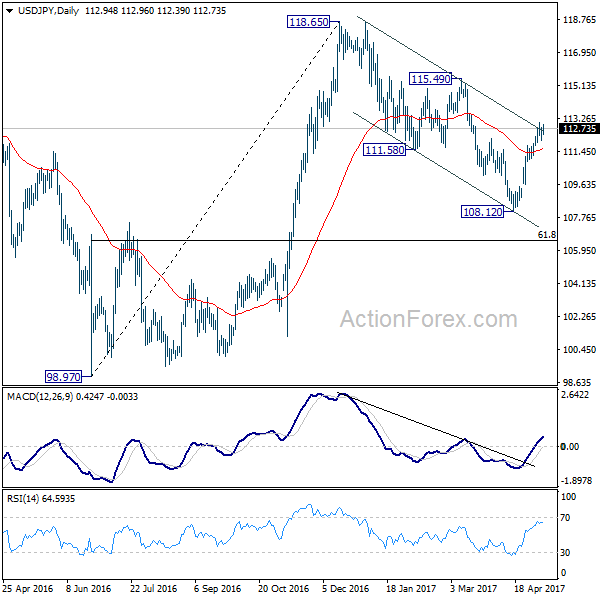
Consolidation from 113.04 temporary top is still in progress and intraday bias in USD/JPY remains neutral. We'd holding on to the view that corrective fall from 118.65 could be completed with three waves down to 108.12. Further rise is expected as long as 110.86 support holds. Above 113.04 will target 115.49 resistance. Firm break there will resume larger rally from 98.97 to 125.85 high. However, break of 110.86 support will keep USD/JPY inside near term falling channel and will turn bias back to the downside for 108.12 and below to extend the decline from 118.65.
In the bigger picture, price actions from 125.85 high are seen as a corrective pattern. It's uncertain whether it's completed yet. But in case of another fall, downside should be contained by 61.8% retracement of 75.56 to 125.85 at 94.77 to bring rebound. Meanwhile, break of 115.49 resistance will extend the rise from 98.97 to retest 125.85. Overall, rise from 75.56 is still expected to resume later after the correction from 125.85 completes.