Sample Category Title
USDJPY Marches On, Aussie Data Next
Disappointment at the nonfarm payrolls report was a distant memory on Monday as USD/JPY rose to a fresh six-week high. On the day, USD was the top performer while the Swiss franc lagged. Australian retail sales and the budget are due up next.
USD/JPY broke 113.20 in a rise to the highest since March 16. It's been a steady 500 pip climb since April 16 as the S&P 500 continues to hit fresh highs. The Federal Reserve is one reason why. Mester spoke Monday and brushed aside week economic data while touting sentiment indicators and jobs data.
The euro was a classic 'sell the fact' trade as the opening gap above 1.10 in EUR/USD quickly closed and the pair fell to 1.0920. The March26 high of 1.0906 and psychological support at 1.0900 are the next levels to watch.
With the French election ending and Trump leaving his first 100 days, expect the markets to shift gears. Political risk has been at generational highs but it's likely to ebb over the Summer months. In that time, the focus will shift back to economic data and central banks.
A third focus will be China. Officials have been tightening credit in an attempt to cool the economy. The fallout has been felt through the commodities market and we will be looking for signs it's hitting more broadly.
In terms of economic data, next we look to Australian retail sales at 0130 GMT. The consensus is for a 0.3% m/m rise. AUD/USD finished near the lowest levels since January on Monday and it has struggled to hold gains on good news.
What will eventually prove to be a bigger driver of AUD is the government's budget, which will also be released Monday. One accounting proposal is to separate regular government debt from infrastructure debt. It's an interesting development and more of a PR move that would make road and bridge building an easier sell but it could also mean more debt issuance, for better or worse.
Pound Steady as Markets Relieved Over Macron Win
GBP/USD has edged lower in the Monday session. In North American trade, GBP/USD is trading at 1.2940. It's a very quiet start to the week, with no major releases out of the UK or the US. On Sunday, Emmanuel Macron easily defeated Marie Le Pen to win the French presidential election.
It was a clean sweep for PMI reports last week, as the Manufacturing, Construction and Services PMIs all beat their estimates. These releases underscore a solid British economy, despite continuing jitters over Britain's departure from the European Union. Market concerns have increased ahead of the first phase of negotiations between Britain and the European Union. The war of words between London and Brussels continued to heat up last week. British Prime Minister Theresa May attacked the EU on Thursday, saying that politicians in Brussels were deliberately meddling in the British election, which will be held in June. May reiterated that she wants a "deep and special partnership" with the EU, while at the same time warning that no deal was preferable to a bad deal. May's combative tone may serve her well in the election campaign, but if negotiations reach an impasse and Britain leaves the EU without a comprehensive deal in place, the toll on the British economy would be significant and the pound could drop sharply.
Emmanuel Macron has become France's youngest president at age 39, and he rode to victory in convincing style. Macron won 64% of the popular vote, with Marie Le Pen taking 36%. Macron's margin of victory was larger than the polls predicted, but the markets had priced in a decisive win, so the euro has showed little response to the election results. Although Macron certainly "won big", it should be noted that fully one third of French voters either abstained or voted a blank ballot as a protest vote. This means that Macron was viewed by many voters as a default choice, given that his opponent was the leader of the far-right and has been accused of being racist and xenophobic. The French elections now enter a new phase, with parliamentary elections slated for mid-June. Macron's En Marche! party is barely a year old and is unlikely to win a majority, which would mean a power-sharing setup in parliament, likely between Macron's party and the center-right. Similar to the presidential election, the parliamentary election is full of uncertainty, and opinion polls during the election campaign will be important as fundamental releases and should be treated as market-movers.
Yen Remains Subdued as Markets Search for Cues
USD/JPY is showing little movement in the Monday session, continuing the trend which as marked the pair since last week. In the North American session, the pair is trading at 112.80. There are no major releases to start off the week. Japanese Consumer Confidence dipped to 43.2, shy of the estimate of 44.3 points.
The yen continued to lose ground last week, as the dollar touched a high of 113.05, its highest level in seven weeks. A weaker yen should result in a boost to the export sector, but on Saturday, BoJ Governor Haruhiko Kuroda said that this was not the case for Japan, since many Japanese companies were producing goods overseas. This argument may ring hollow with US president Trump and US exporters, who will likely cry foul if the the yen continues to lose ground. Early in his presidency, Trump accused Japan of manipulating the yen in order to gain a trade advantage over the US. The two sides have since agreed to let their foreign ministers handles issues related to currency matters.
US employment numbers were generally strong on Friday. Nonfarm Payrolls improved to 211 thousand, easily beating the forecast of 194 thousand. The unemployment rate fell to an impressive 4.4%, compared to the estimate of 4.6%. This was the lowest rate since May 2007. The news was not as positive from wage growth remained weak at 0.3%, matching the forecast. Still, with such little slack in the labor markets, we should see wage growth start to move higher. If that happens sooner rather than later, the Fed will have to reconsider a third rate hike in 2017. As things stand now, two more moves is the likely scenario. The positive job numbers have cemented a rate hike in June, as the odds of hike are up to 83%, according to the CME Group.
USDJPY: Eyes Further Upside Pressure In The Short Term
USDJPY: The pair remains on the offensive leaving further upside pressure on the cards. Despite its current price hesitation this view remains valid. On the downside, support comes in at the 112.00 level where a break if seen will aim at the 111.50 level. A cut through here will turn focus to the 111.00 level and possibly lower towards the 110.50 level. On the upside, resistance resides at the 113.00 level. Further out, we envisage a possible move towards the 113.30 level. Further out, resistance resides at the 114.00 level with a turn above here aiming at the 114.50 level. On the whole, USDJPY looks to recover further higher.
Elliott Wave Trade Ideas Performance Update
No position was entered last week.
| AUD EUR/JPY EUR/GBP CAD GBP GBPJPY
Jan - 15 -275 - 35 -120
Feb + 140 -17 - 40 +11
Mar - 20 +115 +132 - 19
Apr + 30 - 40 +120 + 45
May
Jun
Jul
Aug
Sep
Oct
Nov
Dec
Y-T-D + 135 - 177 + 17 + 158 + 45
Candlesticks and Ichimoku Trade Ideas Performance Update
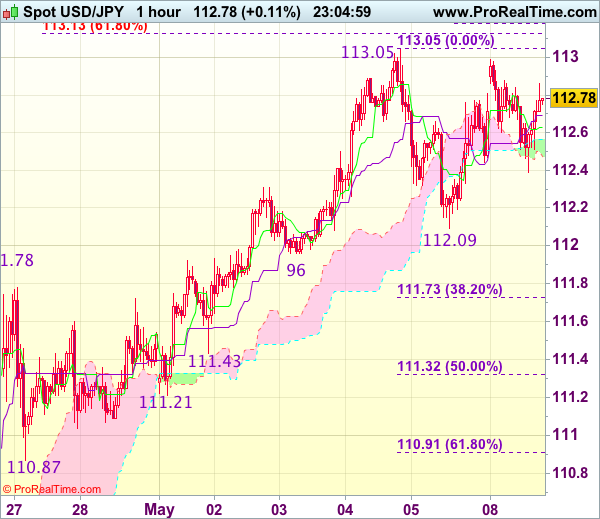
We bought dollar against yen last week at 112.20, however, in view of the retreat from 113.05, we exited the position around break-even but the greenback found support at 112.09 and has rebounded again.
No position was entered among other currency pairs.
In short, only 1 position was entered among all 4 currency pairs with total profit of 3 points and the position is listed below:
5 May : USD/JPY - Long at 122.20, exited at 122.25 (+ 5 points)
| JPY EUR CHF GBP
Jan + 167 - 85 - 10 + 50
Feb + 200 +150 +93 - 59
Mar -23 -70 -23 - 35
Apr + 65 + 93 + 50 - 40
May + 5
Jun
Jul
Aug
Sep
Oct
Nov
Dec
Y-T-D + 413 + 83 +110 -84
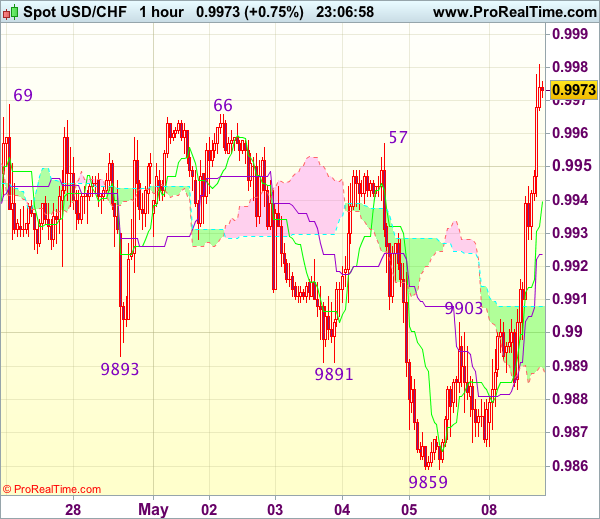
Trade Idea Wrap-up: USD/CHF – Buy at 0.9930
USD/CHF - 0.9976
Most recent candlesticks pattern : N/A
Trend : Near term down
Tenkan-Sen level : 0.9940
Kijun-Sen level : 0.9924
Ichimoku cloud top : 0.9908
Ichimoku cloud bottom : 0.9890
Original strategy :
Buy at 0.9910, Target: 1.0005, Stop: 0.9875
Position : -
Target : -
Stop : -
New strategy :
Buy at 0.9930, Target: 1.0030, Stop: 0.9895
Position : -
Target : -
Stop : -
As dollar’s intra-day rise has gathered momentum and broke above resistance at 0.9966-69, adding credence to our view that low has been formed at 0.9859, hence consolidation with mild upside bias is seen further gain to indicated previous resistance at 1.0000-08 but only break there would signal recent decline from 1.0108 top has ended, then headway to 1.0025-30 and possibly 1.0050 would follow.
In view of this, we are looking to buy dollar on dips as 0.9920-25 should limit downside. Only below 0.9880 would risk test of 0.9859, however, break there is needed to signal recent decline has resumed and extend weakness to support at 0.9831 and possibly towards 0.9800.
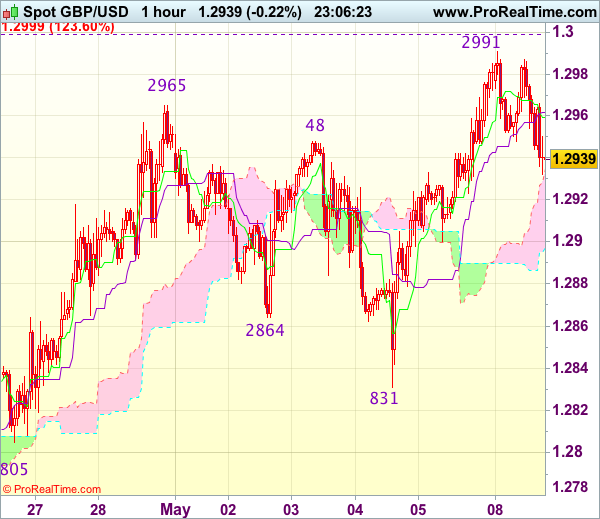
Trade Idea Wrap-up: GBP/USD – Buy at 1.2905
GBP/USD - 1.2943
Most recent candlesticks pattern : N/A
Trend : Near term up
Tenkan-Sen level : 1.2960
Kijun-Sen level : 1.2962
Ichimoku cloud top : 1.2935
Ichimoku cloud bottom : 1.2898
Original strategy :
Buy at 1.2905, Target: 1.3005, Stop: 1.2870
Position : -
Target : -
Stop : -
New strategy :
Buy at 1.2900, Target: 1.3000, Stop: 1.2865
Position : -
Target : -
Stop : -
As cable has retreated after rising to 1.2991 earlier today, suggesting consolidation below this level would be seen and pullback to 1.2920 cannot be rule out, however, reckon 1.2895-00 would limit downside and bring another rise later, above said resistance would extend recent upmove to 1.2999-00 (1.236 times projection of 1.2109-1.2616 measuring from 1.2365 and psychological resistance), then towards 1.3040-50 which is likely to hold from here due to near term overbought condition.
In view of this, would not chase this rise here and would be prudent to buy cable on pullback as 1.2900-05 should limit downside and bring another rise later. Below 1.2880 would defer and risk weakness to 1.860-65 but only a break of said support at 1.0831 would signal a temporary top has been formed.
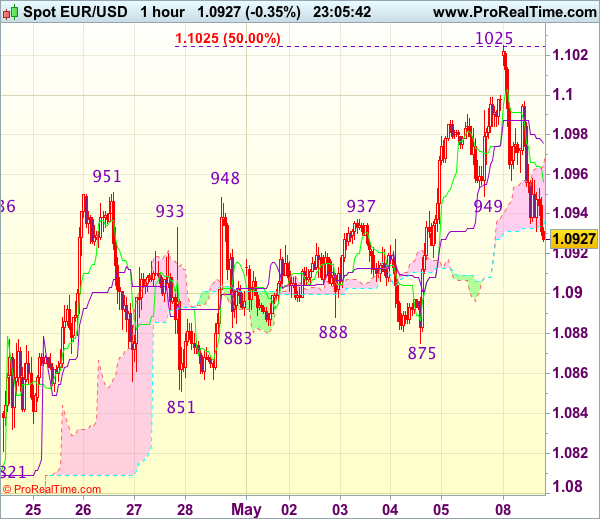
Trade Idea Wrap-up: EUR/USD – Sell at 1.0980
EUR/USD - 1.0925
Most recent candlesticks pattern : N/A
Trend : Near term up
Tenkan-Sen level : 1.0954
Kijun-Sen level : 1.0974
Ichimoku cloud top : 1.0965
Ichimoku cloud bottom : 1.0934
Original strategy :
Sell at 1.0990, Target: 1.0890, Stop: 1.1025
Position : -
Target : -
Stop : -
New strategy :
Sell at 1.0980, Target: 1.0880, Stop: 1.1015
Position : -
Target : -
Stop : -
Although the single currency opened higher earlier today, lack of follow through buying and the subsequent retreat from 1.1025 suggest a temporary top has possibly been formed and consolidation below this level would be seen with mild downside bias for weakness to 1.0900, break there would add credence to this view, bring correction to support at 1.0875 which is likely to hold on first testing.
In view of this, we are looking to sell euro on recovery as 1.0995-00 should limit upside and bring another retreat. Above said resistance at 1.1025 would abort and signal recent upmove from 1.0340 low has resumed for headway to 1.1050 but reckon upside would be limited to 1.1065-70 (61.8% projection of 1.0602-1.0951 measuring from 1.0851).
Trade Idea Wrap-up: USD/JPY – Stand aside
USD/JPY - 112.77
Most recent candlesticks pattern : N/A
Trend : Near term up
Tenkan-Sen level : 112.63
Kijun-Sen level : 112.69
Ichimoku cloud top : 112.57
Ichimoku cloud bottom : 112.48
New strategy :
Stand aside
Position : -
Target : -
Stop : -
Although the greenback opened higher earlier today, as dollar retreated after faltering below last week’s high at 113.05, suggesting further consolidation below this level would be seen and pullback t 112.40 cannot be ruled out, however, reckon support at 112.09 would limit downside and bring another rise later. Above said resistance at 113.05 would confirm recent upmove has resumed and extend gain to 113.10-15 (61.8% projection of 108.13-111.78 measuring from 110.87) and 113.30 but reckon upside would be limited to previous resistance at 113.54 and price should falter well below 113.90-00.
In view of this, would not chase this rise here and would be prudent to stand aside for now. Below 112.09 support would bring test of 111.96 but break of this level is needed to signal a temporary top has been formed at 113.05, bring correction to 111.73-78 (38.2% Fibonacci retracement of 109.59-113.05 and previous resistance), however, reckon 111.21-32 (previous support and 50% Fibonacci retracement) would contain weakness.