Sample Category Title
Long-Term Australia Dollar Forecast Remains Intact Despite Recent Bullishness
Key Points:
- The double top remains intact despite the recent hiccup.
- Neckline is currently being challenged.
- Fundamental and technical biases are in agreement.
The Aussie Dollar's long-term technical forecast was in danger of being upset last week but the pair's recent tumble back to support has revived the bear's hopes for a major downtrend taking hold. What's more, the broader argument for ongoing losses is looking stronger than ever which could see the neckline of the overarching chart pattern broken over the coming days, even in the absence of a major fundamental shift in sentiment.
First and foremost, let's identify exactly what the above mentioned overarching structure is and what it could mean moving forward. As illustrated below, the pattern we have been tracking recently is a fairly well defined double top with peaks around the 0.7735 level and a neckline evident around the 0.7490 handle. This neckline has come into focus over the past 24 hours given that it is once again being challenged and looking just about ready to yield to selling pressure.
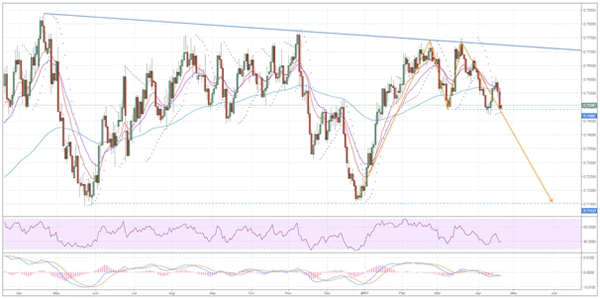
As for what this means in the medium to long-term, a breakout now could bring us into a period of fairly sizable losses. Indeed, if the retracements of the double top are any guide, the AUDUSD could plunge back to even the 0.7150 mark by June. However, we have had a similar bias only recently so it may warrant taking a closer look at some of the other technical indicators to gauge whether we are truly going to see a breakout and subsequent decline for the pair.
Firstly, as was the case previously, the EMA configuration is highly bearish and the two shorter period averages are on the cusp of completing a crossover with the 100 day EMA. However, unlike last time, the MACD has just returned to bearish and the stochastics are much less oversold which will see downside risk increase substantially. In fact, one of the only impediments to a breakout comes from the Parabolic SAR which is currently bullish. Regardless, this shouldn't present much of a real impasse given that it is also on the verge of inverting back to bearish if we have even a modest sell-off moving forward.
Ultimately, despite some recent doubt being cast on the long-term forecast, there is still a fairly strong argument for the decline suggested above. Moreover, this technical bias fits rather well with the broader fundamental case for continued losses as a result of crumbling demand for Australian iron ore. Due to this, it's worth monitoring that neckline closely as, once it breaks, the bears are likely to swiftly seize control of the pair.
Australia’s NAB Business Confidence Remained Steady In The First Quarter Of 2017
For the 24 hours to 23:00 GMT, the AUD declined 0.71% against the USD and closed at 0.7499.
LME Copper prices declined 0.4% or $20.0/MT to $5600.5/MT. Aluminium prices declined 1.0% or $20.0/MT to $1895.5/MT.
In the Asian session, at GMT0300, the pair is trading at 0.7509, with the AUD trading 0.13% higher against the USD from yesterday's close.
Early morning data indicated that Australia's NAB business confidence index remained unchanged at 6.0 in 1Q 2017.
The pair is expected to find support at 0.7486, and a fall through could take it to the next support level of 0.7463. The pair is expected to find its first resistance at 0.7534, and a rise through could take it to the next resistance level of 0.7559.
The currency pair is showing convergence with its 20 Hr moving average and trading below its 50 Hr moving average.

Euro-Zone’s Annual Consumer Price Inflation Advanced 1.5% In March
For the 24 hours to 23:00 GMT, the EUR declined 0.13% against the USD and closed at 1.0715.
On the economic front, the Euro-zone's final consumer price index (CPI) climbed 1.5% on an annual basis in March, in line with market expectations and confirming the preliminary print. In the previous month, the CPI had recorded a rise of 2.0%. Moreover, the region's seasonally adjusted trade surplus widened more-than-anticipated to a level of €19.2 billion in February, from a trade surplus of €15.7 billion in the previous month, while markets expected the region to post a trade surplus of €18.0 billion.
In the US, the Federal Reserve (Fed) Beige Book revealed that the US economy expanded at a modest-to-moderate pace during mid-February to the end of March as a tighter labour market helped broaden wage gains, but inflation pressures remained modest. Moreover, a large number of firms reported high turnover rates and challenges in retaining staff.
On the data front, the US MBA mortgage applications dropped 1.8% in the week ended 14 April 2017, following a rise of 1.5% in the prior week.
In the Asian session, at GMT0300, the pair is trading at 1.0714, with the EUR trading slightly lower against the USD from yesterday's close.
The pair is expected to find support at 1.0696, and a fall through could take it to the next support level of 1.0678. The pair is expected to find its first resistance at 1.0734, and a rise through could take it to the next resistance level of 1.0754.
Moving ahead, market participants await the release of the flash consumer confidence index for April and construction output data for February from the Euro-zone, both slated to release in a few hours. Moreover, the US leading indicators for March, Philadelphia Fed business outlook index for April and weekly jobless claims data, all slated to release later in the day, would keep investors on their toes.
The currency pair is showing convergence with its 20 Hr moving average and trading above its 50 Hr moving average.

GBP/USD: Pound Trading A Tad Higher, Ahead Of The BoE Governor’s Speech
For the 24 hours to 23:00 GMT, the GBP declined 0.48% against the USD and closed at 1.2781.
Meanwhile, UK's lawmakers assented to Prime Minister, Theresa May's plan to hold an early general election on 8th June.
In the Asian session, at GMT0300, the pair is trading at 1.2783, with the GBP trading marginally higher from yesterday's close.
The pair is expected to find support at 1.2747, and a fall through could take it to the next support level of 1.2710. The pair is expected to find its first resistance at 1.2839, and a rise through could take it to the next resistance level of 1.2894.
Looking ahead, market participants will draw their attention to a speech by the Bank of England (BoE) Governor, Mark Carney, due later today.
The currency pair is trading between its 20 Hr and 50 Hr moving averages.

Japan’s Imports Jumped To A 3-Year High Level In March, While Exports Grew The Most In 2 Years In...
For the 24 hours to 23:00 GMT, the USD rose 0.42% against the JPY and closed at 108.89.
In the Asian session, at GMT0300, the pair is trading at 108.90, with the USD trading a tad higher against the JPY from yesterday's close.
Overnight data revealed that Japan's adjusted merchandise trade surplus narrowed less-than-anticipated to a level of ¥172.2 billion in March, as growth in imports outpaced exports. The nation registered a revised surplus of ¥609.0 billion in the previous month. Additionally, the nation's exports grew at the fastest pace in more than two years, after it jumped more-than-expected by 12.0% on an annual basis in March, compared to an advance of 11.3% in the prior month. Moreover, annual imports climbed 15.8% in March, against a rise of 1.2% in the previous month.
The pair is expected to find support at 108.50, and a fall through could take it to the next support level of 108.09. The pair is expected to find its first resistance at 109.24, and a rise through could take it to the next resistance level of 109.57.
Going ahead, traders would focus on Japan's flash Nikkei manufacturing PMI for April, and tertiary industry index for February, slated to release in the early hours of tomorrow.
The currency pair is showing convergence with its 20 Hr moving average and trading above its 50 Hr moving average.

Swiss Franc Trading Marginally Lower In The Asian Session
For the 24 hours to 23:00 GMT, the USD rose 0.16% against the CHF and closed at 0.9977.
In the Asian session, at GMT0300, the pair is trading at 0.9980, with the USD trading slightly higher against the CHF from yesterday’s close.
The pair is expected to find support at 0.9959, and a fall through could take it to the next support level of 0.9937. The pair is expected to find its first resistance at 0.9997, and a rise through could take it to the next resistance level of 1.0013.
The currency pair is trading above its 20 Hr moving average and showing convergence with its 50 Hr moving average.

Loonie Reverses Its Losses In The Morning Session
For the 24 hours to 23:00 GMT, the USD rose 0.71% against the CAD and closed at 1.3478.
In the Asian session, at GMT0300, the pair is trading at 1.3477, with the USD trading marginally lower against the USD from yesterday’s close.
The pair is expected to find support at 1.3415, and a fall through could take it to the next support level of 1.3354. The pair is expected to find its first resistance at 1.3514, and a rise through could take it to the next resistance level of 1.3552.
Amid a lack of economic releases in Canada today, investor sentiment would be governed by global macroeconomic factors.
The currency pair is trading above its 20 Hr and 50 Hr moving averages.

GBP/JPY Daily Outlook
Daily Pivots: (S1) 138.61; (P) 139.40; (R1) 139.88; More...
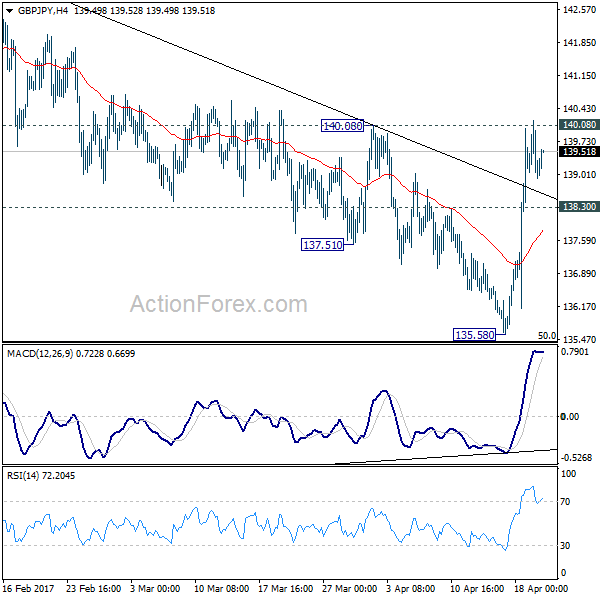
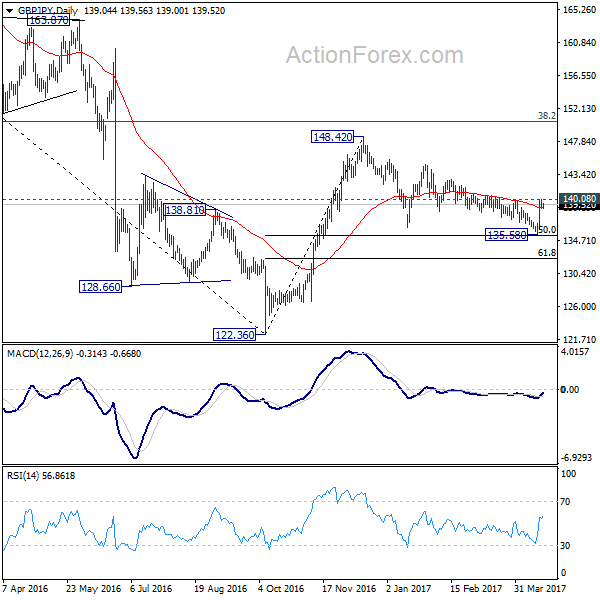
Intraday bias in GBP/JPY remains on the upside with cautiously bullish outlook. Current developments argues that consolidation pattern from 148.42 is possibly completed at 135.58, just ahead of 135.39 fibonacci level. Decisive break of 140.08 resistance will affirm this case. GBP/JPY should then target a test on 148.42 key resistance level. Meanwhile, this bullish case will be favored as long as 138.30 minor support holds, in case of retreat.
In the bigger picture, price actions from 122.36 medium term bottom are still seen as a corrective pattern. As long as 50% retracement of 122.36 to 148.42 at 135.39 holds, another rising leg would be seen to 38.2% retracement of 195.86 to 122.36 at 150.42 and possibly above. However, firm break of 135.39 will bring retest of 122.36, with prospect of resuming the larger down trend from 195.86.
EUR/JPY Daily Outlook
Daily Pivots: (S1) 116.25; (P) 116.61; (R1) 116.96; More...
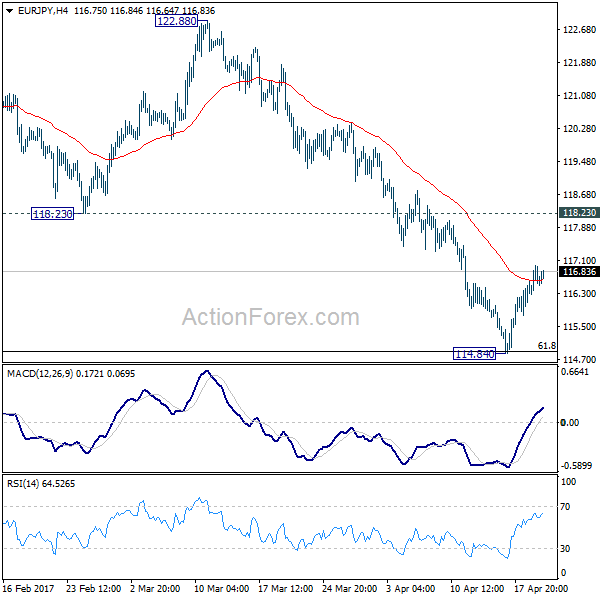
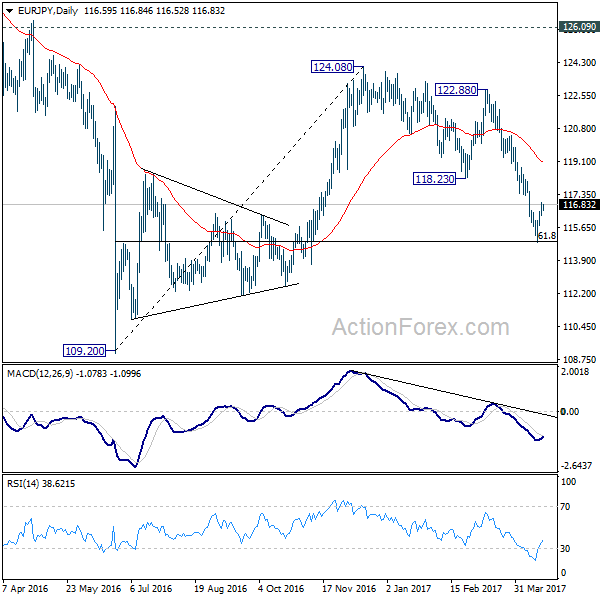
Intraday bias in EUR/JPY remains neutral as the correction from 114.84 continues. At this point, we'd still expect upside to be limited by 118.23 resistance and bring another fall. Corrective rise from 109.20 should have completed at 124.08. Sustained break of 61.8% retracement of 109.20 to 124.08 at 114.88 will pave the way to retest 109.20 low.
In the bigger picture, medium term corrective rise from 109.20 should have completed at 124.08, ahead of 126.09 support turned resistance. Medium term down trend from 149.76 is likely resuming. Break of 109.20 will target 94.11 low. In any case, break of 126.09 is needed needed to confirm medium term reversal. Otherwise, outlook will remain bearish in case of another rebound.
EUR/AUD Daily Outlook
Daily Pivots: (S1) 1.4214; (P) 1.4256; (R1) 1.4328; More...
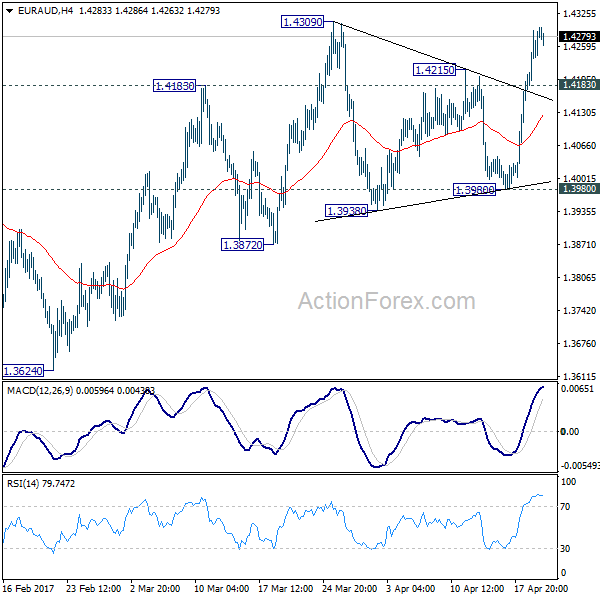
Intraday bias in EUR/AUD remains on the upside for 1.4309 resistance. Current development affirmed the case of trend reversal after defending 1.3671 key support. Break of 1.4309 will target 1.4721 key resistance and firm break there will confirm our bullish view. On the downside, below 1.4183 minor support will turn bias neutral first. But we'll stay bullish as long as 1.3980 support holds.
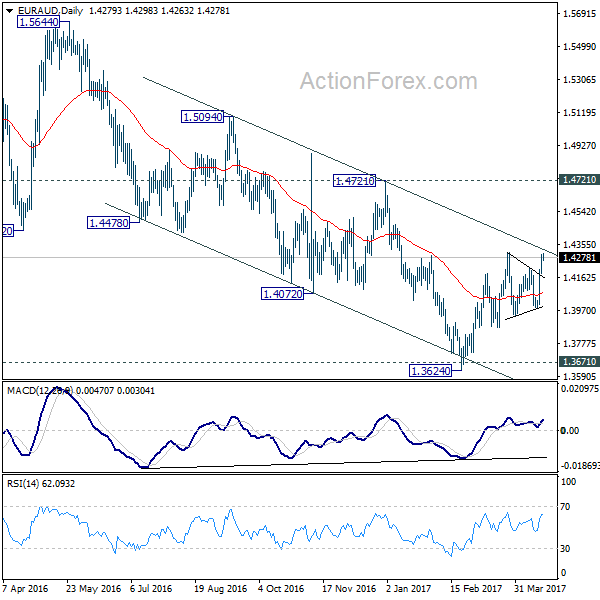
In the bigger picture, price actions from 1.6587 medium term top are viewed as a corrective pattern. Such correction could be completed after testing 1.3671 key support. Break of 1.4721 cluster resistance (38.2% retracement of 1.6587 to 1.3624 at 1.4756) should confirm this case and target 61.8% retracement at 1.5455 and above. Overall, we'd expect the up trend from 1.1602 to resume later. However, sustained break of 1.3671 will invalidate our bullish view and would turn extend the fall from 1.6587 towards 1.1602 long term bottom.