Sample Category Title
New Zealand’s Inflation Accelerates Above RBNZ’s Target Midpoint
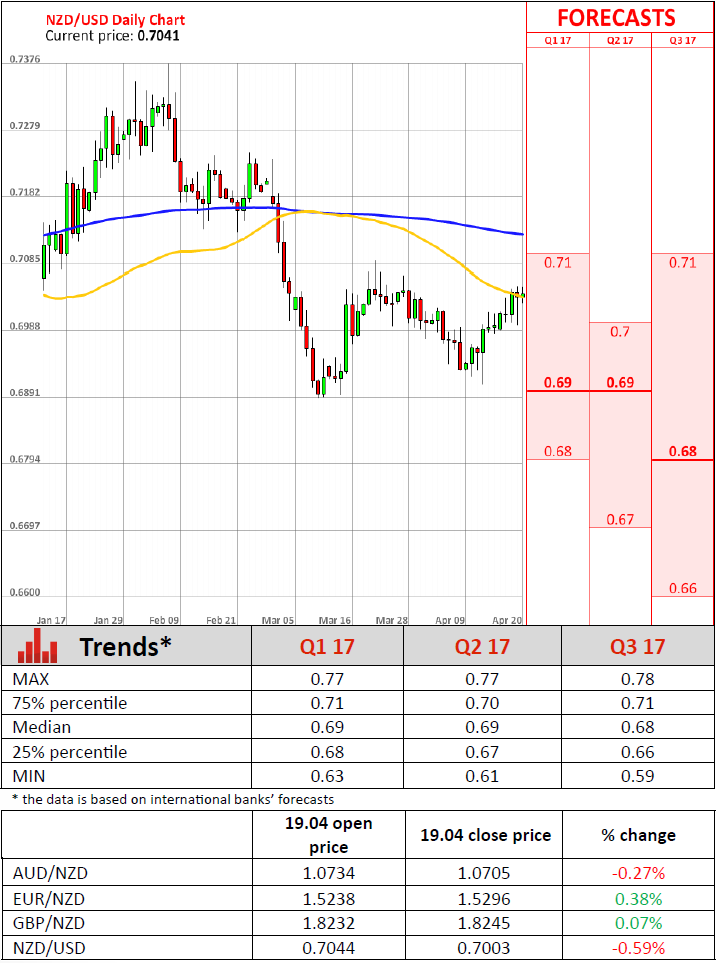
Overnight, New Zealand's CPI rate for Q1 surged to +2.2% yoy from +1.3% in Q4. This was the first time in 5 years inflation propped above the midpoint of the RBNZ's inflation target range of 1-3%. Although StatsNZ noted that inflation was lifted by rising petrol prices and the annual rise in cigarette and tobacco tax, excluding those, the CPI rate stands at +1.5 yoy which is still within the Bank's target band.
At its latest gathering, the Bank kept the door open for further easing, and noted that it expects inflation to return to the midpoint over the “medium-term”. As such, we think that today's acceleration above that midpoint diminishes significantly the likelihood for any further rate cuts by the Bank, at least at the upcoming gatherings. This view is amplified by the fact that the nation's 2-year inflation expectations have been in a positive trend recently and they are now almost in line with the Bank's midpoint as well.
NZD/USD was waiting for the data near the 0.7000 (S1) key support and spiked higher as soon as the numbers were out. The price structure on the 4-hour chart suggests that the short-term outlook of the pair is somewhat positive. On the 13th of April, the rate emerged above the downtrend line taken from the 7th of February and since then, it's been printing higher peaks and higher troughs. A break above the 0.7050 (R1) hurdle is possible to initially aim for the next resistance of 0.7075 (R2), where another break is possible to target the 0.7110 (R3) barrier.
Oil falls to a two-week low on bearish inventory data
WTI tumbled on Wednesday, after the Energy Information Administration (EIA) reported that US crude inventories fell less than expected, while gasoline inventories built up instead of dropping as forecasted. The glut in US inventories comes just a day after the EIA monthly Drilling Productivity report showed that US shale production in May is set for its biggest monthly increase in more than two years.
All these confirm our long-standing view that continued gains in oil prices invite US shale producers back to the market, which in turn increases supply and thereby keeps any potential gains limited.
WTI tumbled on the US inventories report falling back below the key support (now turned into resistance) zone of 51.50 (R1). The plunge was stopped by the 50.50 (S1) level and then, the price rebounded somewhat. Even if that recovery continues for a while, the price structure on the 4-hour chart suggests a short-term downtrend. As such, we would treat any further rebound as a corrective move. We would expect the bears to take the reins again soon and aim for another test near 50.50 (S1). A dip below that line could challenge the round figure of 50.00 (S2).
Now the focus turns to the OPEC and non-OPEC meeting in Vienna on the 25th of May. A number of key producers, including Saudi Arabia, support extending the November production cut agreement into the second half of 2017, if all participating members agree.
Today:
The European day starts with Germany's PPI data for March. The PPI rate is expected to have ticked up, but in any case, PPI data are usually not a major market mover. Investors prefer to focus on the CPI instead of the PPI inflation measure. Later in the day, we also get Eurozone's preliminary consumer confidence index for March.
From the US, initial jobless claims for the week ended on April 14th are coming out. Expectations are for jobless claims to have risen to 242k from 234k the previous week. This would bring the 4-wk moving average down to 243k from 247k. The Philly Fed business activity index for April is also coming out.
Besides the economic indicators, in Washington, Finance ministers and Central Bank governors from the G20 will meet on the sidelines of the bi-annual conference of the IMF and the World Bank, which is from Thursday until Sunday.
NZD/USD
Support: 0.7000 (S1), 0.6970 (S2), 0.6925 (S3)
Resistance: 0.7050 (R1), 0.7075 (R2), 0.7110 (R3)
WTI
Support: 50.50 (S1), 50.00 (S2), 49.00 (S3)
Resistance: 51.50 (R1), 52.50 (R2), 53.20 (R3)
Trade Idea: AUD/USD – Stand aside
AUD/USD – 0.7521
Recent wave: Wave 5 ended at 1.1081 and major correction has commenced for fall to 0.7000 and then towards 0.6500-10
Trend: Near term down
New strategy :
Stand aside
Position: -
Target: -
Stop:-
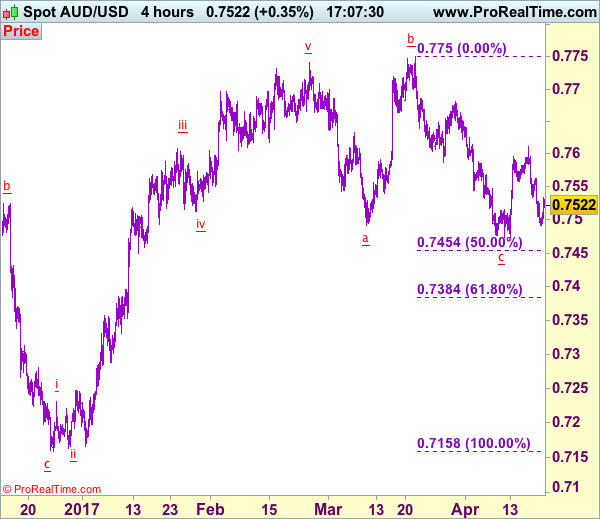
Aussie’s retreat after meeting resistance at 0.7611 earlier this week suggests consolidation with mild downside bias is seen for weakness to 0.7485-90, however, a break of indicated previous support at 0.7473 is needed to retain bearishness and extend the fall from 0.7750 top to 0.7450-55 (50% Fibonacci retracement of 0.7158-0.7750) but oversold condition should limit downside to 0.7380-85 (61.8% Fibonacci retracement), risk from there is seen for a rebound later.
In view of this, would not chase this fall here and would be prudent to stand aside for now. Above 0.7560-65 would prolong consolidation and bring another bounce to 0.7600 but break of said resistance at 0.7611 is needed to revive bullishness, bring a stronger rebound towards resistance at 0.7680 which is likely to hold from here.
On the 4-hour chart, the move from 0.8066 is the wave 5 with i: 0.8860, ii: 0.8315, wave iii is an extended move ended at 1.0183, iv: 0.9706 and wave v has ended at 1.1081 (also the top of entire wave 5). The subsequent selloff is the major correction which is unfolding as ABC-X-ABC and 2nd A leg has ended at 0.8848, followed by a-b-c wave B which ended at 0.9758, hence, 2nd C wave is now in progress and indicated downside target at 0.7000 and 0.6950 had been met, so further fall to 0.6710-20 cannot be ruled out.
NZD/USD Candlesticks and Ichimoku Analysis
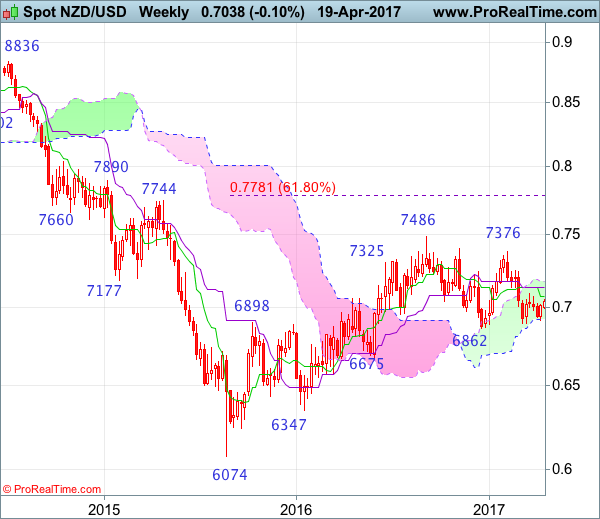
Weekly
• Last Candlesticks pattern: Shooting star
• Time of formation: 5 Sep 2016
• Trend bias: Down
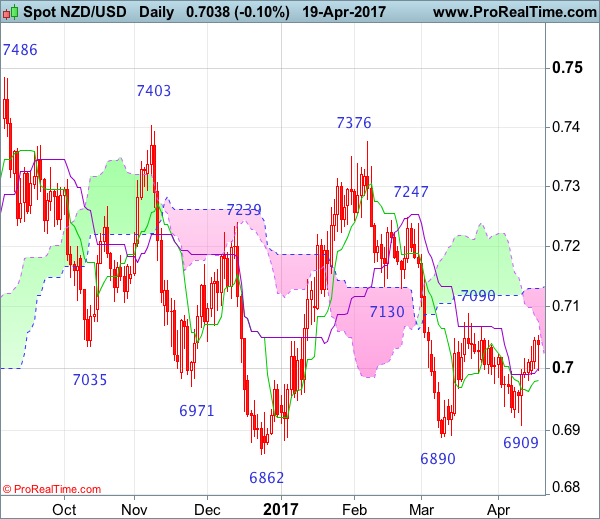
Daily
• Last Candlesticks pattern: Hammer
• Time of formation: 14 Mar 2017
• Trend bias: Near term up
NZD/USD – 0.6974
Kiwi found renewed buying interest at 0.6909 and has staged a strong rebound, retaining our view that further consolidation above recent low at 0.6890 would be seen and mild upside bias remains for test of indicated resistance at 0.7090 but break there is needed to signal another leg of rebound from 0.6890 low is underway to bring at least a retracement of recent decline from 0.7376 to the upper Kumo (now at 0.7131), however, break there is needed to retain bullishness and encourage for further subsequent rise to 0.7185-90 but resistance at 0.7247 should remain intact.
On the downside, whilst initial pullback to the Tenkan-Sen (now at 0.6981) cannot be ruled out, reckon downside would be limited to 0.6940-50 and bring another rebound later. Only a break of said support at 0.6890 would abort and revive bearishness for the fall from 0.7376 top to extend weakness to 0.6862, then towards 0.6775-80 (50% Fibonacci retracement of 0.6074-0.7486) but price should stay well above previous chart support at 0.6675.
Recommendation: Hold long at 0.6980 for 0.7180 with stop below 0.6940
On the weekly chart, as kiwi has rebounded after finding support at 0.6909 last week, retaining our near term bullishness for another bounce to 0.7090 resistance, break there would bring test of the Kijun-Sen (now at 0.7133), however, a weekly close above there is needed to add credence to our view that the fall from 0.7376 has ended at 0.6890 and encourage for further gain towards resistance at 0.7247. Having said that, as broad outlook remains consolidative, reckon upside would be limited to 0.7300-10 and price should falter below said resistance at 0.7376, bring retreat later.
On the downside, expect pullback to be limited to 0.6970-80 and bring another rebound. Only below said support at 0.6890 would abort and bring test of previous support at 0.6862, however, a breach of latter level is needed to retain bearishness and extend the erratic decline from 0.7486 top to 0.6780 (50% Fibonacci retracement of 0.6074-0.7486) and later towards previous chart support at 0.6675 which is likely to hold from here.
Technical Outlook: AUDUSD Falling Hourly Cloud/200SMA To Cap Near-Term Recovery Attempts
The Aussie dollar bounced in early Thursday's reading after strong two-day fall found support at 0.7490 and improving tone of stocks and base metals underpinned AUD's near-term recovery. Steep descend in past two days that took out important supports and weakened near-term structure, as bears approached key support at 0.7472 (lows of 10-12 Apr, reinforced by the base of rising daily cloud) loss of which would trigger fresh bearish extension of descend from 0.7747 high, towards 0.7453 and 0.7384 (Fibo 50% and 61.8% of 0.7159/0.7747 rally) respectively. Overall bearish structure sees limited recovery before fresh weakness, with falling hourly cloud (spanned between 0.7537 and 0.7556) reinforced by 200SMA (0.7549) expected to cap rallies.
Res: 0.7537, 0.7549, 0.7556, 0.7570
Sup: 0.7520, 0.7490, 0.7471, 0.7453
Far-Left And Far-Right Candidates The Most Likely To Decide France’s And European Future
After recent news and market headlines were dominated by the UK snap general election announcement, the markets are now turning their attention towards the upcoming French presidential election. The outcome of the French presidential election will most likely result in heightened volatility for the Euro and European stock markets which look likely to be most affected by the introduction of the far-right candidate Marie Le Pen.
The first round of the French election will be held this Sunday April 23. Altogether there are eleven candidates. If none of the candidates gets more than 50% of the votes in the first round, the two winners will enter the second round of the vote will be held on May 7.
The consensus thus far is that the Centrist Macron and the far-right wing Le Pen are most likely to pass into the second round, with Macron being the favourite to win the final vote. But if the past year has thought us anything, polls do not always accurately gauge public sentiment and there is a possibility that La Pen could win the election.
The far-right wing Le Pen, and the far-left wing Jean-Luc Melenchon are the focuses of the election because of their extreme political stances, and Jean-Luc Melenchon is the only candidate among the four whose share of vote saw an increase recently.
Le Pen takes a similar stance to Trump, the focus of her policies are France first, including anti-globalization, anti-immigrants, trade protectionism, repealing the Euro and reusing the Franc, and most noticeably: making France leave the EU.
Many French voters are in favour of Le Pen's policies, due to France's high unemployment rate and recent terror attacks; provoking citizens' anti-foreigner sentiment. France and Germany are the EU's largest economies. If Le Pen wins, France might leave the EU, following the UK, and triggering a level of uncertainty that could well lead to the downfall of the single market.
Regardless of this weekend's outcome we can expect to see volatility across European markets as the election moves towards the second round of voting on May 7th.
Daily Technical Analysis: GBP/USD Retracement Returns To 38.2% Fibonacci At 1.2750
Currency pair GBP/USD
The Members of the British Parliament have approved the Prime Minister’s plan yesterday to organise an early general election on June 8. The vast majority of the Parliament Members approved the motion (522 out of 650) clearing the bar of the two-thirds needed for accepting the plan.
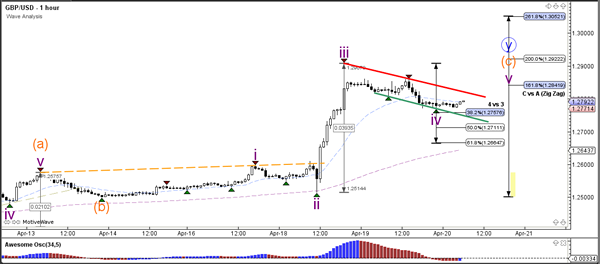
The election news did not impact the GBP/USD as much as it did on Tuesday. The Cable currency moved sideways which is forming a bull flag chart pattern (green/red lines) in the meantime. Price is testing the 61.8% Fibonacci level of wave 4 (purple) and could show one more higher high if it breaks above the bull flag.
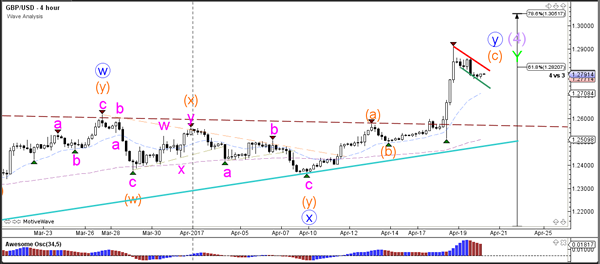
The GBP/USD retracement has reached the 38.2% Fibonacci retracement level at 1.2750 which could act as a bounce zone if price is indeed in a wave 4 (purple) correction. A break below the 61.8% Fibonacci level makes a wave 4 invalid. A break above the bull flag could see a wave 5 (purple) develop.
Currency pair EUR/USD
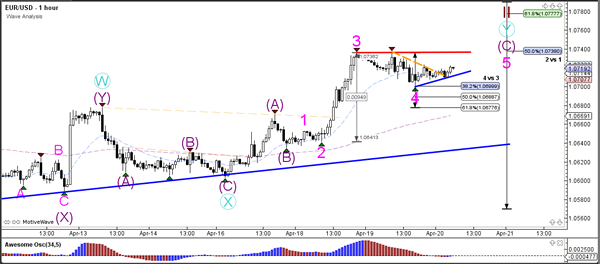
The EUR/USD has paused at the 50% Fibonacci retracement level of wave 2 (brown) but a continuation breakout could see price challenge higher Fibonacci levels.
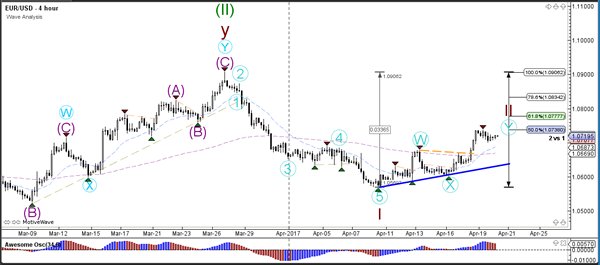
The EUR/USD has retraced to the 38.2% Fibonacci level of wave 4 (pink). A break below the 61.8% Fib invalidates the wave 4 (pink) but otherwise a wave 5 (pink) within wave C (purple) is likely to develop.
Currency pair USD/JPY
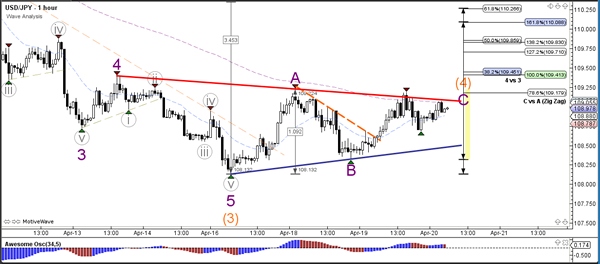
The USD/JPY is building a potential wave 4 correction (orange), which would become invalid if price retraced above the bottom of wave 1 (red line). A break below the support level (blue) could indicate a bearish breakout and completion of wave 4 (orange).
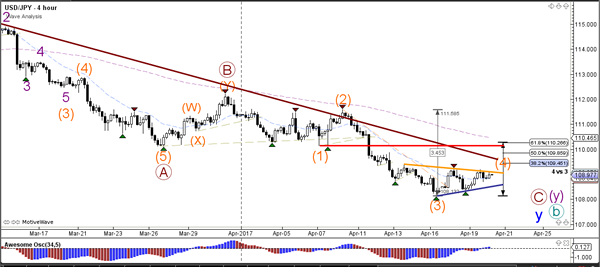
The USD/JPY could be building an ABC (purple) zigzag correction towards the Fibonacci levels of wave 4 (orange) where a break above the resistance level (red) could spark a wave C (purple).
Euro Zone Inflation Growth Slows In March In Line With Forecasts
'…We have not yet seen sufficient evidence to materially alter our assessment of the inflation outlook – which remains conditional on a very substantial degree of monetary accommodation. Hence a reassessment of the current monetary policy stance is not warranted at this stage.' - Mario Draghi, European Central Bank
Consumer inflation in the Euro zone rose in line with analysts' expectations last month, official figures revealed on Wednesday. Eurostat reported that its Final Consumer Price Index came in at 1.5%, compared to the preceding month's gain of 2.0%. However, the March figure came in line with forecasts. Back in February, the headline inflation rate hit the European Central Bank's target, raising expectations of a major change in the Bank's monetary policy. Nevertheless, following the February release, the ECB President Mario Draghi noted that inflation was in large part boosted by rising oil prices, while core inflation growth remained subdued. Wednesday's data confirmed Mario Draghi's outlook and lowered the possibility of the ECB tightening its monetary policy. The Bank's QE programme is set to run until December. Policymakers turned their attention to the upcoming elections in France and the region's largest economy, Germany, which continued boosting uncertainty in the region. Therefore, analysts do not expect the ECB to act until the presidential race ends. The first round of the French presidential election will be held on April 23. Latest opinion polls showed that Emmanuel Macron and Marine le Pen would likely make it to the final round.
US Crude Oil Inventories Post 1.0M-Barrel Drop Last Week
'A build to gasoline inventories is tilted a little bearish, although a build of 2.5 million barrels on the Gulf Coast was in response to higher refining activity.' - Matt Smith, ClipperData
US crude oil inventories dropped last week, whereas gasoline stocks rose unexpectedly, the Energy Information Administration reported on Wednesday. According to the EIA, US crude stocks fell 1.0M barrels in the week ended April 14, following the preceding week's decline of 2.2M barrels and meeting market analysts' expectations. Nevertheless, gasoline inventories climbed 1.5M barrels, falling behind a 1.9M-barrel fall forecast. Unusually high gasoline stockpiles raised concerns and sent the gasoline price 0.6% lower to $1.0701. The price of oil also dropped following the release. West Texas Intermediate futures fell to $52.24 per barrel, whereas Brent futures slipped to $54.75 per barrel. Refineries added 241,000 barrels per day in crude oil production, with the Gulf Coat contributing the most to the increase. Thus, the utilisation rate advanced 1.9% last week. Crude inventories at the Cushing, Oklahoma, dropped 778,000 barrels. Data also showed that distillate stockpiles that include heating oil and diesel decreased 2M barrels, compared to a 1M-barrel decline forecast. The EIA highlighted that distillate inventories hit their lowest levels since November 2015. Yesterday, the OPEC reported that it would meet with non-OPEC countries at its next conference on May 25 to discuss further oil production cuts.
New Zealand(NZ) Inflation Rises At Stronger Than Expect Rate In Q1 Of 2017
'The core reading is still low and the trimmed mean is creeping back into the target band but it's still on the lower end. Inflation is still pretty soft by historical standards. For us, the RBNZ will probably just remain on the sidelines from here.' - Tom Kennedy, JP Morgan
Inflation growth in New Zealand hit its five-year high in the three-month period to March, surprising markets. Statistics New Zealand reported on Thursday that inflation rose at an annualised 2.2% rate in the Q1 of 2017, the highest level in five years. Thus, the inflation rate hit the mid-point of the Reserve Bank of New Zealand's inflationary target range of 1-3% for the first time in more than a year. On a quarterly basis, the Consumer Price Index climbed 1% in the March quarter, while market analysts anticipated a slighter increase of 0.8%. Therefore, annual inflation growth surpassed analysts' expectations for a 2.0% rise. Following the release, the New Zealand Dollar rose from 0.7000 to 0.7042 against its US counterpart. The Q1 inflation acceleration was in large part driven by higher oil and food prices and a tax hike on alcohol and tobacco. The housing market also provided a significant boost to inflation in the reported quarter. Nevertheless, New Zealand's Central bank is unlikely to change its monetary policy despite stronger-than-expect inflation data. The Bank's interest rates are also expected to remain unchanged at record lows of 1.75%. Excluding volatile items, such as petrol, alcohol and cigarettes, annual inflation climbed just 1.5% but remained within the Bank's target range.
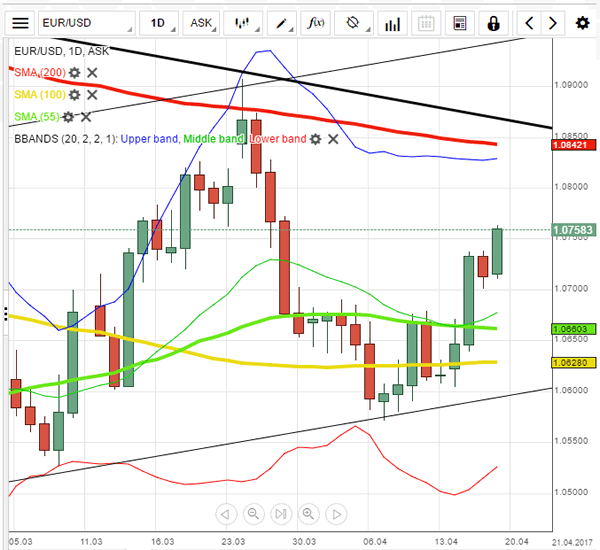
EUR/USD Analysis: Remains Below Resistance
'Twenty-five Nobel Prize-winning economists have united to warn far-right candidate Marine Le Pen against using their ideas to campaign against the euro and the European Union in her bid for the French presidency.' – John Follain, Bloomberg
Pair's Outlook
On Thursday morning the common European currency against the Greenback remained below the second weekly resistance, which stopped the pair's Tuesday's jump. The resistance level is located at the 1.0729 mark. It is possible that the currency exchange rate will retreat to the 1.0687 level, where the 20-day SMA together with the monthly PP are located at. On the other hand a break of the weekly R2 would free up the range up to the weekly R3, which is located at the 1.0780 level. However, most likely the pair will remain at the current levels, as the markets are expecting the French presidential elections.
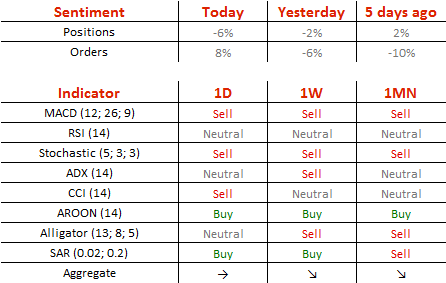
Traders' Sentiment
Traders remain bearish, as 53% of open positions are short. However, 54% of trader set up orders are to buy the Euro.