
Sample Category Title
WTI Crude Gripped By Oversupply Fears
WTI Crude was exposed to sharp losses on Wednesday, with prices tumbling towards $50 after an unexpected weekly climb in U.S gasoline supplies compounded with existing oversupply fears. Although some losses were clawed back during early trading on Thursday as investors attempted to look beyond the oversupply dilemma and focus on the slight drop in U.S Crude inventories, the bias remains tilted to the downside. With anticipation likely to heighten ahead of the scheduled 25 May conference when OPEC and Non-OPEC oil producers will meet, oil price sensitivity could become a dominant theme moving forward. Although OPEC remains optimistic that production cuts with non-members may uplift oil prices, the resurgence of U.S shale continues to sabotage the cartel's efforts to stabilize the saturated markets.
While some investors remain optimistic over OPEC extending its production cut by another six months to battle oversupply woes, questions may be raised if such measures could reduce the global supply glut and revive oil bulls. The sentiment towards oil remains bearish and when factoring in how Donald Trump's pro-drilling rhetoric and deregulations may continue to negatively impact oil markets, further losses could be expected. From a technical standpoint, bears have conquered the $52 support level with prices almost clipping $50. Previous support at $52 could transform into a dynamic resistance that opens a path towards $50 and potentially lower.
Global stocks on the defense
The combination of depressed oil prices and a sense of anxiety ahead of the French presidential elections this weekend has left investors edgy and stock markets on the defense. Although Asian shares have displayed a touch of resilience during early trading on Thursday, the upside could be limited if participants start to depart from riskier assets amid the uncertainty. European markets are expected to open slightly pressured as investors observe from a safe distance; this sense of caution could potentially limit gains on Wall Street. With the Trump rally losing momentum and geopolitical tensions weighing on global sentiment, stock markets are in desperate need of inspiration to fuel the bull rally.
Sterling hovering around 1.2800
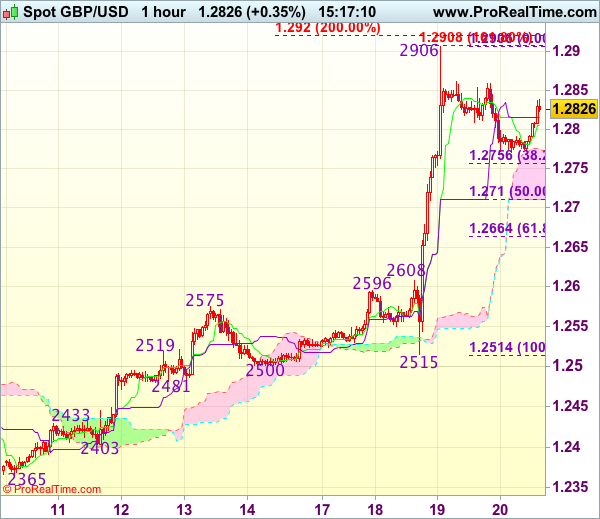
Sterling has staged an awe-inspiring rebound this week off the back of U.K Prime Minister Theresa May shocking markets by announcing early elections. However, questions should be raised whether the rally is sustainable. With political risks and uncertainty revolving around Brexit remaining a dominant theme when dealing with Sterling, the bullish rally could face some headwinds down the road. Investors may direct their attention towards BoE governor Mark Carney who is scheduled to deliver a speech today. With the Brexit saga gaining traction and UK economic data displaying some signs of weakness over the past months, it will be interesting to hear Carney's thoughts on these developments. From a technical standpoint, the GBPUSD has broken above the 1.2775 resistance level, with the next level of interest at 1.3000.
In an alternative scenario, repeated weakness below 1.2775 could open a path lower towards 1.2600.
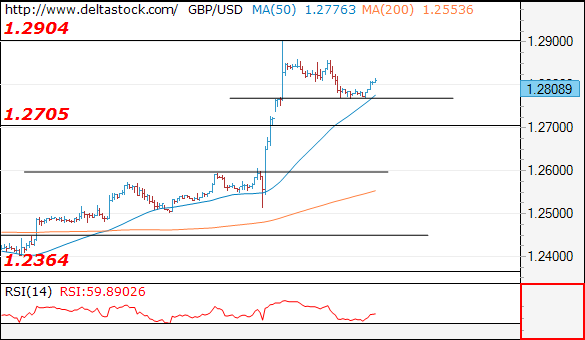
Trade Idea : GBP/USD – Buy at 1.2755
GBP/USD - 1.2788
Most recent candlesticks pattern : N/A
Trend : Near term up
Tenkan-Sen level : 1.2805
Kijun-Sen level : 1.2815
Ichimoku cloud top : 1.2775
Ichimoku cloud bottom : 1.2711
Original strategy :
Buy at 1.2710, Target: 1.2850, Stop: 1.2675
Position : -
Target : -
Stop : -
New strategy :
Buy at 1.2755, Target: 1.2855, Stop: 1.2720
Position : -
Target : -
Stop : -
Although cable has rebounded after finding support at 1.2770 and gain to 1.2855-60 cannot be ruled out, break there is needed to signal the pullback from 1.2906 has ended, bring retest of this level, break there would extend recent upmove to 1.2920-30 (2 times extension of 1.2365-1.2575 measuring from 1.2500), then 1.2950 but loss of near term upward momentum should prevent sharp move beyond 1.2990-00 (1.236 times projection of 1.2109-1.2616 measuring from 1.2365 and psychological resistance). If said resistance continues to hold, then further consolidation would take place and another retreat to 1.2755-60 (38.2% Fibonacci retracement of 1.2515-1.2906) cannot be ruled out before prospect of a rally.
In view of this, would not chase this rise here and would be prudent to buy cable on subsequent pullback as downside should be limited to 1.2740-50. Below 1.2710 (50% Fibonacci retracement) would defer and signal top has been formed, risk correction to 1.2660-65 (61.8% Fibonacci retracement of 1.2515-1.2906) but price should stay well above 1.2608-16 (previous resistance now support).
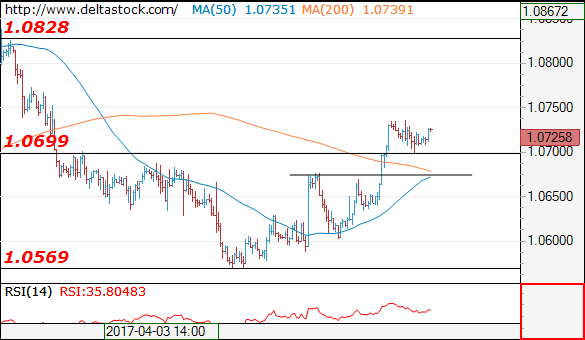
Trade Idea : EUR/USD – Buy at 1.0675
EUR/USD - 1.0738
Most recent candlesticks pattern : N/A
Trend : Near term down
Tenkan-Sen level : 1.0729
Kijun-Sen level : 1.0724
Ichimoku cloud top : 1.0707
Ichimoku cloud bottom : 1.0676
Original strategy :
Buy at 1.0675, Target: 1.0775, Stop: 1.0640
Position : -
Target : -
Stop : -
New strategy :
Buy at 1.0685, Target: 1.0785, Stop: 1.0650
Position : -
Target : -
Stop : -
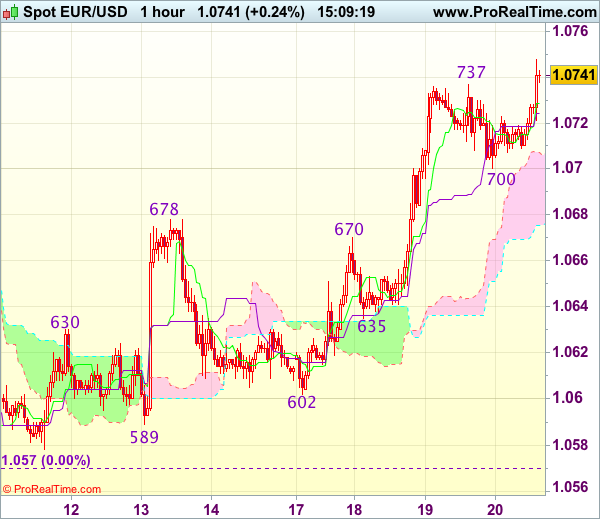
As the single currency has risen again after brief pullback, suggesting recent upmove from 1.0570 is still in progress and upside bias remains for further gain to 1.0775-80 (61.8% Fibonacci retracement of 1.0906-1.0570) and possibly towards 1.0800, however, loss of near term upward momentum should prevent sharp move beyond 1.0825-30, risk from there is seen for a retreat to take place later.
In view of this, would not chase this rise here and would be prudent to buy euro on pullback as 1.0675-85 should limit downside. Only below support at 1.0635 would abort and signal top is formed instead, risk weakness towards 1.0602 support.
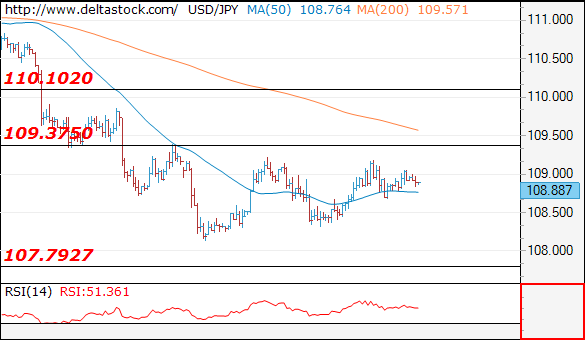
Trade Idea : USD/JPY – Hold long entered at 108.45
USD/JPY - 108.90
Most recent candlesticks pattern : N/A
Trend : Near term down
Tenkan-Sen level : 108.90
Kijun-Sen level : 108.92
Ichimoku cloud top : 108.68
Ichimoku cloud bottom : 108.65
Original strategy :
Bought at 108.45, Target: 109.45, Stop: 108.30
Position : - Long at 108.45
Target : - 109.45
Stop : - 108.30
New strategy :
Hold long entered at 108.45, Target: 109.45, Stop: 108.30
Position : - Long at 108.45
Target : - 109.45
Stop : - 108.30
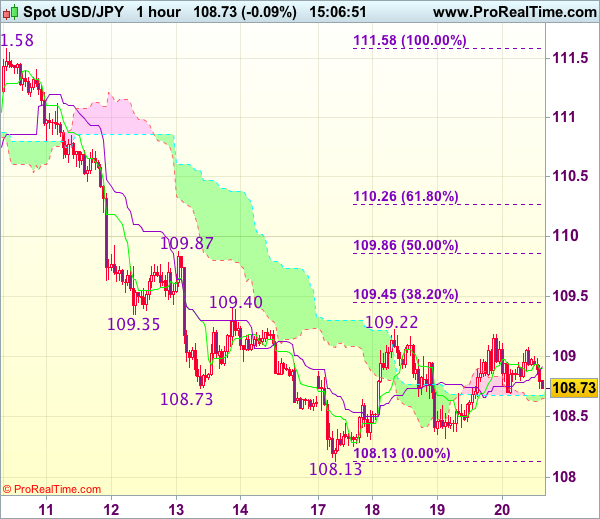
As dollar has eased after faltering below indicated resistance at 109.22, suggesting further consolidation would take place, however, reckon downside would be limited to 108.45-50 and bring another bounce to said resistance, break there would add credence to our view that a temporary low has been formed at 108.13, bring retracement of recent decline to 109.40-45 (previous resistance and 38.2% Fibonacci retracement of 111.58-108.13) but reckon upside would be limited to 109.86-87 (50% Fibonacci retracement and previous resistance) and price should falter below 110.25-30 (61.8% Fibonacci retracement), bring retreat later.
In view of this, we are holding on to our long position entered at 108.45. Below 108.30-32 would risk retest of 108.13 support (this week’s low) but break there is needed to signal recent decline has resumed and extend weakness to 107.75-80 later.
Forex Technical Analysis: EUR/USD, USD/JPY, GBP/USD
EUR/USD
Current level - 10725
The corrective pattern below 1.0736 is expected to dip lower, to 1.0670, before bouncing towards new high, around 1.0750.
| Resistance | Support | ||
| intraday | intraweek | intraday | intraweek |
| 1.0775 | 1.0828 | 1.0700 | 1.0600 |
| 1.0828 | 1.0904 | 1.0600 | 1.0490 |
USD/JPY
Current level - 108.88
My intraday outlook here is positive, for another test of 109.40 resistance, en route to 110.10 zone. Key support lies at 108.30.
| Resistance | Support | ||
| intraday | intraweek | intraday | intraweek |
| 109.40 | 113.50 | 108.30 | 107.80 |
| 110.10 | 115.65 | 107.80 | 105.80 |
GBP/USD
Current level - 1.2808
The pullback after 1.2904 is still underway and I favor a break through 1.2770 to provoke a test of 1.2705 support zone.
| Resistance | Support | ||
| intraday | intraweek | intraday | intraweek |
| 1.2904 | 1.3000 | 1.2770 | 1.2610 |
| 1.3000 | 1.3500 | 1.2705 | 1.2510 |
Currencies: Dollar Still Going Nowhere
Sunrise Market Commentary
- Rates: Working off overbought conditions
Today's eco calendar contains US weekly jobless claims, Philly Fed business outlook and EMU consumer confidence. Data aren't expected to inspire trading, but a weaker Philly Fed outlook could further question the reflation trade. However, both the Bund and US Note future entered overbought conditions, suggesting that the core bond rally could lose more steam. - Currencies: dollar still going nowhere
Yesterday, the dollar stabilized against the euro and the yen. A bottoming in core yields helps to put a floor for the dollar, but there is no obvious trigger for a sustained rebound. Sterling maintains most of the impressive gains recorded after UK PM May announced early elections.
The Sunrise Headlines
- US equities started the day on a strong footing, but returned gains throughout dealings. The Dow (‐0.58%) and S&P (‐0.17%) even closed with losses. Overnight, Asian risk sentiment is better with gains of up to 0.5%.
- Oil prices slid after data showed US gasoline stockpiles increased for the first time in nine weeks and as weekly US crude production hit its highest level since August 2015. Brent crude declined from $55/barrel to $52.5/barrel.
- Brussels is starting systematically to shut out British groups from multibillioneuro contracts and urging companies to decamp to one of the 27 remaining EU members as it prepares for Brexit.
- New Zealand inflation jumped in Q1 to 2.2% Y/Y, the fastest since 2011, putting CPI in the upper half of the RBNZ's 1‐3% target range. The central bank said last month it was anticipating higher inflation. NZD/USD jumped from 0.7 to 0.704.
- Japan's export and import growth revved up in March, with the former marking a fourth straight month of expansion and a stronger yen helping the latter notch its fastest rise in more than three years.
- UK PM May won formal approval from the House of Commons to hold an early election in June, supported by an opposition Labour Party that could be facing one of its worst national defeats in decades.
- Today's eco calendar contains US initial jobless claims, Philly Fed business outlook and EMU consumer confidence. Spain and France tap the market. Fed governor Powell is scheduled to speak.
Currencies: Dollar Still Going Nowhere
Dollar in wait-and-see modus. No rebound yet
On Wednesday, there were only second tier eco data releases. Core bond yields rebounded after the recent decline and put a floor under EUR/JPY and USD/JPY. The broader picture for the dollar remained indecisive. The trade‐weighted dollar held within reach of the recent correction low, while EUR/USD hovered in the 1.0725 area, near this week's high. So, there was no consistent indication across markets that the US reflation trade would resume and that a sustained dollar rebound is around the corner.
Overnight, Asian equities opened soft after a disappointing performance in the US, but found a better bid as the session proceeded. Japanese March foreign trade data were stronger than expected and suggest a decent global economic context supports regional sentiment. However, the equity rebound has hardly any impact on the dollar. USD/JPY hovers little changed near the 109 level. EUR/USD also maintains its tight range in the low 1.07 area. Commodity currencies remain in the defensive after yesterday's sharp decline of the oil price. AUD/USD is trading in the 0.75 area. USD/CAD jumped to the high 1.34 area.
Today, market attention will go to the EMU consumer sentiment, the Philly Fed business outlook and the US initial claims. The latest NFIB small business confidence and the Michigan consumer sentiment held close to record highs, but the NY business sentiment plunged in April, suggesting that firms might have second thoughts about Trump's ability to deliver on tax cuts and infrastructure spending. The Philly Fed business sentiment fell already in March, but is still at very high level. For April a slowing to 25.5 is expected. A sharper decline wouldn't go unnoticed. EMU consumer confidence is expected marginally stronger at ‐4.8 (from ‐5), a high level for this indicator.
Of late, by default dollar softness dominated FX trading. The move was reinforced by a sustained decline in US yields. Initially, USD softness was mainly visible in USD/JPY, but of late EUR/USD also rebounded north of 1.07. part of this move, however, might have been a euro rebound/short squeeze rather than USD weakness. We look out whether this week's tentative US bottoming out process is confirmed. For the overall USD performance we continue to keep a close eye on the US bond markets. We maintain the view that the correction on the US bond markets has gone far enough. However for now there is no trigger for Uturn. So, it is still too early to position for a rebound of the dollar. In a day‐to‐day perspective, there is maybe even room for some further unwinding of euro shorts ahead of the French election.
From a technical point of view, USD/JPY broke through the 110 key support, after having failed to regain the 111.36/60 previous range bottom. We downgraded our USD/JPY assessment to bearish, as long as the pair doesn't regain 112.20 (neckline ST double bottom). Next key support (62% retracement) comes in at 107.18. EUR/USD extensively tested the topside of the MT range (1.0874/1.0906 area) late March, but the test was rejected. EUR/USD returned lower in the 1.0875/1.05. The move met support in the 1.06 area, as the dollar traded weakish of late. The picture is turning more neutral as the pair returns to the middle of the ST range. We slightly prefer to sell EUR/USD on upticks in case of a return higher in the range as we see room for a broader USD comeback
EUR/USD: off the recent lows. USD softness or euro rebound
EUR/GBP
Sterling holding strong, but no further gains
Yesterday, sterling maintained most of Tuesday's impressive gains after UK PM May called for an early election on June 8. It is another reason for LT sterling shorts to reduce positions. However, there was only a very modest correction on Tuesday's GBP rally. EUR/GBP closed the session at 0.8383 (from 0.8356). Cable finished the day at 1.2777 (from 1.2841)
Today, there are again no UK eco data. BoE governor Carney speaks in Washington, but we don't expect him to make bold statements on high profile policy issues (or regarding the eco outlook). We assume that the BOE will keep a low profile as the election campaign has started. We don't row against the sterling positive tide. In a longer term perspective, the sterling rally is probably overdone.
We had a neutral short‐term bias on EUR/GBP. On Tuesday, sterling dropped below the bottom of the EUR/GBP 0.84 support, improving the picture for sterling. The pair came with reach of the key 0.8305 support (Dec low). We look whether this level holds. A break below would be highly significant from a technical point of view. Longer term, Brexit‐complications remain a potential negative for sterling. However, this is not the focus of sterling trading at this stage.
EUR/GBP: key 0.83 support still within reach, but no real test occurred
GBP/USD Is Trading Just Off The 1.28 Mark
Market movers today
A relatively quiet day once again on the data front, with the main release in the euro area being consumer confidence. The latest euro-area unemployment figures showed a decline in February to 9.5%, and such decent employment growth cont inues to support increasing consumer confidence, which we expect to see increased to -4.1 in April. Like financial and business sentiment , consumer confidence has also proved fairly resistant to political uncertainty, so we expect it to continue on an upward trend despite the uncertain political climate.
No major Scandi events are scheduled for today.
Selected market news
Markets calmed somewhat overnight following the upheaval in political risks over the past 10 days. The Fed's beige Book last night painted a still relatively upbeat picture of the US economy, which was echoed by the Fed's Fischer, suggest ing that the global economy is now more robust to tighter monetary policy. Moreover, strong Japanese export data out this morning is adding to global-growth sent iment . We stress, however, that our cyclical lead models paint an increasingly negat ive picture of the growth prospects across the US, Europe and Japan, and we would not be surprised to see a cyclical peak in especially the US in the near future. Oil prices dropped significantly on US data showing surging oil production and inventories. Equity markets have been mixed but energy stocks in particular are suffering as oil prices dropped on surging US production and inventories with Brent oil just above the USD53/bbl mark. Finally, a strong CPI print out of New Zealand, which saw inflation reach the 2% target for the first time in five years, has sent NZD/USD higher.
UK PM Theresa May received House of Commons' backing for her 8 June election call yesterday, and GBP/USD is trading just off the 1.28 mark, levels not seen since October last year, with UK stocks suffering as a result . The election campaign is now on with the Tories maintaining a decent lead.
Yesterday in an interview with the FT, US Treasury Secretary Steven Mnuchin commented on a range of the initiatives proposed by the Trump administration. Notably, Mnuchin said that while the tax plan remains a key priority for this year, August seems an unrealistic deadline. Plans to boost growth via infrastructure investment also remain on the table for 2017 but seem unlikely to provide a growth boost before next year , in our view. The Treasury also appears keen on incentivising repatriat ion of foreign profit (i.e. with a so-called Homeland Investment Act 2) but Mnuchin was more reluctant to provide out right support for border-tax adjustments, stressing that there are both pros and consto this instrument. The latter essentially works as an import tariff/export subsidy and could thus, depending on the actual implementat ion, spur USD appreciat ion, which would not be welcomed by the Trump administ ration.
Market Update – Asian Session: Treasury Prices Dropped Along With Gold, And The USD/JPY has rebounded
US Session Highlights
(US) DOE CRUDE: -1.0M V -1ME; GASOLINE: +1.5M V -2ME; DISTILLATE: -2.0M V -1ME
(BR) Brazil Apr IGP-M Inflation (2nd Preview): -1.0% v -0.7%e
(US) MBA MORTGAGE APPLICATIONS W/E APR 14TH: -1.8% V 1.5% PRIOR
US equities opened the morning higher, though trading remained somewhat muted ahead of the weekend French election and a continued dearth of news out of DC. Risk-on flows largely returned to global markets, as Treasury prices dropped along with gold, and the USD/JPY has rebounded. As the session wore on, stocks weakened modestly and crude sold off after a smaller-than-expected inventory draw, but healthcare and industrials held onto tepid gains, while energy, consumer staples, and utilities declined.
US markets on close: Dow -0.6%, S&P500 -0.2%, Nasdaq +0.2%
Best Sector in S&P500: Healthcare
Worst Sector in S&P500: Energy
Biggest gainers: LRCX +6.9%; ISRG +6.4%; WRK +4.5%
Biggest losers: IBM -4.9%; MRO -4.3%; NFX -3.5%
At the close: VIX 14.9 (+0.5pts); Treasuries: 2-yr 1.18% (+1bps), 10-yr 2.22% (flat), 30-yr 2.87% (+3bps)
US movers afterhours
SCSS Reports Q1 $0.56 v $0.46e, R$393.3M v $370Me; Raises FY17 Rev $1.25-1.50 v $1.31e; +13.2% afterhours
QCOM Reports Q2 $1.34 v $1.20e, R$6.0B v $5.88Be; Guides Q3 $0.90-1.15 v $1.09e; +2.4% afterhours
CSX Reports Q1 $0.51 v $0.43e, R$2.87B v $2.73Be; +2.7% afterhours
EBAY Reports Q1 $0.49 v $0.48e, R$2.22B v $2.21Be; Guides Q2 $0.43-0.45 v $0.48e; R$2.28-2.32B v $2.32Be; Non-GAAP op margin 30.0% v 33.4% y/y; -1.9% afterhours
URI Reports Q1 $1.63 v $1.57e, R$1.36B v $1.34Be; Adj EBITDA margin 43.6% v 44.6% y/y; -6.3% afterhours
Key economic data
(NZ) NEW ZEALAND Q1 CPI Q/Q: 1.0% (1-year high) V 0.8%E; Y/Y: 2.2% (highest since Q3 of 2011) V 2.0%E
(AU) AUSTRALIA Q1 NAB BUSINESS CONFIDENCE: 6 V 5 PRIOR
(JP) JAPAN MAR TRADE BALANCE: ¥614.7B V ¥608BE; ADJ TRADE BALANCE: ¥172.2B V ¥172BE
(CN) China Mar FX Net Client Settlements (CNY): -48.3B v -69.2B prior
Asia Session Notable Observations, Speakers and Press
Asia indices trading mixed tracking heavy tone on Wall St, where slumping oil prices weighed on the Energy sector while low-beta Utilities/Staples also stumbled. Traders are starting to square positions going into the French elections this weekend, though there is little evidence of continued momentum behind the wild-card Melenchon in the first round after a recent surge. New Zealand Q1 CPI was the most notable datapoint of the session, rising to 5-year high annualized where Tradable prices increased 1.6%, while prices for non-tradables increased 2.5%, prompting some analysts to adjust their RBNZ tightening outlook forward. NZD/USD spiked some 40pips on the result and held its gains. Japan Trade numbers were also notable but less market moving, with surplus just above consensus, imports growth at a 3-year high, and exports at a 2-year high.
China
(CN) China State Administration of Foreign Exchange (SAFE) spokesperson: Pressure on capital outflows eased significantly in Q1 - press
(CN) China state planner NDRC said to release a 2nd batch of public-private projects - Chinese press
(CN) Former China State Administration of Foreign Exchange (SAFE) Official Guan Tao: Non-financial institutions and other participants should be allowed into the bank-dominated onshore yuan market to boost liquidity and price discovery
Australia
(AU) According to the latest property industry survey by ANZ and the Property Council of Australia, property firms and investors are most optimistic about outlook for property prices since 2014 - AFR
(AU) CBA: Australia inflation is skewed much lower because land prices are not included in the CPI basket - AFR
Asian Equity Indices/Futures (00:00ET)
Nikkei +0.2%, Hang Seng +0.4%, Shanghai Composite -0.1%, ASX200 +0.2%, Kospi +0.4%
Equity Futures: S&P500 +0.1%; Nasdaq +0.1%, Dax +0.2%, FTSE100 +0.2%
FX ranges/Commodities/Fixed Income (00:00ET)
EUR 1.0707-1.0721; JPY 108.80-109.10; AUD 0.7490-0.7510; NZD 0.7000-0.7045
June Gold -0.2% at 1,281/oz; June Crude Oil +0.6% at $51.14/brl; May Copper -0.6% at $2.51/lb
SPDR Gold Trust ETF daily holdings rise 11.8 tonnes to 860.8 tonnes; 4th straight increase; highest since Dec 7th
iShares Silver Trust ETF daily holdings fall to 10,149 tonnes from 10,178 tonnes prior
(JP) Japan's MoF sells ¥0.9T in 0.7% (0.7% prior) 20-year JGBs; Avg yield: 0.562% v 0.673% prior; bid-to-cover: 4.06x (highest since 2014) v 3.78x prior
(CN) PBOC to inject combined CNY100B v CNY80B prior in 7-day, 14-day and 28-day reverse repos
(CN) PBOC SETS YUAN MID POINT AT 6.8792 V 6.8664 PRIOR; biggest margin of weakness in 3 weeks
(NZ) New Zealand sells NZ$150M in 2.75% 2025 bonds; avg yield 2.889%
Asia equities/Notables /movers by sector
Australia:
Rio Tinto (RIO) +0.3%; Q1 production
Iluka (ILU) +11.0%; Q1 results
Santos (STO) -2.9%: Q1 results
Woodside Petroleum (WPL) -1.5%; Q1 results
Hong Kong:
Ajisen (538) +0.3%; Q1 SSS
Qingdao Port International (6198) +0.7%; FY16 results
Yanzhou Coal Mining -0.2%; Guides Q1
CNOOC and PetroChina -1.0% on lower oil prices
Japan:
Toshiba (6502) +4.7%; Hon Hai/Amazon or Dell joint bid for chip unit speculation
Canon (7751) +3.1%; Q1 results speculation
Sumitomo Heavy (6302) +1.0%; FY17 results speculation
AUDJPY Demonstrating Significant Confluence
Key Points:
- AUDJPY demonstrating confluence.
- RSI Oscillator within oversold territory.
- Watch for a move higher to complete the D leg around the 84.83 mark.
The AUDJPY currency pair has convincingly trended lower over the past few months as the air has steadily leaked from the balloon that is the Australian economy. Subsequently, the market has seen price action falling from its high above the 87.00 handle, to the present close at 81.79. This is a significant depreciation but there are some signs that the pair might finally have hit rock bottom.
In particular, there is plenty of confluence being exhibited around the 81.50 mark which suggests that we are nearing a relatively big move. At this level, price action is likely to form a bullish crab pattern, as well as the C point of two bearish 5-0 patterns. In addition, the RSI Oscillator is starting to rise out of oversold levels in another indication that a turnaround is on the cards.
Further adding to the bullish contention is the appearance of ABCD pattern on the 4-hour timeframe that is now nearing completion. In fact, the C leg should complete right around the key 81.50 level which would suggest that the full pattern completion would finish at 84.83. Subsequently, there is plenty of scope for a retracement sharply higher.
Fundamentally, the Australian economy has suffered a fairly protracted decline which largely mirrors the fall in world commodity prices and the end of the super cycle. In fact, just this past month has seen the price of iron ore slump by around 30% as China pulls back their future steel purchases. However, the Aussie Dollar has largely rejected the negative pressures due to the already steep decline. Subsequently from a mean reversion point of view, the pair might have already plumbed its current depths.
Ultimately, the AUDJPY is likely to find plenty of support at its present level around the 81.50 mark given that both the ADX and RSI Oscillators are signalling oversold levels. In addition, strong confluence and the completion of a C leg hints at the validity of the bullish contention. Subsequently, the most likely scenario is one where price action consolidates around the 81.50-70 mark before commencing a relatively strong rally back towards 84.83 thereby completing the ABCD pattern.
Long-Term Australia Dollar Forecast Remains Intact Despite Recent Bullishness
Key Points:
- The double top remains intact despite the recent hiccup.
- Neckline is currently being challenged.
- Fundamental and technical biases are in agreement.
The Aussie Dollar's long-term technical forecast was in danger of being upset last week but the pair's recent tumble back to support has revived the bear's hopes for a major downtrend taking hold. What's more, the broader argument for ongoing losses is looking stronger than ever which could see the neckline of the overarching chart pattern broken over the coming days, even in the absence of a major fundamental shift in sentiment.
First and foremost, let's identify exactly what the above mentioned overarching structure is and what it could mean moving forward. As illustrated below, the pattern we have been tracking recently is a fairly well defined double top with peaks around the 0.7735 level and a neckline evident around the 0.7490 handle. This neckline has come into focus over the past 24 hours given that it is once again being challenged and looking just about ready to yield to selling pressure.
As for what this means in the medium to long-term, a breakout now could bring us into a period of fairly sizable losses. Indeed, if the retracements of the double top are any guide, the AUDUSD could plunge back to even the 0.7150 mark by June. However, we have had a similar bias only recently so it may warrant taking a closer look at some of the other technical indicators to gauge whether we are truly going to see a breakout and subsequent decline for the pair.
Firstly, as was the case previously, the EMA configuration is highly bearish and the two shorter period averages are on the cusp of completing a crossover with the 100 day EMA. However, unlike last time, the MACD has just returned to bearish and the stochastics are much less oversold which will see downside risk increase substantially. In fact, one of the only impediments to a breakout comes from the Parabolic SAR which is currently bullish. Regardless, this shouldn't present much of a real impasse given that it is also on the verge of inverting back to bearish if we have even a modest sell-off moving forward.
Ultimately, despite some recent doubt being cast on the long-term forecast, there is still a fairly strong argument for the decline suggested above. Moreover, this technical bias fits rather well with the broader fundamental case for continued losses as a result of crumbling demand for Australian iron ore. Due to this, it's worth monitoring that neckline closely as, once it breaks, the bears are likely to swiftly seize control of the pair.