
Sample Category Title
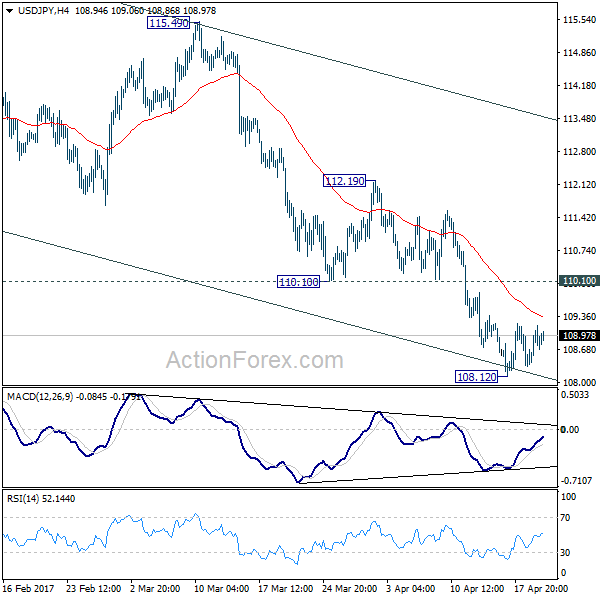
USD/JPY Daily Outlook
Daily Pivots: (S1) 108.42; (P) 108.79; (R1) 109.23; More....
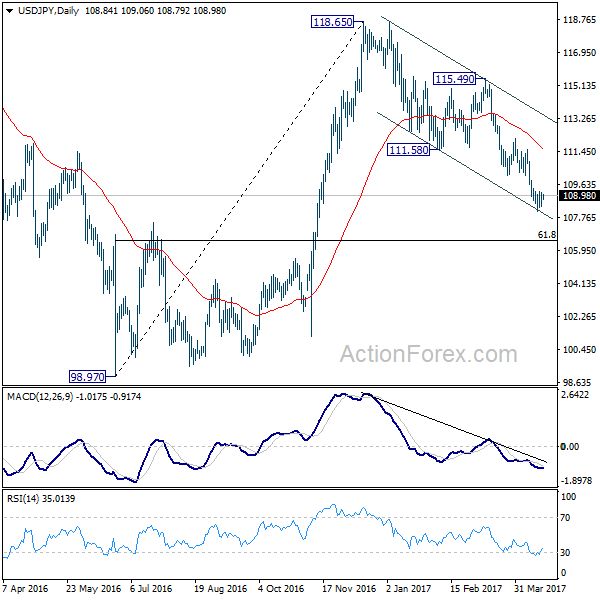
USD/JPY's consolidation from 108.12 temporary low is still in progress and intraday bias remains neutral. Near term outlook remains bearish as rise from 98.97 is finished at 118.65 and fall from there would extend. On the downside, break of 108.12 will target 61.8% retracement of 98.97 to 118.65 at 106.48. Sustained break there will pave the way back to 98.97 low. Nonetheless, break of 110.10 will be the first sign of near term bottoming and turn bias back to the upside for 112.19 resistance instead.
In the bigger picture, price actions from 125.85 high are seen as a corrective pattern. Current development suggests that it's not completed yet and is extending. In case of deeper decline, downside should be contained by 61.8% retracement of 75.56 to 125.85 at 94.77 to bring rebound. Rise from 75.56 is still expected to resume later after the correction from 125.85 completes.
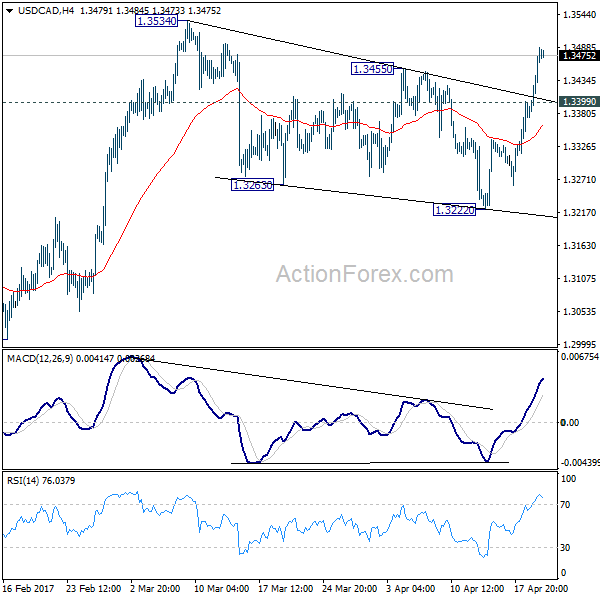
USD/CAD Daily Outlook
Daily Pivots: (S1) 1.3328; (P) 1.3364; (R1) 1.3416; More....
Intraday bias in USD/CAD remains on the upside for the moment. The break of 1.3455 resistance confirmed that consolidation from 1.3534 has completed with three waves down to 1.3222. And the rises from 1.1968, and that from 1.2460 are possibly resuming. Further rally would be seen to retest 1.3598 high first. Decisive break there will pave the way to next medium term fibonacci level at 1.3838. On the downside, below 1.3399 minor support will turn bias neutral and bring consolidation before staging another rally.
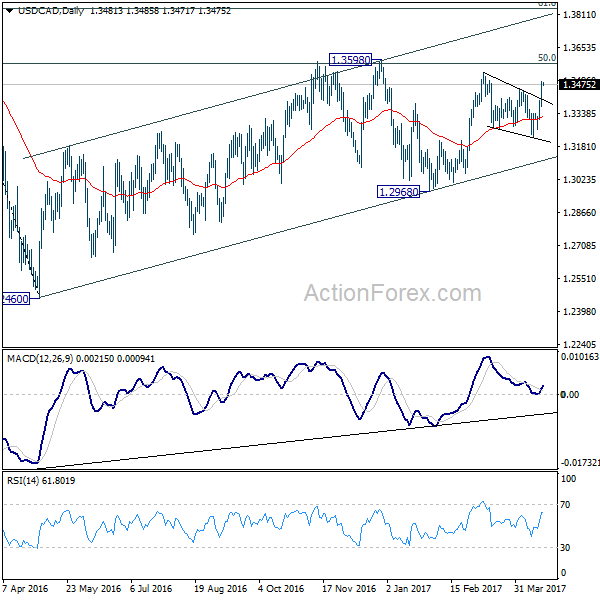
In the bigger picture, price actions from 1.4689 medium term top are seen as a correction pattern. The first leg has completed at 1.2460. The second leg from 1.2460 is likely still in progress and could target 61.8% retracement of 1.4689 to 1.2460 at 1.3838. We'd look for reversal signal there to start the third leg. However, break of 1.2968 will argue that the third leg has already started and should at least bring a retest of 1.2460 low. Meanwhile, sustained trading above 1.3838 would pave the way to retest 1.4689 high.
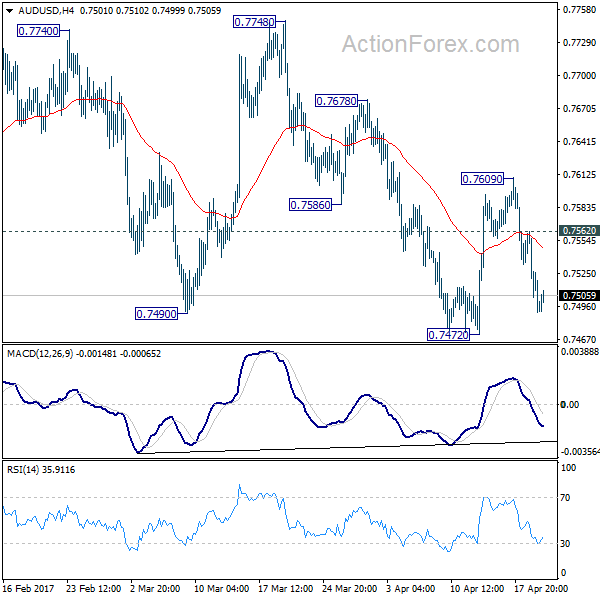
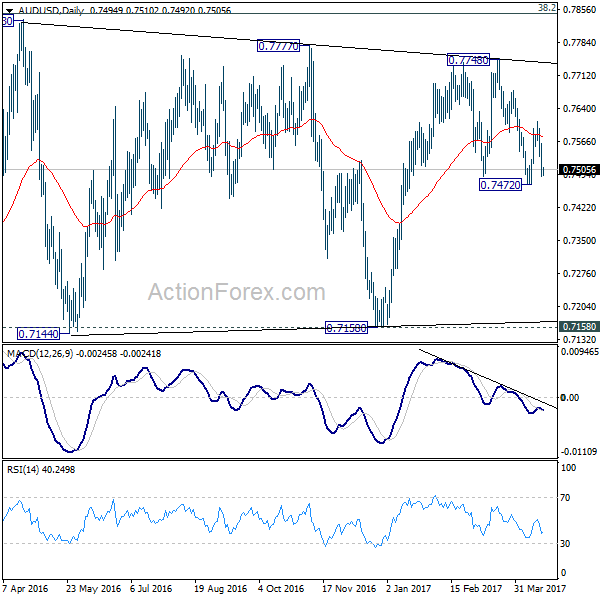
AUD/USD Daily Outlook
Daily Pivots: (S1) 0.7471; (P) 0.7516; (R1) 0.7542; More...
AUD/USD recovers mildly today but intraday bias remains on the downside for 0.7472 support. Firm break there will revive the case that whole rise from 0.7158 is completed at 0.7740. In that case, AUD/USD will target a test on 0.7158 key support level next. On the upside, above 0.7562 minor resistance will turn bias back to the upside for 0.7609 resistance. Break will target a test on 0.7748 high.
In the bigger picture, we're still treating price actions from 0.6826 low as a correction. And, as long as 38.2% retracement of 0.9504 to 0.6826 at 0.7849 holds, long term down trend from 1.1079 is expected to resume sooner or later. Break of 0.6826 low will target 0.6008 key support level. However, firm break of 0.7849 will indicate that rise from 0.6826 is developing into a medium term rebound, rather than a sideway pattern. In such case, stronger rise should be seen to 55 month EMA (now at 0.8144) and above.
Commodity Currencies Recover as Sentiments Stabilized, Dollar Mixed after Beige Book
Markets continue to trade generally calmly for the moment. US equities turned mixed overnight with DJIA losing another -118.79 pts or -0.58% to close at 20404.49. S&P 500 dropped -4.02 pts or -0.17% to close at 2338.17. NASDAQ, however, gained 13.56 pts or 0.23% to close at 5863.03. Asian stocks are steady in tight range as Nikkei and HK HSI recover with slight gain. US treasury yield also stabilized with 10 year yield closing up 0.023 at 2.202. Gold continues to feel heavy ahead of 1300 handle and dips through 1280 handle briefly. The selloff in WTI Crude oil is more apparent as it reaches as low as 50.09, comparing to last week's high at 53.76. In the currency markets, commodity currencies are trading generally higher. New Zealand dollar is given additional boost from inflation data. Japanese Yen, on the other hand, trades broadly lower with Dollar for today.
Boston Fed Rosengren: Balance sheet normalization won't alter rate path
In US, Boston Fed President Eric Rosengren said that the process of the USD 4.5T balance sheet reduction "could begin relatively soon". And, that "should not significantly alter the FOMC's continuing gradual normalization of short-term interest rates." He noted that "by initially retiring only a small percentage of maturing securities, and then very gradually shrinking the volume of the securities being reinvested, the tightening of short-term interest rates should not need to be much different than it would be in the absence of shrinking the balance sheet." Meanwhile, " if done appropriately, the exit from the current large balance sheet can serve as an important 'playbook' for future recovery periods should it prove necessary."
Fed's Beige Book: Modest to moderate expansion in all districts
Fed's Beige Book economic report noted that activity increased across all twelve districts. And, the pace of expansions was "equally split between modest and moderate". Meanwhile, "the pickup was evident to varying degrees across economic sectors." Job markets tightened with "difficulty filling low-skilled positions" found in most districts. There were also increased demand for higher skilled labors. Inflation was modest only on balance.
European Commission: Two agencies will leave London after Brexit
European Commission spokesman Margaritis Schinas said that the European Medicines Agency and the European Banking Authority will leave London after Brexit. The two agencies employ more than 1000 staff in total. Schinas said that "the United Kingdom is leaving the European Union and it will have no say in the location of EU agencies." And relocating as "a matter for the negotiations will be the duty for the United Kingdom to facilitate the transfer of these agencies, helping to ease the practical and financial burden for the experts working there who will have to relocate to another city in the EU." Schinas also said yesterday that "the real political negotiations on article 50 with the United Kingdom will start after the elections foreseen for the 8th of June."
US House of Representatives Speaker Paul Ryan said that the US stood "ready to forge a new trade agreement with Great Britain as soon as possible so that we may further tap into the great potential between our two people." He urged that UK and and EU to "come together and strike a lasting agreement". And, "a strong UK-EU relationship is in all of our best interests".
Macron and Le Pen still leading in French president race
In France, all focuses are on the first round of presidential election on the coming Sunday. A closely watched Cevipof opinion poll published yesterday showed that centrist Emmanuel Macron and far-right Marine Le Pen are still leading the race. But both are losing momentum. On the other hand, conservative Francois Fillon and far-left Jean-Luc Melenchon are gaining momentum and are still in contention. First round support for Macron, Le Pen, Fillon and Melenchon are at 23.0%, 22.5%, 19.5% and 19.0% respectively. Another poll by BVA showed Macron at 24%, Le Pen at 23%, Fillon and Melenchon at 19% both. That will take Macron and Le Pen to the head-to head run-off in May and Macron is widely tipped to win.
On the data front...
New Zealand CPI rose 1.0% qoq in Q1, above expectation of 0.8% qoq. Australia NAB business confidence rose 1 pt to 6 in Q1. Japan trade surplus narrowed to JPY 0.17T in March. German PPI will be featured in European session. US will release jobless claims, Philly Fed survey and leading indicators later in the day.
AUD/USD Daily Outlook
Daily Pivots: (S1) 0.7471; (P) 0.7516; (R1) 0.7542; More...
AUD/USD recovers mildly today but intraday bias remains on the downside for 0.7472 support. Firm break there will revive the case that whole rise from 0.7158 is completed at 0.7740. In that case, AUD/USD will target a test on 0.7158 key support level next. On the upside, above 0.7562 minor resistance will turn bias back to the upside for 0.7609 resistance. Break will target a test on 0.7748 high.
In the bigger picture, we're still treating price actions from 0.6826 low as a correction. And, as long as 38.2% retracement of 0.9504 to 0.6826 at 0.7849 holds, long term down trend from 1.1079 is expected to resume sooner or later. Break of 0.6826 low will target 0.6008 key support level. However, firm break of 0.7849 will indicate that rise from 0.6826 is developing into a medium term rebound, rather than a sideway pattern. In such case, stronger rise should be seen to 55 month EMA (now at 0.8144) and above.
Economic Indicators Update
| GMT | Ccy | Events | Actual | Forecast | Previous | Revised |
|---|---|---|---|---|---|---|
| 22:45 | NZD | CPI Q/Q Q1 | 1.00% | 0.80% | 0.40% | |
| 23:50 | JPY | Trade Balance (JPY) Mar | 0.17T | 0.61T | 0.68T | 0.61T |
| 1:30 | AUD | NAB Business Confidence Q1 | 6 | 5 | ||
| 6:00 | EUR | German PPI M/M Mar | 0.20% | 0.20% | ||
| 6:00 | EUR | German PPI Y/Y Mar | 3.10% | |||
| 12:30 | USD | Initial Jobless Claims (APR 15) | 241K | 234K | ||
| 12:30 | USD | Philly Fed Manufacturing Index Apr | 25.6 | 32.8 | ||
| 14:00 | EUR | Eurozone Consumer Confidence Apr A | -5 | -5 | ||
| 14:00 | USD | Leading Indicators Mar | 0.20% | 0.60% | ||
| 14:30 | USD | Natural Gas Storage | 10B |
Market Morning Briefing: All The Majors Are In A Consolidation Mode
STOCKS
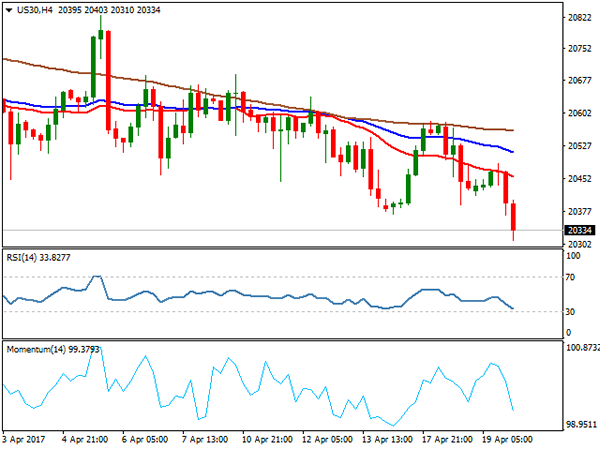
Dow (20404.49, -0.58%) has closed below our expected 20410 levels on the downside. The immediate price momentum indicates further scope of a fall towards 20250-20200 levels in the next 1-2 sessions.
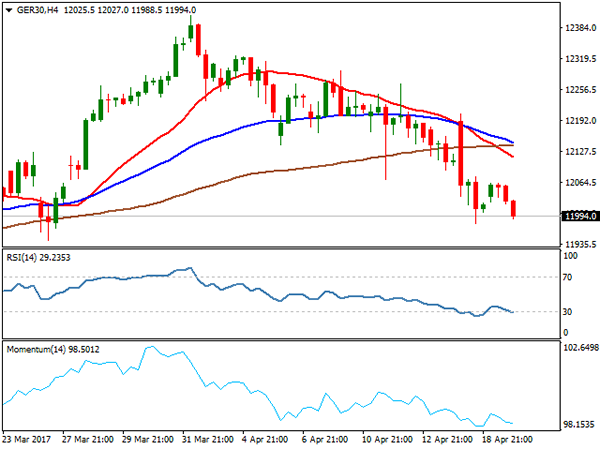
Dax (12016.45, +0.13%) is trading just above immediate support levels of 11960-11930 region and while that holds, a bounce back towards 12200 is possible in the near term.
Shanghai (3167.59, -0.12%) now faces important resistance near 3175/3180 levels and while the price stays below 3175, there is a fair possibility of testing 3100 on the downside.
Nikkei (18489.05, +0.31%) could remain in the 18600-18200 region this week. But the fall may not be over yet. We will have to be ready to look for another downleg below 18200 in the medium term.
Nifty (9103.50, -0.02%) made an intra-day low of 9075 yesterday, trying to attempt below 9100. We may look for a fall towards 9000-8900 in the medium term before a bounce back.
COMMODITIES
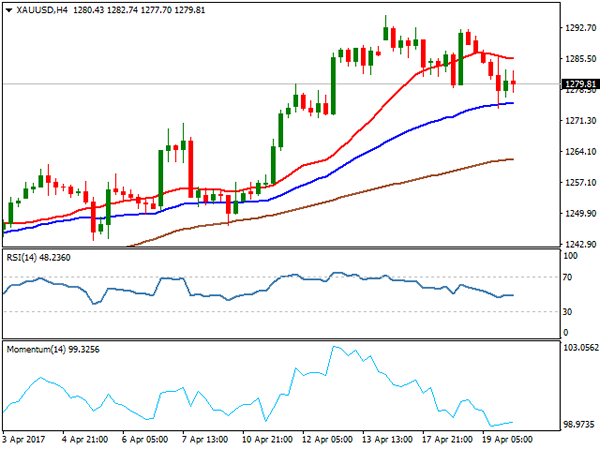
Gold (1281) has moved lower in line with our expectation. More correction towards 1260-65 can be expected due to near-term overbought condition. We have been expecting 1260 for gold to hold for some time as buyers are taking every dip as a further opportunity for buying. 1301 could be a level where the price action has to be checked to assess the chances of further bounce to 1328 to 1350 levels.
Silver (18.15) also closed below its support at 18.30. We might see 17.70 within few days of time and we will remain bearish while it is trading below 18.30 levels. We think that the corrective phase could be restricted till 17.70-80 levels due to near term oversold condition
Copper (2.51) has been stuck in the range of 2.50-2.66. A close below 2.50 could open up 2.48 and 2.45 levels respectively. Gradual buying at 2.45 levels can’t be ruled out due to near term oversold condition.
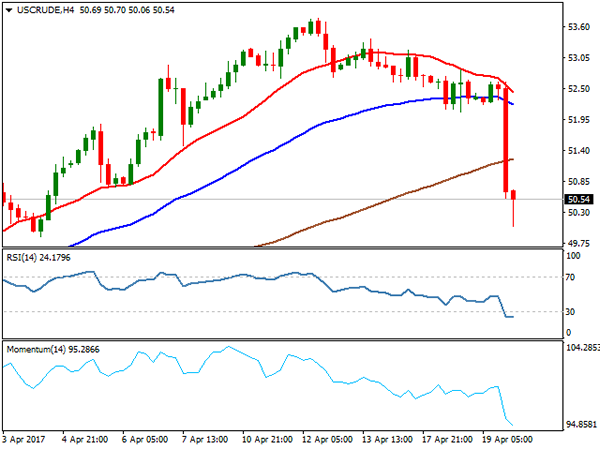
We have clearly mentioned yesterday that “increase in EIA data could keep lid on the bullish momentum and could open up 52.50 levels for Brent and 50 levels for WTI as well”. Yesterday,Crude oil prices fell, hitting their lowest in 11 days as EIA report said shale oil output in May was expected to post the biggest monthly increase in more than two years. The respective daily lows for Brent was 52.59 and WTI was 50.09. We have witnessed similar kind of fall on 9th march,2017, and we had successfully warned our clients about that fall too.
Now,increase in U.S. oil inventories is again raising a concern whether the United States will remain the world's biggest oil importer, which is a price supporting indicator, or if its soaring production and bloated stocks lead to lower imports and trigger shipments to the rest of the world, which would weigh on oil markets.
FOREX
All the majors are in a consolidation mode as the markets wait for the French poll to start on 23rd April though the final voting will be on 7th May.
Dollar Index (99.62) has marked a low at 99.45, just a bit higher than our target/support of 99.20-10 but the target may still be achieved if 100.00 holds as resistance in the near term.
Euro (1.0713) is taking a pause after the sharp rise from 1.06 to 1.0735 in just 2 sessions but the uptrend may resume any day, pushing it higher to 1.0780-1.0830.
Dollar Yen (108.96) continues its horizontal movement in the range of 108.00-109.40 and a major trending move can be expected only on a break from this range. Currently no directional bias but the trend still remains down with major support coming at 107.85.
Pound (1.2783) may spend the next few sessions in the range of 1.2600-1.2900, consolidating the recent gains made in the sharp rise from 1.2364 to 1.2900. While 1.3300 may be seen in the medium term, 1.2900 may hold as resistance in the near term.
Aussie (0.7507) has failed to bounce from the immediate support of 0.7525, weakening the technical structure. Now it may spend the coming sessions in the narrow range of 0.7450-0.7600 before any directional move.
Dollar-Rupee (64.58) is trading at 64.70 in the NDF at the moment. If it manages to sustain above 64.70-80 in the onshore market, then 65.20 may open up as the higher target but a failure near 64.70-80 may keep it in the narrow range of 64.40-70.
INTEREST RATES
The US yields are trading lower on Dollar weakness yesterday. There is immediate support below current levels and we could see a bounce back in the yields next week.
The German short end yields have risen and could move up for another 2-3 sessions before facing rejection from near term resistances. For now, the immediate trend is up.
The German-US 2Yr (-1.98%) and the 10Yr (-2.01%) are testing crucial resistances near current levels. We will have to watch if the resistance manages to produce rejection in the next couple of sessions; else we may expect a further rise in the yield spreads indicting a stronger Dollar against major currencies.
The UK 10Yr (1.05%) and the 20yr (1.59%) have moved up a bit from immediate support levels and could rise some more for a few sessions before resolving on the downside. As mentioned yesterday, long term looks bearish.
The 10 Yr GOI (6.8525%) has enough scope of rising towards 75 in the medium term. But a decent resistance is visible near 6.90% which if holds could delay a rise towards 7%.
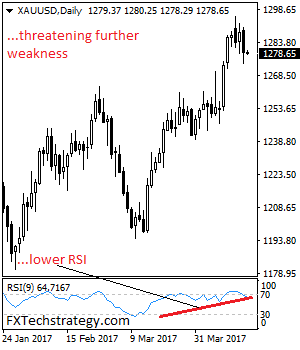
GOLD – Bearish, Risk Turns Lower On Correctiongold
GOLD - The commodity weakened after failing to strengthen further on Wednesday. On the downside, support comes in at the 1,270.00 level where a break will turn attention to the 1,260.00 level. Further down, a cut through here will open the door for a move lower towards the 1,250.00 level. Below here if seen could trigger further downside pressure targeting the 1,240.00 level. Conversely, resistance resides at the 1,290.00 level where a break will aim at the 1,300.00 level. A turn above there will expose the 1,310.00 level. Further out, resistance stands at the 1,320.00 level. All in all, GOLD looks to weaken further.
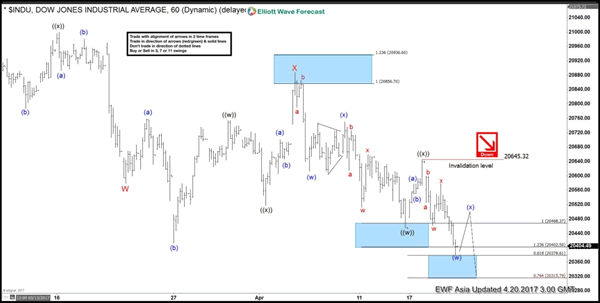
Elliott Wave View: INDU More Downside
Short term Elliott Wave view in INDU ( Dow) suggest that instrument is showing 5 swings sequence from 3/03 peak (21018) favoring more downside. From 3/03 peak INDU is following a Double three Elliott wave Structure , where Minor wave W ended at 20579 low and Minor wave X ended at 20887 peak. Index has since broken below the 20412 low, suggesting the next leg lower in Minor wave Y has started already. The Internal Subdivision of Minor wave Y is also unfolding as Double three Elliott wave structure where Minute wave ((w)) ended at 20453 and Minute wave ((x)) ended at 20645 peak. Below from there, index is following another double three Elliott wave structure in Minute wave ((y)) lower, where Minutte wave (w) is expected to end in between 20378-20315 area then should see a bounce in Minutte wave (x) before further downside is seen. Near term, while bounces stays below 20645 peak and more importantly below 20887 peak index has scope to extend lower 1 more leg lower at least. we don’t like selling the index.
Dow 1 hour Elliott Wave Chart
Foreign Exchange Market Commentary: EUR/USD, USD/JPY, GBP/USD,AUDUSD, GBPCAD, GOLD, WTI CRUDE, DJIA, FTSE100, DAX
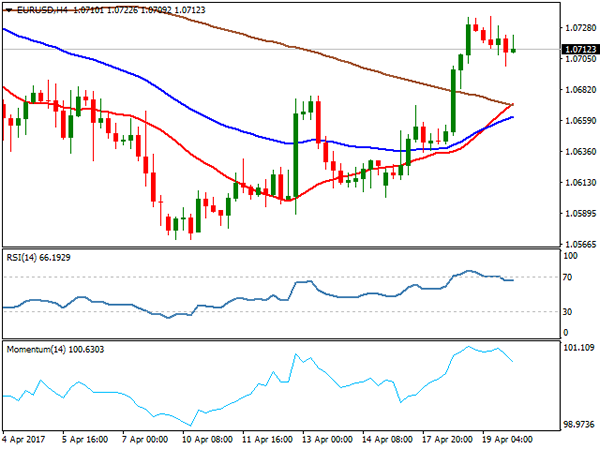
EUR/USD
The EURUSD pair eased from Tuesday's fresh nearly three-week high at 1.0735 which was retested on Wednesday, but strong barrier, shaped in daily Kijun-sen line, kept gains limited for now. Consolidation phase remained above broken 1.0700 barrier, reinforced by 20SMA at 1.0689 that keep in play fresh bullish momentum, gained on Tuesday's rally, for fresh attempts higher.
Slightly stronger dollar kept the Euro's near-term action at the back foot, however, dollar's gains were limited due to persisting geopolitical tensions and June rate expectations edging lower on weaker than expected US economic data and softer US economic growth expectations, as Trump administration no longer expects to complete tax reforms by August, as initially planned.
The Euro is expected to attempt above current highs and resume bull-leg from 1.0601 trough, after completing consolidation phase, which may extend below 1.0700/1.0689 support zone, but should not exceed next strong support and lower pivot at 1.0653 (daily Tenkan-sen / Fibonacci 61.8% retracement of 1.0601/1.0735 upleg).
Support: 1.0700, 1.0685, 1.0653, 1.0636
Resistance: 1.0738, 1.0777, 1.0800, 1.0826
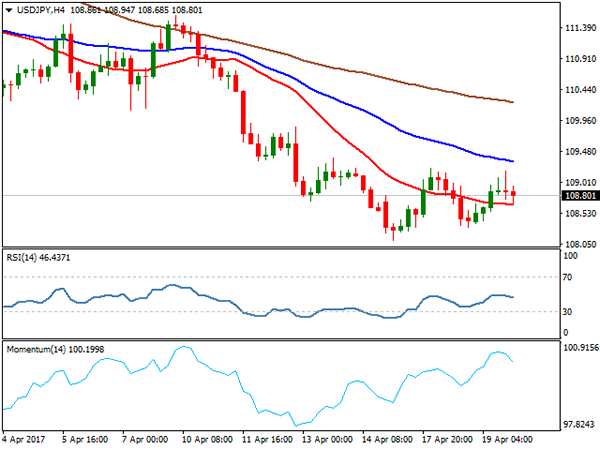
USD/JPY
USD JPY managed to hold above two-day low at 108.32 on Wednesday, but remained under 200SMA barrier at 108.85, after repeated probes above it failed. Another close below 200SMA will maintain negative near-term tone, as overall structure remains bearish. The dollar stays under pressure on rising tensions over North Korea that triggered strong migration from riskier assets into safe haven yen.
The price is expected to stay in extended consolidation above fresh five-month low at 108.11, signalled by reversal of slow stochastic from oversold zone on daily chart. Upside was so far limited at 109.20, ahead of pivotal 109.43 barrier (Fibonacci 38.2% of 111.57/108.11 downleg) and next strong barrier at 109.84 (daily Tenkan-sen) which is expected to cap extended upticks.
Larger bear-leg from 115.50, which also marks the third wave of five-wave cycle from 118.65, is looking for eventual close below its 100% Fibonacci expansion at 108.48, for attack at immediate target at 107.86 (Fibonacci 61.8% retracement of 101.18/118.65 rally).
The wave could travel to its FE 123.6% at 106.82 on break of the latter.
Alternatively, bounce above daily Tenkan-sen barrier would sideline immediate bearish threats for stronger correction of the downleg from 111.57.
Support: 108.32, 108.11, 107.86, 107.00
Resistance: 108.94, 109.22, 109.43, 109.84
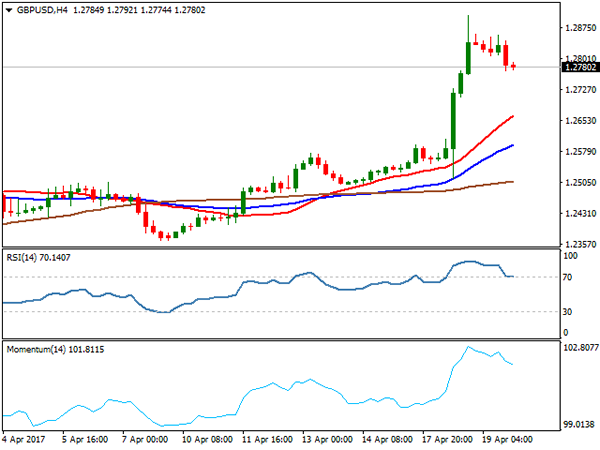
GBP/USD
British pound extended pullback from fresh high at 1.2905 (the highest since 03 Oct) posted after strong rally on Wednesday. Corrective easing was triggered by overbought studies and profit-taking Wednesday's strong rally, when the pair gained 2.2%.
However, decision for early election in the UK was welcomed by markets, as yesterday's rally of pound showed and fresh bullish sentiment has been established, keeping focus at the upside.
Fresh bulls are expected to attempt again at 1.2904 barrier, with possible extension towards psychological 1.3000 target, after markets fully digest the latest news.
Pullback's extension below 1.2800 handle faces solid support at 1.2755 (Fibonacci 38.2% of Wednesday's rally) ahead of 1.2700 and 1.2635 (daily Tenkan-sen) where extended downticks are expected to find ground.
Support: 1.2771, 1.2755, 1.2704, 1.2663
Resistance: 1.2859, 1.2905, 1.2950, 1.3000
AUDUSD
The Aussie dollar remained firmly in red on Wednesday and extended pullback from recovery high at 0.7610 (posted on Apr 17). Fresh weakness has eventually taken out strong supports at 0.7550 (200SMA) and 0.7519 (100SMA) and also broke below round-figure support at 0.7500, signalling full retracement of 0.7472/0.7610 upleg on final push towards key supports at 0.7472/60 (Apr 10/12 base / daily Ichimoku cloud base).
Daily technicals in firm bearish mode are supportive for further downside action on break below thick daily Ichimoku cloud and extension towards 0.7453 (50% retracement of 0.7158/0.7749, Jan/Mar rally.
Broken Daily Tenkan-sen and 200SMA at 0.7541/51 are expected to keep the upside protected.
Support: 0.7491, 0.7472, 0.7460, 0.7384
Resistance: 0.7519, 0.7541, 0.7551, 0.7576

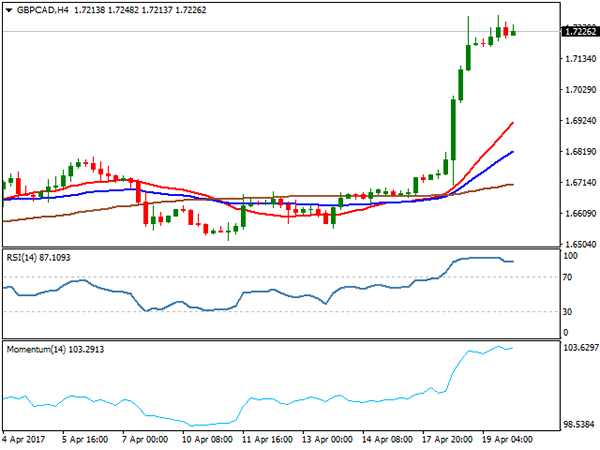
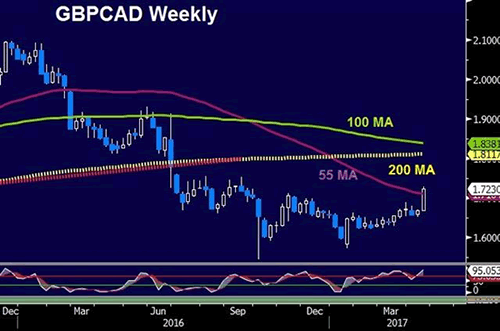
GBPCAD
The GBPCAD cross remained well supported on Wednesday and attempted higher again after narrow consolidation, posting fresh marginally higher multi-month high at 1.7280. Firm bullish sentiment is so far ignoring strongly overbought conditions of daily studies and continuing to aim higher.
Strong bullish acceleration was underpinned by double-bottom pattern formed on weekly chart at 1.5740 zone, which also marks the bottom of larger bear-trend from Jan 2016 high at 2.0918. The pair is focusing targets at 1.7524/42 (Sep 15 / Aug 03 highs) after pivots at 1.7037/1.7119 (Fibonacci 38.2% of 1.9127/1.5745 descend / Nov 11 highs) were taken out.
These levels now act as initial supports and guard significant point at 1.6988 (Fibonacci 38.2% of 1.6515/1.7280 rally), which is expected to contain deeper pullbacks.
Support: 1.7176, 1.7119, 1.7100, 1.7037
Resistance: 1.7280, 1.7454, 1.7524, 1.7542
GOLD
Spot Gold ended in red on Wednesday and extended pullback from fresh high at $1295 to briefly probe below $1275 (Fibonacci 38.2% of $1243/$1295 upleg). Quick bounce above $1275 pivot signalled that downside remains limited for now, as technical correction on overbought daily studies faces strong headwinds on Gold's safe haven buying on rising tensions around Korean peninsula.
However, technical studies show more room for extension of pullback from $1295. Rising daily Tenkan-sen line (currently at $1271) acts as good support, where extended easing should be ideally contained, before bulls regain control.
Near-term focus remains at $1295/$1300 targets, with break of the latter (which is seen very likely on rising uncertainty in the markets), expected to expose next barriers at $1307/15 (Nov 2 high / Sep 1 low).
Support: 1275, 1271, 1269, 1263
Resistance: 1283, 1290, 1292, 1295
WTI CRUDE OIL
WTI oil accelerated strongly lower on Wednesday, extending pullback from $53.74 peak to hit lows ticks ahead of psychological $50.00 support. Strong bearish acceleration broke below important supports at $51.75/62 (100/55SMA's), $51.19 (Fibonacci 38.2% of $47.07/$53.74) and 20SMA at $50.73. Oil prices dropped nearly 4% on Wednesday, on the biggest one-day loss since early March, after bearish U.S. inventories data, raised concerns that the increasing levels of U.S. shale oil production could weigh on OPEC's efforts to reduce output and support oil prices.
EIA report showed that crude oil inventories fell by 1 million barrels compared to forecast for nearly 1.5 million barrels draw in the week ending Apr 12.
The report had negative impact on oil price that dropped into dangerous territory near $50.00 pivot, loss of which would drag the price down to 200SMA at $48.92.
Wednesday's long bearish candle is expected to weigh on near-term action.
Recent bearish acceleration may take a breather on oversold daily slow stochastic, however, firmer bullish signal is awaited.
Support: 50.41, 50.00, 49.62, 48.92
Resistance: 51.19, 51.58, 51.75, 52.24
DJIA
Dow Jones remained under pressure on Wednesday and extended below daily Ichimoku cloud base which offered solid support during past few sessions. Daily close below the cloud will be seen as bearish signal for extension towards next significant supports at 20266 (Fibonacci 61.8% retracement of 19713/21160 upleg) and 20197 (rising 100SMA).
Daily technicals are establishing in firm bearish mode and maintain downside pressure, as overall sentiment for stocks is negative.
Broken cloud base now acts as solid resistance, which should ideally limit the upside and guard next pivotal barrier at 0500 (falling daily Tenkan-sen line).
Support: 20310, 20266, 20197, 20054
Resistance: 20385, 20437, 20500, 20580
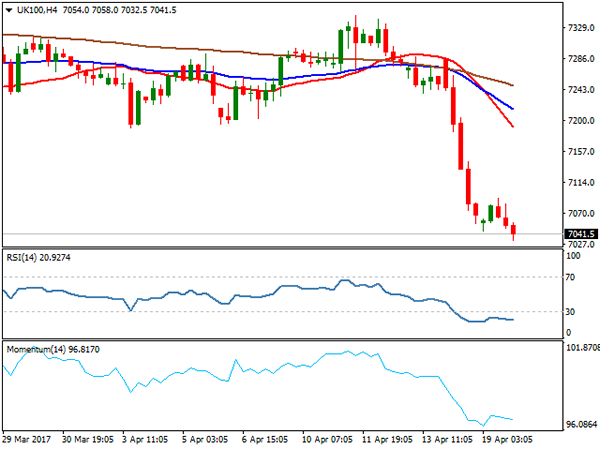
FTSE100
FTSE index stayed under pressure and extended losses on Wednesday, to hit new low at 7032, on the way towards target at 7024 (Feb 2 low). Full retracement of 7024/7444 rally will be seen as strong bearish signal for extension of larger bear-phase from fresh all-time high at 7444 (posted on Mar16) towards psychological 7000 support and 6969 (Fibonacci 61.8% retracement of larger 6675/7444 rally.
Broken daily Ichimoku cloud which will start turning lower next week, now marks strong barrier. Cloud base at 7192, reinforced by falling daily Tenkan-sen line is expected to cap stronger upside attempts.
Support: 7032, 7024, 7000, 6969
Resistance: 7091, 7144, 7192, 7235
DAX
DAX remained in red on Wednesday, as price action entered consolidation phase above Tuesday's fresh low at 11979, after bears cracked psychological 12000 support. Larger bear-phase off 12410 (Apr 03 peak) which currently rides on the third wave is signalling extension towards key support at 11878 (Mar 22 trough / top of rising daily Ichimoku cloud), for full retracement of 11878/12410 rally.
Strong bearish sentiment that dominates in the stock markets and bearish momentum building on daily studies are supportive for final attack at 11878 target.
Broken 20SMA at 12158 marks strong resistance which is expected to limit extended corrective upticks.
Support: 11979, 11943, 11878, 11718
Resistance: 12062, 12144, 12158, 1245
CAD in the Crosshairs
A drop in oil prices and reports that Canadian officials will try to tame the housing market sent USD/CAD close to 1.35 on Wednesday. The US dollar was the top performer while the Australian dollar lagged. New Zealand CPI and Japanese trade balance are up next. The Premium short in the DOW30 was closed for 205-pt gain, leaving another index trade open. There are 2 CAD trades in progress.
The Canadian dollar has been a challenge for traders this year. A series of headfakes, central bank mixed signals and false breakouts have kept the pair confined in a rough 1.30 to 1.35 range. Economic data has been extremely strong lately but the BOC has warned it's a mirage.
Meanwhile, two other factors threaten to break the range: Oil and housing.
Crude fell nearly $2 on Wednesday after the US reported an unexpected build in gasoline supplies, low demand and another rise in production. That final factor will irk OPEC and could scuttle a quota extension at the May 25 meeting.
If that's the case, crude and the Canadian dollar would swan dive in synch. The assumption is that Saudis will suck it up until after the Aramco IPO but that's a dangerous bet.
For the loonie, the wild card is housing. Tomorrow Ontario provincial government - where Toronto is located - will reportedly unveil 10 measures aimed at cooling the housing market. Leaks sound like they could be drastic as they include rent controls, taxes on foreign buyers, levies on speculators and more. Prices around Toronto have risen more than 30% in the past year and have tripled since 2000 so a correction is long overdue but heavy-handed government intervention could turn it into a rout.
The consumer has long been a major driver of Canadian economic strength but if housing wealth evaporates, so will spending (and CAD).
Technically, 1.3500 offered some tough resistance Wednesday even as oil prices were plunging. Beyond that, the March high of 1.3536 and the late-December, no liquidity high of 1.3599 are resistance. Also note that CAD/JPY is at the lowest since November and GBP/CAD is at the highest since September.
The loonie isn't the only commodity currency that's wilting; AUD and NZD are also nearing the lows of the year. A big factor in whether the kiwi gets there will be the Q1 CPI report due at 2245 GMT. The consensus is for a 0.8% q/q rise. That would be a healthy inflation boost and get prices up to 2.0% y/y.
At 2350 GMT, we'll be watching Japanese trade balance. The consensus is for a 608B yen surplus but more important will be trade growth. Exports are forecast to rise 6.2% and imports up 10.0%.
Fed Beige Book: Economic Activity Progressed at a Decent Clip to Cap off the First-Quarter
The most recent Beige Book notes that economic activity continued to expand at a modest-to-moderate pace throughout the country during the period of mid-February to the end of March, with half of the districts reporting moderate gains. The notion that weather effects may have contributed to a slowdown in economic activity during the first-quarter were not emphasized in the report.
Labor markets tightened further, with some contacts noting the potential for labor shortages. High-skilled IT workers, which were already reported to be in short supply in past rounds, are becoming more scarce with some employers noting worries around visa issuance regulations. Moreover, employers noted rising difficulty filling low-skilled positions.
Wages increased modestly, but have been blamed for restraining growth in some sectors, including manufacturing, transportation, and construction. Employers increasingly quoted rising turnover rates and indicated that they would raise wages moderately the coming months.
Low inventory levels have constrained sales activity despite strong demand for housing. This resulted in upward pressure on home prices across the country, a trend likely to be most detrimental to first-time homebuyers. Overall, in spite of higher mortgage rates demand for housing is strengthening as a consequence of income gains and an improving labor market.
Price increases were seen as only modest by businesses and were broadly little changed from the previous report. Small increases in selling prices were noted by manufacturers while restauranteurs only raised menu prices slightly as declines in grocery store prices only partly offset labor cost increases at restaurants.
The manufacturing sector continued to exhibit strength despite a slowdown in the pace of freight shipment growth. Lingering policy uncertainty around trade deals is likely still causing delays in investment, with most capital outlies related to maintaining existing equipment and less so for adding capacity.
Key Implications
Despite economic data pointing to a slowdown in economic activity through the end of March, businesses remained largely optimistic through the end of March supported by solid demand in several segments including manufacturing, IT, and restaurants.
Although business contacts across several industries cited policy uncertainty as worrisome, this Beige Book corroborates the sanguine attitude reported by other business sentiment readings March, such as the NFIB and ISM manufacturing indices.
All told, this Beige Book provides further confirmation that the economy is continuing to expand at a decent clip and suggests continued, albeit moderate, economic improvement - something that's likely enough to motivate the Fed to pursue its gradual rate-raising path.