
Sample Category Title
Markets Stabilizing, Dollar Recovers but Stays Weak against Europeans
Markets are stabilizing from yesterday's sharp volatility. Major European indices are trading in tight range with DAX and CAC holding mild gains at the time of writing. US indices also open nearly flat and are bounded in tight range. In the currency markets, Dollar recovers broadly today but is staying deep in red against European majors for the week. Commodity currencies remain broadly weak too. Sterling remains the strongest major currency this week even though it's paring some gains against Dollar and other Europeans. In other markets, Gold is trading lower by at it continues to struggle to find buying to push through 1300 handle. WTI crude oil is also staying in consolidation.
EC Juncker: Real Brexit negotiation will start after UK election
President of European Commission Jean-Claude Juncker had some "real talks" with UK Prime Minister Theresa May after the latter announced to call for a snap election in June. And Juncker's spokesman Margaritis Schinas said that Juncker considers that "the real political negotiations on article 50 with the United Kingdom will start after the elections foreseen for the 8th of June." Meanwhile, the EC sees UK election as a "domestic issue" and "will not intervene". European Council President Donald Tusk's spokesman said that "the UK elections do not change our EU27 plans." And, "we expect to have the Brexit guidelines adopted by the European Council on 29 April and following that the Brexit negotiating directives ready on 22 May. This will allow the EU27 to start negotiations."
May surprised the world by making a U-turn to announce that she will seek parliamentary approval to bring forward the election scheduled for May 2020 to June 8 this year. She explained that "because Brexit isn't just about the letter that says we want to leave, it's about negotiating the deal, about getting the right deal from Europe." And, "the public want us to deliver on leaving the European Union and they want us to build that stronger Britain for the future beyond leaving the European Union." It's generally expected that May will get over two-third of support from the parliament for the snap election.
ECB paper: Unconventional tools will remain in central banks' toolkits
In a paper titled Necessity as the mother of invention: monetary policy after the crisis, ECB noted that central banks in the world will have "broader mandates" in the future. Also, central banks will use "macro-prudential tools more widely" and communicate more than before the global financial crisis. The expected noted that most unconventional tools will remain in "central banks' toolkits. And that's "in particular because central bank governors who gain experience with a particular tool are considerably more likely to assess that tool positively" Separately, ECB governing council member, and Estonian central bank head Ardo Hansson said that the central bank will need more economic data before starting to consider change in its monetary policies.
Released from Eurozone, CPI was finalized at 0.8% mom, 1.5% yoy in March. Core CPI was finalized at 0.7% yoy. Both were unrevised. Eurozone trade surplus widened to EUR 19.2b in February.
Macron remains favorite to win French election
In France, centrist Emmanuel Macron remains the favorite to win the presidential election. According to a poll of 11601 people for Le Monde newspaper, Macron and far-right Marine Le Pen will come out of the first round of the election this Sunday as the leader. Support for Le Pen for the first round dropped 2.5% to 22.5%. Support for Macron for the first round. dropped 2% to 23.0. While there would be surprises, there should be enough safety margin, comparing to support for far-left Jean-Luc Melenchon (19.0%) and conservative Francois Fillon (19.5%).
USD/JPY Mid-Day Outlook
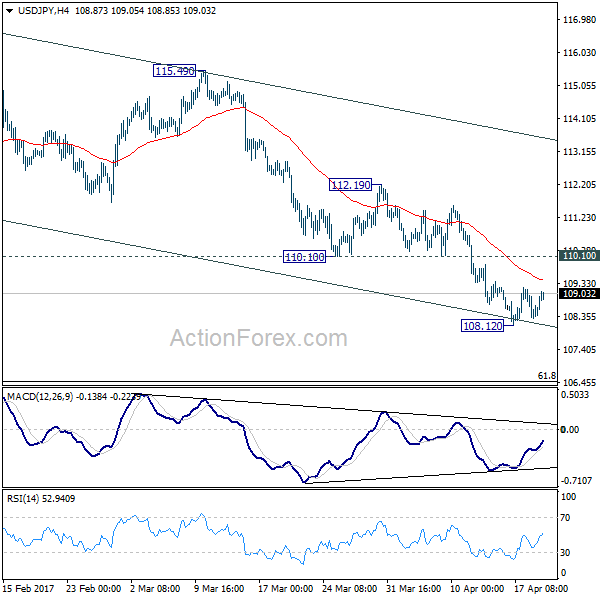
Daily Pivots: (S1) 108.09; (P) 108.65; (R1) 109.00; More....
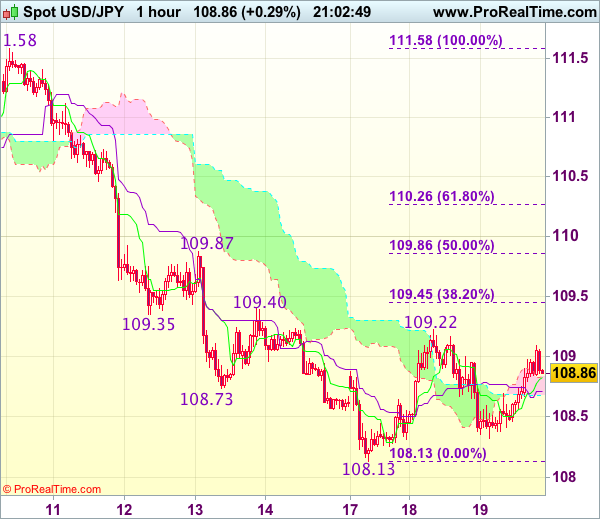
USD/JPY recovers mildly but stays in consolidation above 108.12 temporary low, below 110.10 resistance. Intraday bias stays neutral with bearish near term outlook. Rise from 98.97 is finished at 118.65 and fall from there would extend. On the downside, break of 108.12 will target 61.8% retracement of 98.97 to 118.65 at 106.48. Sustained break there will pave the way back to 98.97 low. Nonetheless, break of 110.10 will be the first sign of near term bottoming and turn bias back to the upside for 112.19 resistance instead.
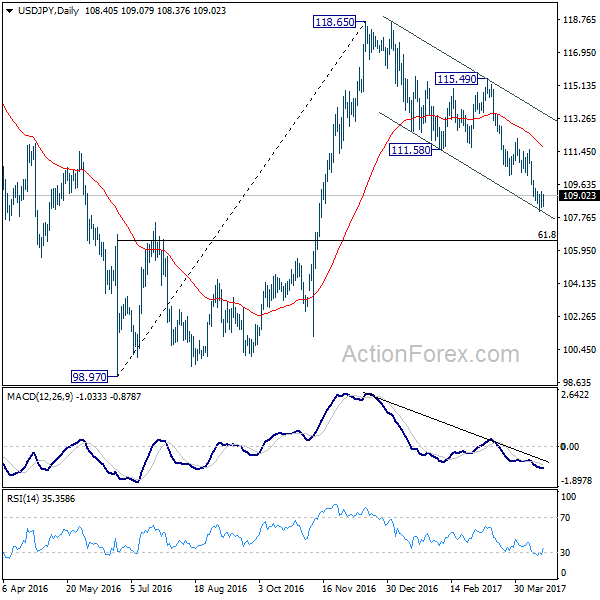
In the bigger picture, price actions from 125.85 high are seen as a corrective pattern. Current development suggests that it's not completed yet and is extending. In case of deeper decline, downside should be contained by 61.8% retracement of 75.56 to 125.85 at 94.77 to bring rebound. Rise from 75.56 is still expected to resume later after the correction from 125.85 completes.
Economic Indicators Update
| GMT | Ccy | Events | Actual | Forecast | Previous | Revised |
|---|---|---|---|---|---|---|
| 00:30 | AUD | Westpac Leading Index M/M Mar | 0.10% | -0.10% | ||
| 09:00 | EUR | Eurozone Trade Balance (EUR) Feb | 19.2B | 18.6B | 15.7B | |
| 09:00 | EUR | Eurozone CPI M/M Mar | 0.80% | 0.40% | 0.40% | |
| 09:00 | EUR | Eurozone CPI Y/Y Mar F | 1.50% | 1.50% | 1.50% | |
| 09:00 | EUR | Eurozone CPI - Core Y/Y Mar F | 0.70% | 0.70% | 0.70% | |
| 14:30 | USD | Crude Oil Inventories | -2.2M | |||
| 18:00 | USD | Federal Beige Book |
Trade Idea Update: USD/CHF – Hold short entered at 1.0000
USD/CHF - 0.9979
Original strategy :
Sold at 1.0000, Target: 0.9900, Stop: 1.0030
Position : - Short at 1.0000
Target : - 0.9900
Stop : - 1.0030
New strategy :
Hold short entered at 1.0000, Target: 0.9900, Stop: 1.0030
Position : - Short at 1.0000
Target : - 0.9900
Stop : - 1.0030
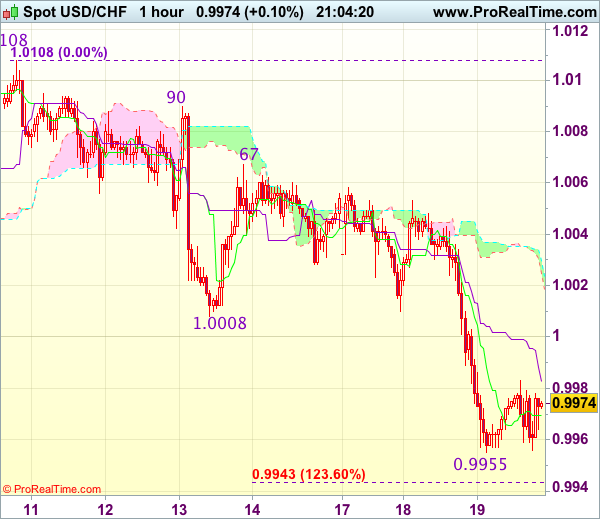
As the greenback has recovered after falling to 0.9955 yesterday, suggesting minor consolidation would be seen, however, reckon upside would be limited to the Kijun-Sen (now at 0.9998) and bring another decline later, below said support at 0.9955 would extend recent fall from 1.01089 top to 0.9943-48 (1.236 times projection and previous support) and then 0.9926 (61.8% Fibonacci retracement of 0.9813-1.0108) but reckon 0.9900-05 (1.618 times projection) would hold on first testing, bring rebound later.
In view of this, we are holding on to our short position entered at 1.0000. Above previous support at 1.0008 would defer and risk rebound to 1.0020-30 but still reckon indicated resistance at 1.0067 would remain intact.
Trade Idea Update: GBP/USD – Buy at 1.2650
GBP/USD - 1.2827
Original strategy :
Buy at 1.2720, Target: 1.2850, Stop: 1.2685
Position : -
Target : -
Stop : -
New strategy :
Buy at 1.2720, Target: 1.2850, Stop: 1.2685
Position : -
Target : -
Stop : -
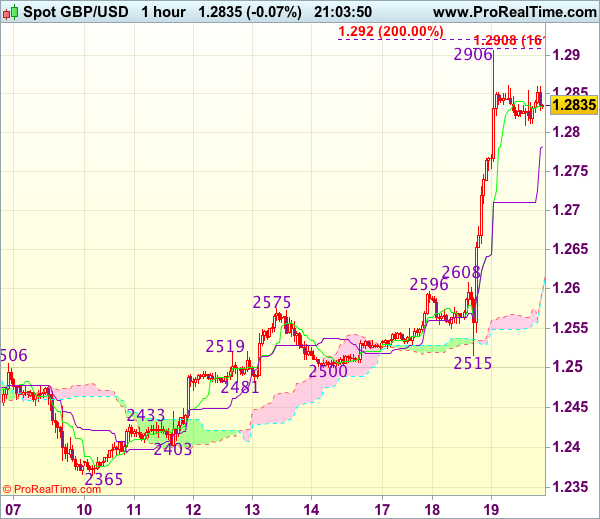
Yesterday’s rally from 1.2515 to 1.2906 signals recent upmove from 1.1986 low is still in progress and although price has eased from 1.2906 reckon downside would be limited to 1.2750 and 1.2700-10 should hold, bring another rise later, above said resistance at 1.2906 would extend recent rise to 1.2920-30 (2 times extension of 1.2365-1.2575 measuring from 1.2500), then 1.2950 but loss of near term upward momentum should prevent sharp move beyond 1.2990-00 (1.236 times projection of 1.2109-1.2616 measuring from 1.2365 and psychological resistance), risk from there is seen for a retreat to take place later.
In view of this, would not chase this rise here and would be prudent to buy cable on subsequent pullback as price should stay above 1.2700-10, bring another rise later. Below 1.2690-00 would defer and risk correction to 1.2660 but price should stay well above 1.2608-16 (previous resistance now support), bring another upmove.
Sterling, Euro and WTI in Focus
Sterling was catapulted to a fresh six-month high above 1.2900 during trading on Tuesday, as speculation heightened over the surprise snap general elections that are being used as a measure to reduce the risk of failure in the intricate Brexit negotiations. The likely possibility of Prime Minister Theresa May strengthening her party's majority as a result of the general elections on 8 June has alleviated some hard Brexit fears, with markets now pricing in a softer Brexit ending. Although this fresh development was successful in reviving Sterling bulls, the sharp price rebound felt excessive with Pound sensitivity possibly playing a key part.
Questions should be raised over the sustainability of the current Sterling rally, especially when considering how political uncertainties and Brexit woes remain current. Investors are still pondering over the economic future of the United Kingdom after Brexit, with questions still being raised about whether the two-year timeframe will be enough to secure a deal. Although the European Union has stated that they will not punish Britain during negotiations, the thought of the EU making an example out of Britain to prevent others from leaving the bloc does linger in the background.
While the technical outlook on the daily charts is undeniably bullish, the bearish Brexit fundamentals can attack at any given moment. The decisive breakout and daily close above 1.2775 could encourage a further incline higher towards 1.3000. In an alternative scenario, weakness below 1.2775 may open a path back towards 1.2600.
Euro and the French Presidential elections
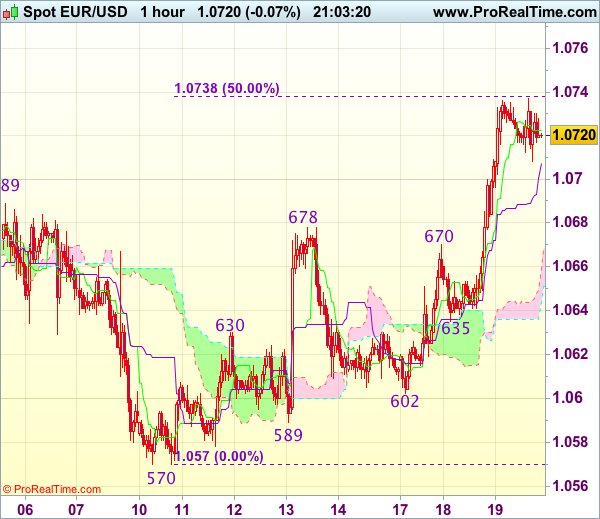
The EURUSD lurched towards 1.0735 on Tuesday, which had nothing to do with a change of bias towards the Euro, but was more about persistent Dollar weakness. Political risk remains a dominant theme in Europe, with anxiety set to heighten ahead of the first round of the French Presidential elections on 23 April. With the current polls displaying a fierce battle between four leading candidates, concerns have started to mount over the possibility of Marine Le Pen and Jean-Luc Mélenchon making it into the second round. Although Macron and Fillon were labeled as the favorites to win the election if they faced Marine Le Pen in the second round, polls have been incorrect in the past, and could be proven wrong again, with the Brexit shocker and Trump's presidential victory acting as prime examples.
From a technical standpoint, the fact that the sharp rebound on the EURUSD elevated prices above the previous 1.0685 lower high could support bulls in the short term. A breakout above 1.0750 may open a path higher towards 1.0820. This short term bullish setup remains valid above 1.0685.
Stock markets gripped by uncertainty
The horrible amalgamation of geopolitical tensions, political risks, ongoing uncertainty and fading optimism over Trump moving forward with his fiscal spending plans have soured risk appetite this week. Asian shares were mostly lower during early trading on Wednesday, with the bearish domino effect obstructing gains in Europe. Wall Street concluded Tuesday in the red territory, which could roll over this afternoon as the visible deflation of the reflation trade compounds to the downside pressures.
Commodity spotlight - WTI Crude
WTI Crude descended lower on Tuesday, with prices stabilizing above $52 after U.S crude stockpiles fell less than anticipated. The government reports of U.S Shale ramping up output sharply in May fueled the selloff, as bears exploited the concerns over excessive supply in the global markets. Oils oversupply woes may remain a critical theme which limits how far prices appreciate in the medium to longer-term. From a technical standpoint, although WTI Crude is bullish on the daily charts, bears have an opportunity to pull prices lower if the $52 support is breached.
Trade Idea Update: EUR/USD – Buy at 1.0685
EUR/USD - 1.0721
Original strategy :
Buy at 1.0690, Target: 1.0790, Stop: 1.0655
Position : -
Target : -
Stop : -
New strategy :
Buy at 1.0685, Target: 1.0785, Stop: 1.0650
Position : -
Target : -
Stop : -
The single currency has maintained a firm undertone after yesterday’s rally, adding credence to our view that the erratic rise from 1.0570 low is still in progress and upside risk remains for further gain to 1.0738-40 (50% Fibonacci retracement of 1.0906-1.0570) and possibly towards 1.0775-80 (61.8% Fibonacci retracement) but reckon 1.0800-10 would hold from here, bring retreat later.
In view of this, would not chase this rise here and would be prudent to buy euro on pullback as 1.0680-85 should limit downside. Only below support at 1.0635 would abort and signal top is formed instead, risk weakness towards 1.0602 support.
EUR/JPY Bulls Broke Major Downtrend Line Resistance
EURJPY had been trading along the upside short-term downtrend line resistance since March 22, saw a record losing streak. It was caused by the strengthening of the yen pushed up by markets' risk aversion sentiment.
This morning we saw the release of the Eurozone CPI and core CPI for March (YoY), were 1.5% and 0.7% respectively, in line with expectations and the previous figures.
The Eurozone trade balance for February was a 17.8-billion-euro surplus, beating expectations of a 16.2-billion surplus and the previous figure of a 0.6 billion deficit.
EUR/JPY has reversed since April 17 after testing the mid-term major support zone.
Tuesday April 18, the bulls broke the downtrend line resistance, trading above the newly-formed uptrend line support.
On the 4-hourly chart, the 10 SMA crossed over the 20 SMA from below on Tuesday, indicating the trend has turned bullish.
The resistance level is at 117.00, followed by 117.30 and 117.60.
The support line is at 116.50, followed by 116.25 and 116.00.
Keep an eye on the Japanese exports and imports for March (YoY), to be released at 00:50 BST on Thursday April 20, as it will likely affect the strength of JPY and JPY crosses.


Trade Idea Update: USD/JPY – Hold long entered at 108.45
USD/JPY - 108.92
Original strategy :
Bought at 108.45, Target: 109.45, Stop: 108.30
Position : - Long at 108.45
Target : - 109.45
Stop : - 108.30
New strategy :
Hold long entered at 108.45, Target: 109.45, Stop: 108.30
Position : - Long at 108.45
Target : - 109.45
Stop : - 108.30
Although the greenback slipped to 108.32 overnight, as dollar found renewed buying interest there and has staged a rebound, retaining our view that further consolidation above this week’s low at 108.13 would be seen and test of resistance at 109.22 is likely, break there would add credence to our view that a temporary low has been formed there, bring retracement of recent decline to 109.40-45 (previous resistance and 38.2% Fibonacci retracement of 111.58-108.13), however, reckon upside would be limited to 109.86-87 (50% Fibonacci retracement and previous resistance) and price should falter below 110.25-30 (61.8% Fibonacci retracement), bring retreat later.
In view of this, we are holding on to our long position entered at 108.45. Below 108.30-32 would risk retest of 108.13 support (this week’s low) but break there is needed to signal recent decline has resumed and extend weakness to 107.75-80 later.
Trade Idea: GBP/USD – Buy at 1.2750
GBP/USD – 1.2848
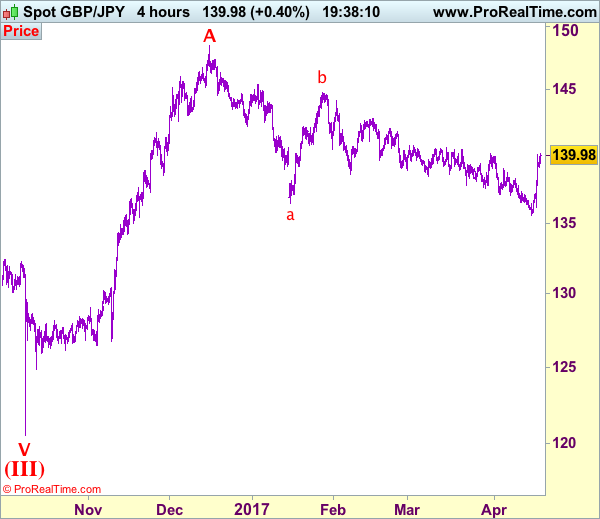
Recent wave: Wave V of larger degree wave (III) has ended at 1.1986 and major correction has commenced from there for gain to 1.3000 and 1.3140-50
Trend: Near term up
Original strategy :
Buy at 1.2400, Target: 1.2600, Stop: 1.2340
Position: -
Target: -
Stop: -
New strategy :
Buy at 1.2750, Target: 1.2950, Stop: 1.2690
Position: -
Target: -
Stop:-
Cable rallied yesterday and broke above indicated previous resistance at 1.2706, adding credence to our view that the wave c as well as larger degree wave B has ended at 1.2109, hence impulsive wave C has commenced from there with wave i of C ended at 1.2616, follow by a correction to 1.2365 (end of wave ii) and wave iii rally is unfolding, hence further gain to 1.2940-50 and possibly psychological resistance at 1.3000 would be seen, however, near term overbought condition should limit upside to 1.3050-60.
Our preferred count on the daily chart is that cable's rebound from 1.3500 (wave (A) trough) is unfolding as a wave (B) with A ended at 1.7043, followed by triangle wave B and wave C as well as wave (B) has ended at 1.7192, the subsequent selloff is the larger degree wave (C) which is still unfolding with minor wave (III) of larger degree wave 3 ended at 1.1986, hence wave (IV) correction is in progress which could either be a triangle wave (IV) of a complex formation but upside should be limited to 1.3500 and price should falter well below 1.4000, bring another decline in wave (V) of 3 for weakness to 1.1500, then 1.1200.
On the downside, whilst initial pullback to 1.2795-00 is likely, reckon downside would be limited and 1.2740-50 should attract renewed buying interest and bring another rally later. Below 1.2690-00 would defer and risk correction to 1.2660-65 but another previous resistance at 1.2616 (wave i top) should remain intact.
Trade Idea: GBP/JPY – Buy at 139.10
GBP/JPY - 140.00
Recent wave: Medium term low formed at 120.50 and (A)-(B)-(C) major correction has commenced with (A) leg ended at 148.45, hence wave (B) is unfolding for retreat to 131.00-10.
Trend: Near term up
Original strategy:
Buy at 136.00, Target: 138.00, Stop: 135.40
Position: -
Target: -
Stop: -
New strategy :
Buy at 139.10, Target: 141.10, Stop: 138.50
Position: -
Target: -
Stop:-
Sterling found renewed buying interest at 136.15 (missed our long entry at 136.00) and has rallied in line with our bullish expectation, adding credence to our view that a temporary low has been formed at 135.60, hence consolidation with mild upside bias remains for the rise from there to bring retracement of recent decline to 140.40-50, then 140.75, however, near term overbought condition should limit upside to 141.10-15 and price should falter well below resistance at 141.75.
Our preferred count is that larger degree wave V with circle is unfolding from 251.12 with wave (I) 219.34, (II): 241.38 and wave (III) is subdivided into 1: 192.60, 2: 215.89 (23 Jul 2008) and wave 3 ended at 118.87 earlier in 2009. The correction from there to 162.60 is wave 4 which itself is a double three and is labeled as first a-b-c ended at 151.53, followed by wave x at 139.03, 2nd a ended at 162.60, 2nd b at 146.75 and 2nd c leg of wave 4 ended at 163.00. Therefore, the decline from 163.00 to 116.85 is now treated as wave 5 which also marked the end of larger degree wave (III), hence wave (IV) major correction has commenced for retracement of the wave (III) from 241.38 and upside target at 183.95-00 (50% Fibonacci retracement of the wave (II) from 241.38) had been met, a drop below 160.00 would suggest wave (IV) has ended at 195.85, bring decline in wave (V) for initial weakness to 130 (already met) and 120.
On the downside, while pullback to 139.50-60 is likely, reckon 139.00-10 would limit downside and bring another rise later. Below 138.30-35 would abort and suggest top is formed, bring further fall to 138.00 but downside should be limited to 137.70-75 and price should stay well above 137.00-10, bring another rise later.
DAX Shrugs Off Lower Eurozone CPI
The DAX remains close to the 12,000 level, as the index trades at 12,024.25 on Wednesday. On the release front, Eurozone Final CPI came in at 1.5%, matching the forecast. The Eurozone trade surplus jumped to EUR 19.2 billion, above the estimate of EUR 18.6 billion. On Thursday, we’ll get a look at German PPI and Eurozone Consumer Confidence.
Eurozone consumer inflation softened in March, but matched the forecasts. Final CPI slipped to 1.5%, compared to 2.0% a month earlier. The indicator had been steadily rising, and climbed to 2.0% in February, which is the ECB’s inflation target. This had led to speculation that the ECB might have to consider tightening its monetary policy, either by lowering interest rates or tapering its asset-purchase program (QE). The ECB’s asset-purchase program is scheduled to remain in place until December, although the central bank could opt to bring up that date or taper QE if growth and inflation numbers in the Eurozone are unexpectedly strong. There are also political considerations at play, as the ECB is reluctant to make any significant monetary moves with upcoming elections in France and Germany.
France goes to the ballot box on April 23 in the first round of the presidential election. A opinion poll on Wednesday shows an extremely race, with centrist Emmanuel Macron at 23% and far-right candidate Marine Le Pen at 22.5%. They are followed by center-right Francois Fillon at 19.5% and far-left Jean-Luc Melenchon at 19 percent. If Macron and Le Pen reach the second round, Macron is expected to win decisively by a margin of 64-36. Any significant changes in the polls could affect stock market movement.
The Federal Reserve has broadly hinted that it plans two more rate hikes in 2017. There have been calls from some Fed policymakers to raise rates three more times, but this seems unlikely, given disappointing retail sales and CPI numbers in March. These weak numbers are likely to make the Fed more dovish, and prompted the Atlanta and New York Federal Reserve banks to lower their outlook for US economic growth for the first quarter of 2017. The Fed can point to a labor market that is close to capacity as well as strong consumer confidence, but this has not translated into stronger consumer spending, a key driver of economic growth. What can we expect next from the Fed? The odds of a rate hike in June are currently priced at 55%, according to the CME Group, down from 65% earlier in April.