Sample Category Title
Politics Dominates FX Moves
The pound is stable after yesterday's surprise announcement by PM Theresa May to call a snap general election for June 8.
On Tuesday, sterling had its second-best day outright since last June's Brexit vote, after PM May went back on repeated promises not to call a sudden election. The 2.4-cent rise in the pound since late Monday recovers a tenth of the loss since last years vote.
For sterling traders, the election does nothing at all to change the outcomes from the European side, where tough talk is still the order of the day.
The stakes for this Sunday's French Presidential election vote are high, with two anti-EU and anti-EUR candidates among the four contenders (the far-right Le Pen, centrist independent Macron, center-right Fillon and far-left Melenchon).
Macron and far-right leader Marine Le Pen have lost steam in the run-up to this weekend's vote, however, the pair are still expected to qualify for the May 7 run-off, with the centrist Macron winning that second-round according to this morning's poll in the Le Monde newspaper.
In the second round, Le Pen is unlikely to significantly increase her support beyond her base and voters of the moderate left and right will amalgamate around Macron. Polls show him winning by margins of around +25% – this scenario will support Europe's ‘single' unit.
The standoff over North Korea's nuclear weapons program continues to drag on.
1. Asian stocks slump as China selloff deepens, Europe mixed
In Japan, stocks traded relatively flat overnight as investors again refrained from taking large positions as geopolitical tensions continue to sour the mood.
The Nikkei 225 share average edged up +0.07%, while the broader Topix was down -0.01%.
In Hong Kong, stocks fell for the third straight session, following China equities lower as investors remain worried that Beijing's stepped-up property curbs and deleveraging campaign will slow China's economic growth. The Hang Seng index fell -0.4%, while the China Enterprises Index lost -0.6%.
In China, the Shanghai Composite Index fell -0.8%, taking its four-day loss to -3.2%.
In Europe, equity indices are trading mixed as political uncertainty in France and the UK continues to weigh on the markets. Banking stocks are providing some support on the Eurostoxx, while commodity and mining stocks are trading notably higher in the FTSE 100.
U.S equities are set to open in the black (+0.3%).
Indices: Stoxx50 flat at 3,420, FTSE -0.1% at 7,142, DAX +0.2% at 12,023, CAC-40 +0.2% at 5,000, IBEX-35 % +0.7at 10,334, FTSE MIB +1.2% at 19,677, SMI -0.3% at 8,503, S&P 500 Futures +0.3%.
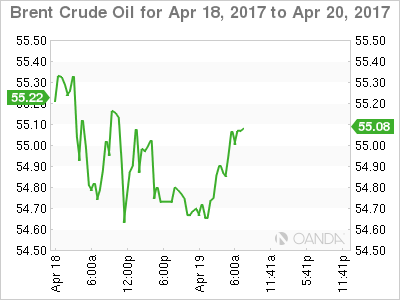
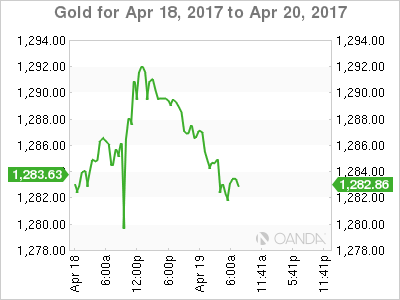
2. Oil prices stable on OPEC's commitment, gold little changed
Oil prices are stable ahead of the U.S open as OPEC said it was committed to draw down a global supply overhang that has been plaguing the markets for the past three-years. However, U.S output and inventories still cap market prices.
Brent crude futures are unchanged at +$54.92 per barrel, while U.S West Texas Intermediate (WTI) crude futures trade at +$52.43 a barrel.
OPEC's secretary general said the group was “committed to restoring market stability by bringing global inventories down to the industry's five-year average.” Also, a fall in shipments from the top exporter, the Saudi's, is lending the market some support.
Capping prices is yesterday's API data that showed that the U.S market remains bloated. Despite crude inventories falling by -840k in the week to April 14 to +531.6m barrels, they still remain near record highs, while gas stocks rose by +1.4m barrels.
Expect the market to take their cue from today's EIA report at 10:30 am EST.
Gold has declined -0.4% to +$1,284.24 an ounce after closing at the highest since November in yesterday's session. Geopolitical risks continue to provide support on pullbacks.
Iron ore has put the brakes on its recent plunge in prices, rising +2% overnight after losing -8% in the first two-days of this week.
3. Geopolitical concerns provide support for bonds
Long-dated German yields (+0.876%) are trading atop of their lowest levels for this year as investors' continue to retreat to safe assets in the face of concerns over geopolitical tensions and the upcoming presidential election in France. The gap between French and German 10-year yields stands at around +73 bps – it has been trading in the low to mid-70s over the past week.
Note: In March, the yield on the German 30-year bond hit +1.29%, its highest in more than a year.
Elsewhere, the odds of the Fed raising interest rates in June have fallen to about +44% from more than +60% earlier this month as investors continue to question the strength of the U.S economy after weaker than expected data over the past week.
U.S 10's have backed up +3 bps to +2.20% after plummeting -8 bps yesterday.
Overnight, the yield on Japan's benchmark 10-year government note touched zero, while the Aussie 10-year yield (+2.46%) fell to its lowest since November.
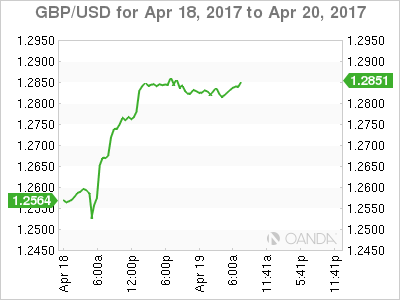
4. Sterling drops, but more gains expected
Sterling has eased a tad from its elevated levels, with GBP/USD last down -0.2% at £1.2815. The pound has managed to surge from levels below £1.26 on Tuesday morning, ahead of the U.S open, after snap elections were announced for June.
Pound ‘bulls' now expect more gains on the prospect of a hefty majority for PM May's Conservative party. The techies are eyeing £1.3000 as their medium term target, however, it should not be a “straight line” with consolidation and selling expected after such a one directional move.
The U.K. parliament votes on the election later this morning, but this is seen a formality.
5. Eurozone returns to a trade surplus
Data this morning shows that the eurozone's trade balance with the rest of the world returned to surplus in February after January's deficit print – a boost to hopes that E.U's modest recovery gathered momentum in Q1.
The 19 countries that use the EUR exported -€170.3B of goods to countries outside the currency area, while importing goods valued at +€152.6B from the U.S., the U.K. and other economies, leaving a surplus of +€17.8B.
Note: In January, the eurozone ran a deficit of -€600M, the first such gap for three years.
Adjusting for seasonal effects, the eurozone's exports rose by +0.4% from January, while imports were down -1.7%.
GBP/USD Elliott Wave Analysis
GBP/USD – 1.2850
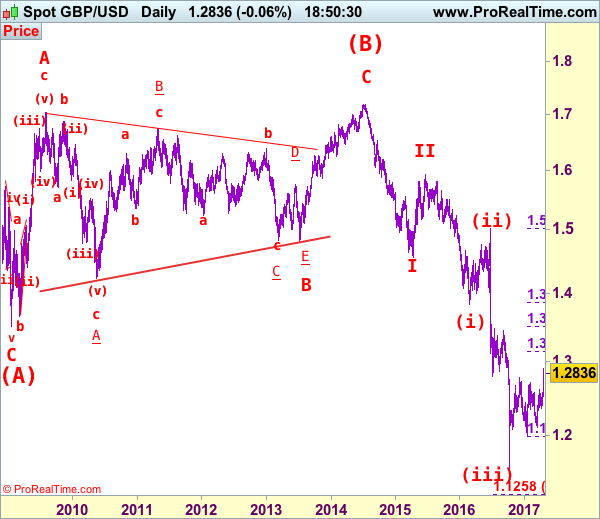
GBP/USD – Wave 4 is unfolding as an (A)-(B)-(C) and could have ended at 1.7192
Cable continued finding decent demand just above 1.2500 level and has rallied above indicated previous resistance at 1.2706 as well as 1.2775, adding credence to our view that low has indeed been formed at 1.1986 and bullishness remains for the erratic rise from 1.1986 to bring retracement of medium term decline, hence further gain to 1.2910-20 and 1.2950-60 would be seen, however, reckon psychological resistance at 1.3000 would limit upside and price should falter below 1.3140-50 (38.2% Fibonacci retracement of 1.5018-1.1986).
Our preferred count on the daily chart is that cable's rebound from 1.3500 (wave (A) trough) is unfolding as a wave (B) with A ended at 1.7043, followed by triangle wave B and wave C as well as wave (B) has possibly ended at 1.7192, below support at 1.4232 would add credence to this count, then further fall to 1.4000 level would follow but reckon downside would be limited to 1.3655 support and price should stay above previous support at 1.3500.
On the downside, whilst initial pullback to previous resistance at 1.2775 cannot be ruled out, reckon another previous resistance at 1.2706 would turn into support and contain downside, bring another rise later. Below previous resistance at 1.2616 (tentatively wave i top) would abort and suggest top is possibly formed, risk weakness to 1.2550-60 but break of 1.2500 support is needed to provide confirmation.
Recommendation: Buy at 1.2750 for 1.2950 with stop below 1.2650.
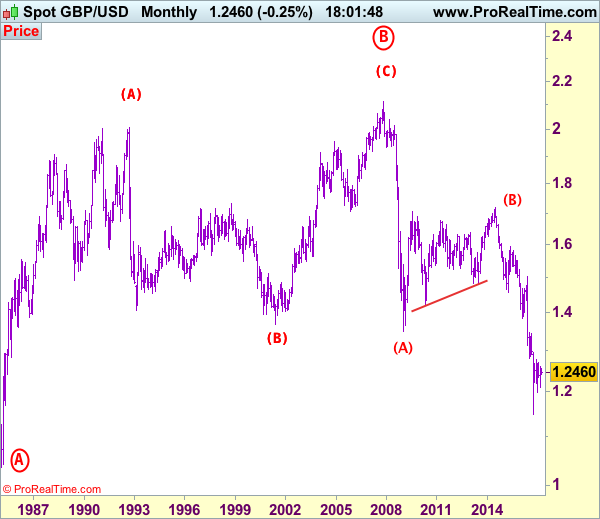
Longer term - Cable's rise from 1.0520 (Feb 1985) to 2.0100 (September 1992) is seen as [A], the decline to 1.3682 is labeled as (B) and (C) wave rally has ended at 2.1162 (9 Nov, 2007) which is also the top of larger degree wave B with circle. The selloff from there is a 5-waver with wave (A) ended at 1.3500 (23 Jan 2009), wave (B) itself is labeled as A: 1.6733, triangle wave B: 1.4813 and wave C as well as top of wave (B) ended at 1.7192 (2014), hence the selloff from there is an impulsive wave (C) with wave I : 1.4566, wave II 1.5930, an extended wave III is unfolding and already exceeded our downside target at 1.3500 and 1.3000, hence weakness to 1.2500 and possibly 1.2000 cannot be ruled out, however, price should stay well above psychological level at 1.0000.
Technical Outlook: FTSE Is Consolidating After Heavy Losses On Tuesday, Outlook Remains Negative
FTSE is consolidating after heavy losses on Tuesday when the index fell nearly 3% in the biggest one-day fall since 08 Apr 2011, triggered by strong rally of sterling, after UK PM May called for early election.
The index hit the lowest since early Feb at 7045 on today’s brief extension lower, focusing ked med-term support at 7024 (02 Feb low) to complete 7024/7444 bull-phase and open way for further retracement of larger 6675/7444 (02 Feb / 16 Mar ascend).
Psychological 7000 level marks next target, ahead of 200SMA at 6974 and Fibo 61.8% of 6675/7444 at 6969.
Technical studies turned into firm bearish mode on daily chart, as Tuesday’s fall broke below ascending daily cloud which underpinned the rally since early Dec.
Also, completion of asymmetric H&S pattern on daily chart, added on growing pressure.
Corrective attempts on oversold daily studies face initial resistance at 7100, followed by broken 100SMA at 7145, which is expected to limit recovery and guard next pivot at 7192 (daily cloud base, reinforced by Tenkan-sen line).
Res: 7100, 7145, 7192, 7234
Sup: 7045, 7024, 7000, 6969
GBP/JPY Elliott Wave Analysis
GBP/JPY – 139.80
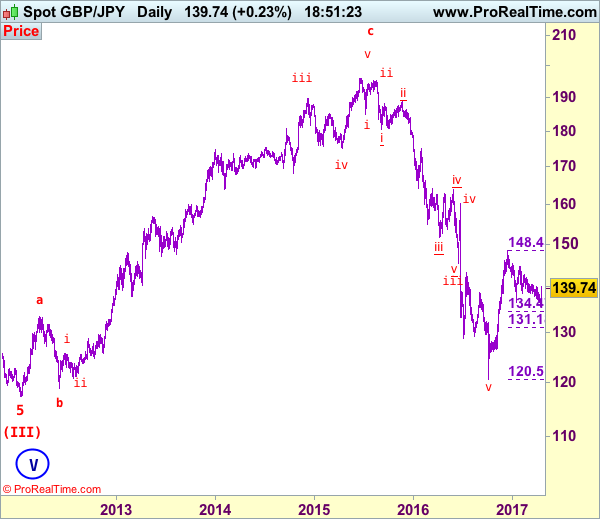
GBP/JPY – Wave 5 as well as wave (III) has possibly ended at 116.85
Although sterling extended recent decline to as low as 135.60, the subsequent rebound suggests low has possibly been formed there and gain to 140.10 is likely, however, a daily close above 140.60-65 is needed to add credence to this view, bring further gain to 141.75-80 and then 142.00 but only a sustained break above resistance at 142.80 would retain bullishness and signal recent fall from 148.45 has ended, then headway to 143.50-60 would follow but resistance at 144.75-80 should remain intact.
Our preferred count is that larger degree wave V with circle is unfolding from 251.12 with wave (I) 219.34, (II): 241.38 and wave (III) is subdivided into 1: 192.60, 2: 215.89 (23 Jul 2008) and wave 3 ended at 118.87 earlier in 2009. The correction from there to 162.60 is wave 4 which itself is a double three and is labeled as first a-b-c ended at 151.53, followed by wave x at 139.03, 2nd a ended at 162.60, 2nd b at 146.75 and 2nd c leg of wave 4 ended at 163.00. Therefore, the decline from 163.00 to 116.85 is now treated as wave 5 which also marked the end of larger degree wave (III), hence wave (IV) major correction has commenced for retracement of the wave (III) from 241.38 and upside target at 183.95-00 (50% Fibonacci retracement of the wave (II) from 241.38) had been met, a drop below 160.00 would suggest wave (IV) has ended at 195.85, bring decline in wave (V) for initial weakness to 130 (already met) and 120.
On the downside, whilst pullback to 139.00-10 is likely, reckon downside would be limited to 138.50-60 and renewed buying interest should emerge around 138.00, bring another rise later. Below previous minor resistance at 137.10 would abort an risk weakness to 136.10-15 but said support at 135.60 should remain intact. Only break there would abort and signal the erratic fall from 148.45 is still inn progress for weakness to 135.00, then 134.45-50 (50% Fibonacci retracement of 120.50-148.45).
Recommendation: Buy sterling at 138.00 for 141.00 with stop below 137.00.
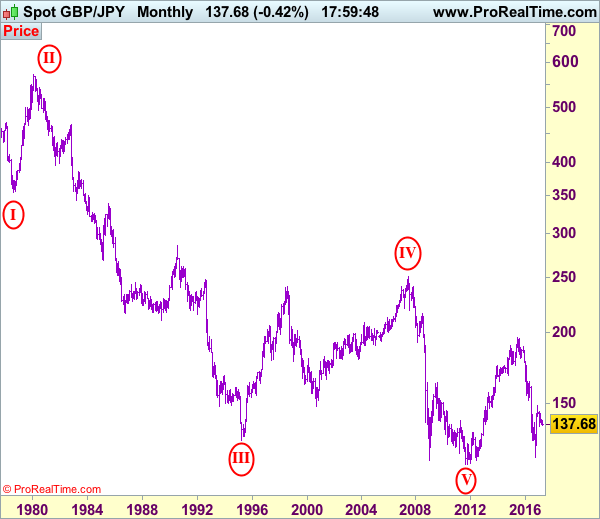
The long-term downtrend from 570.99 (29 Feb 1980) is labeled as an impulsive wave with III with circle ended at 129.77 (20 Apr 1995) and the corrective rebound to 251.12 (20 Jul 2007) is treated as wave IV with circle and the wave V with circle selloff from 251.12 has possibly ended at 116.80 (almost reached our indicated target at 116.00) and major correction has commenced from there and indicated upside target at 183.90-00 (50% Fibonacci retracement of 251.10-116.85) had been met, reckon upside would be limited to 199.80-90 (61.8% Fibonacci retracement) and bring wave (V) decline in later part of 2017.
Euro Steady As Eurozone CPI Matches Forecast
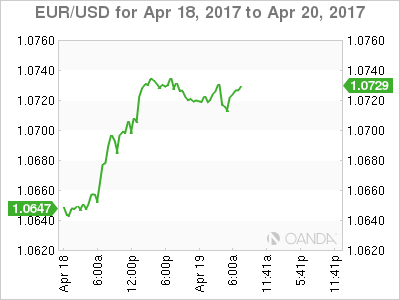
EUR/USD is almost unchanged on Wednesday, following gains in the Tuesday session. Currently, the pair is trading just above the 1.07 level. On the release front, Eurozone Final CPI came in at 1.5%, matching the forecast. The Eurozone trade surplus jumped to EUR 19.2 billion, above the estimate of EUR 18.6 billion. There are no major US releases on the schedule. On Thursday, the US releases the Philly Fed Manufacturing Index and unemployment claims. As well, US Treasury Secretary Steven Mnuchin will speak at event in Washington.
Eurozone consumer inflation indicators dropped in March, but matched the forecasts. Eurozone Final CPI slipped to 1.5%, compared to 2.0% a month earlier. The indicator had been steadily rising, and climbed to 2.0% in February, which is the ECB’s inflation target. This had led to speculation that the ECB might have to consider tightening its monetary policy, either by lowering interest rates or tapering its asset-purchase program (QE). The ECB’s asset-purchase program is scheduled to remain in place until December, although the central bank could opt to bring up that date or taper the program if growth and inflation numbers in the Eurozone are unexpectedly strong. There are also political considerations at play, as the ECB is reluctant to make any significant monetary moves with upcoming elections in France and Germany.
Investors are closely following the French presidential election, with the first round of voting on April 23. The race remains extremely tight, with centrist Emmanuel Macron and far-right candidate Marine Le Pen tied at 22 percent. They are followed by center-right Francois Fillon at 21% and far-left Jean-Luc Melenchon at 18 percent. If Macron and Le Pen reach the second round, Macron is expected to win decisively by a margin of 64-36. With only a few days to go before the vote, polling numbers will be closely watched, and any significant changes in the polls could impact on the euro.
The Federal Reserve has broadly hinted that it plans two more rate hikes in 2017. There have been calls from some Fed policymakers to raise rates three more times, but this seems unlikely, given disappointing retail sales and CPI numbers in March. These weak numbers are likely to make the Fed more dovish, and prompted the Atlanta and New York Federal Reserve banks to lower their outlook for US economic growth for the first quarter of 2017. The Fed can point to a labor market that is close to capacity as well as strong consumer confidence, but this has not translated into stronger consumer spending, a key driver of economic growth. What can we expect next from the Fed? The odds of a rate hike in June are currently priced at 55%, according to the CME Group, down from 65% earlier in April.
GOLD Moving Sideways, SILVER Falling, CRUDE Declining Within Bearish Channel.
GOLD Moving sideways.
Gold remains in a range above support at 1272 and below resistance at 1295. This validates a bullish reversal pattern with an upside potential at 1337. Support can be located 1263 (previous resistance) has induced some buying interest. Another hourly support lies at 1260 (rising trendline). An hourly resistance can now be found at 1280 (intraday high).
In the long-term, the technical structure suggests that there is a growing upside momentum. A break of 1392 (17/03/2014) is necessary ton confirm it, A major support can be found at 1045 (05/02/2010 low).
SILVER Falling.
Silver reversed previous bullish momentum yet not technical picture. Silver is now targeting support at 18.15 (rising trendline). Strong resistance is given at a distance at 19.00 (09/11/2017 high). Key support is given at 17.74 (10/04/2017 low) then 16.82 (15/03/2017 low).
In the long-term, the death cross indicates that further downsides are very likely. Resistance is located at 25.11 (28/08/2013 high). Strong support can be found at 11.75 (20/04/2009).
CRUDE Declining within bearish channel.
Crude oil has pulled-back after its recent sharp rise. Support can be located at 50.71 (08/02/2017 low). Hourly resistance can be located at 54 (07/04/2017 high then strong resistance stands at 55.24 03/01/2017 high).
In the long-term, crude oil has recovered after its sharp decline last year. However, we consider that further weakness are very likely. Strong support lies at 24.82 (13/11/2002) while resistance can now be found at 55.24 (03/01/2017 high).
EUR/JPY Strong Recovery Bounce, EUR/GBP Sharp Decline, EUR/CHF Drifting Higher.
EUR/JPY Strong recovery bounce.
EUR/JPY has bounced before challenging the resistance at 116.75 (falling trendline). Key resistance stands at 117.43 then 122.88 (13/03/0217 high). Support is given at 114.90 (18/04/2017low).
In the longer term, the technical structure validates a medium-term succession of lower highs and lower lows. As a result, the resistance at 149.78 (08/12/2014 high) has likely marked the end of the rise that started in July 2012. Strong support at 94.12 (24/07/2012 low) looks nonetheless far away.
EUR/GBP Sharp decline.
EUR/GBP has broken the key supports 0.8450 (31/12/2016 low). The short-term technical structure is negative as long as the hourly resistance at 0.8596 holds. Another resistance can be found at 0.864. Expected to show continued weakness.
In the long-term, the pair has largely recovered from recent lows in 2015. The technical structure suggests a growing upside momentum. The pair is trading above from its 200 DMA. Strong resistance can be found at 0.9500 psychological level.
EUR/CHF Drifting higher.
EUR/CHF is now moving slightly higher. Hourly resistances can be found at 1.0695 (07/04/2017 high and declining trendline). The medium-term pattern suggests us to see continued bearish pressures towards key support that can be found at 1.0623 (24/06/2016 low). Expected to see further decline.
In the longer term, the technical structure is mixed. Resistance can be found at 1.1200 (04/02/2015 high). Yet,the ECB's QE programme is likely to cause persistent selling pressures on the euro, which should weigh on EUR/CHF. Supports can be found at 1.0184 (28/01/2015 low) and 1.0082 (27/01/2015 low).
USD/CHF Short-Term Downside Momentum Continues, USD/CAD Moving Sharply Higher, AUD/USD Moving Sharply Lower.
USD/CHF Short-term downside momentum continues.
USD/CHF failed to breach 1.0107 dropping sharply to support. The short-term technical structure is negative as long as prices remain below the hourly resistance at 1.0171 (07/03/2017). Hourly support is given at 0.9955 (30/03/2017 base low) then 0.9814 (27/03/2017 low).
In the long-term, the pair is still trading in range since 2011 despite some turmoil when the SNB unpegged the CHF. Key support can be found 0.8986 (30/01/2015 low). The technical structure favours nonetheless a long term bullish bias since the unpeg in January 2015.
USD/CAD Moving sharply higher.
USD/CAD is moving sharply higher from hourly support at 1.3265 confirming an underlying bearish trend. Hourly resistances can now be found 1.3456 (04/04/2017 high). Hourly support can be located at 1.3353 then at 1.2969 (31/01/2017 low).
In the longer term, there is a golden cross with the 50 dma crossing the 200 dma indicating further upside pressures. Strong resistance is given at 1.4690 (22/01/2016 high). Long-term support can be found at 1.2461 (16/03/2015 low).
AUD/USD Moving sharply lower.
AUD/USD has failed to break short term resistance at 0.7610, reversing bullish momentum. Hourly support is located at 0.7494 (13/01/2017 low). Key resistance stands at 0.7681 (30/03/2017 high).
In the long-term, we are waiting for further signs that the current downtrend is ending. Key supports stand at 0.6009 (31/10/2008 low) . A break of the key resistance at 0.8295 (15/01/2015 high) is needed to invalidate our long-term bearish view.
EUR/USD Moving Higher, GBP/USD Moving Sharply Higher, USD/JPY Failed To Challenge Support At 108.22
EUR/USD Moving higher.
EUR/USD has further improved as seen by the break of the resistances area given by 1.0679. Hourly support can be found at 1.0650 (18/04/2017 base) then 1.0570 (11.04.2017 low). Stronger support can be found at 1.0494 (22/02/2017 low). A key resistance stands at 1.0874.
In the longer term, the death cross late October indicated a further bearish bias. The pair has broken key support given at 1.0458 (16/03/2015 low). Key resistance holds at 1.1714 (24/08/2015 high). Expected to head towards parity.
GBP/USD Moving sharply higher.
GBP/USD is moving sharply higher from key support at 1.2334, suggesting a deeper shortterm base formation. Resistance stands at 1.2605 (18/04/2017 reaction high) then 1.2953. An hourly support can be found at 1.2581 (12/04/2017 base) then 1.2405 (11/04/2017 low).
The long-term technical pattern is even more negative since the Brexit vote has paved the way for further decline. Long-term support given at 1.0520 (01/03/85) represents a decent target. Long-term resistance is given at 1.5018 (24/06/2015) and would indicate a long-term reversal in the negative trend. Yet, it is very unlikely at the moment.
USD/JPY Failed to challenge support at 108.22
USD/JPY has broken to the downside out of the horizontal support at 110.11 confirming a bearish bias. Next support can be located at 108.22 (17/04/2017 low). Other key supports lie at a distant 106.04 (11/11/2016 low). Hourly resistance stands at 109.10 (18/04/2017 high). Other resistance can be found at 110.11, while a key resistance stands at 112.20 (31/03/2017 high).
We favor a long-term bearish bias. Support is now given at 96.57 (10/08/2013 low). A gradual rise towards the major resistance at 135.15 (01/02/2002 high) seems absolutely unlikely. Expected to decline further support at 93.79 (13/06/2013 low).
Technical Outlook: AUDUSD Extends Weakness Below 100SMA, Key Support At 0.7471 Now In Focus
The Aussie dollar remained under strong pressure on Wednesday and accelerated further down, extending pullback from Monday’s recovery peak at 0.7607.
The pair hit fresh low at 0.7503 (Fibo 76.4% of 0.7471/0.7608 recovery rally, after surging through strong supports at 0.7523 (Fibo 61.8%) and 0.7519 (100SMA).
This signaled an end of corrective phase and turned focus towards key near-term support at 0.7471 (12 Apr low / daily cloud base).
Asymmetric H&S pattern is forming on daily chart neckline lies just under 0.7471 pivot) with break lower to signal fresh downside acceleration for further retracement of larger 0.7158/0.7747 ascend.
Daily MA’s are turning in full bearish setup and along with indicators in the negative territory, maintain strong pressure.
Broken daily Tenkan-sen (currently at 0.7540) and 200 SMA (0.7550) offer strong barriers and are expected to ideally cap corrective upticks.
Res: 0.7518, 0.7540, 0.7550, 0.7576
Sup: 0.7503, 0.7471, 0.7453, 0.7383